MyObservability
Synthetic Monitor Management
- Single-URL Browser monitor
- Browser Clickpath monitor
- Configuring browser monitors
- Browser monitor Availability and Performance
- Browser Monitor Advanced Setup
- Using Browser Monitor Script Mode
- Creating HTTP Monitors
- Configuring HTTP Monitors
Single-URL Browser monitor
A single-URL browser monitor is used to check availability and performance of a single page of your website or web application.
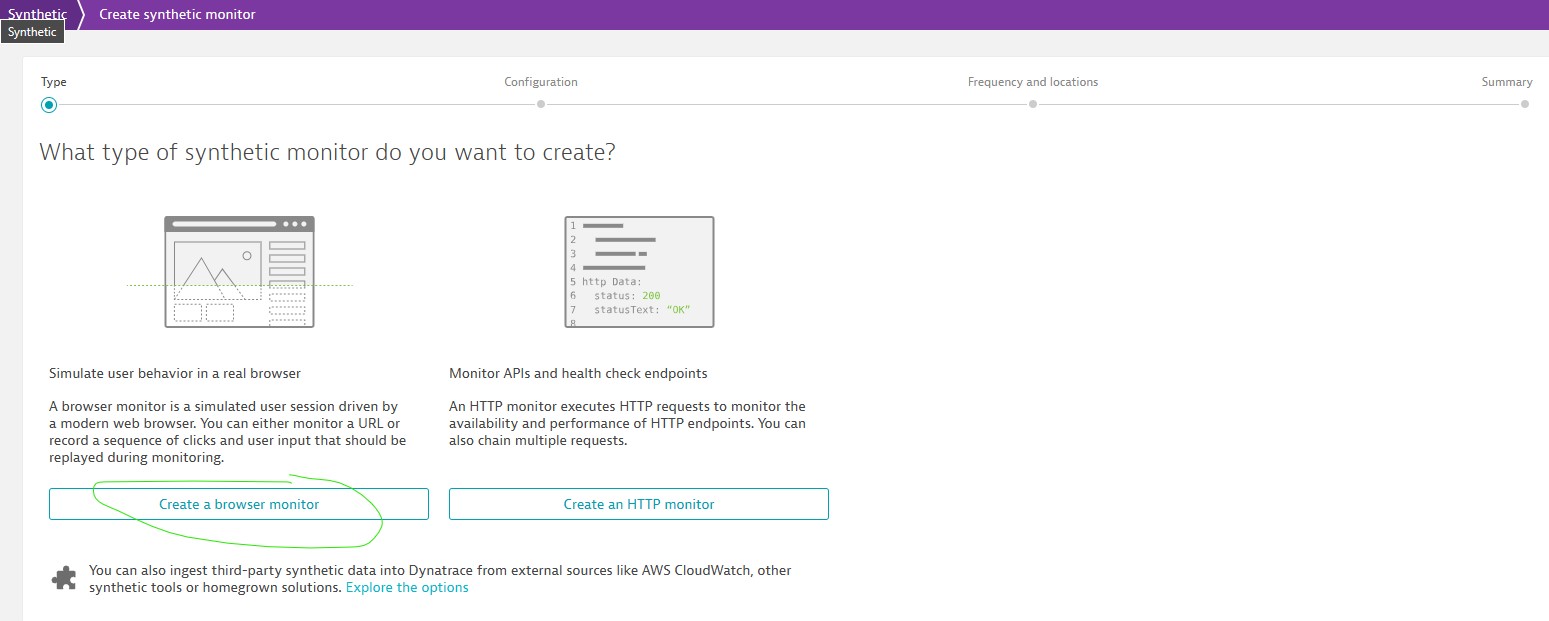
Browser Clickpath monitor
You need a browser clickpath to ensure key functionality is available and performing well.
You need to add Dynatrace plugin - “Install Dynatrace Synthetic Recorder” to record clickpath and enable “Add to incognito mode”. You can also add Manual click path events.
Once you add and refresh Dynatrace page, Click “Record Clickpath” and perform the steps to complete the workflow or function you want to monitor.
Additional step
Once you record, if you want to Add any steps manually in between, choose synthetic event type from the following list.
- Click/Tap: Define where on the page to perform the event.
- Keystroke: capture strings typed into a field.
- Select: Selection from a drop down list.
- Javascript: Includes snippets of javascript code.
- Cookie: Store the browser state information.
It is recommended that you play back the clickpath before committing your changes.
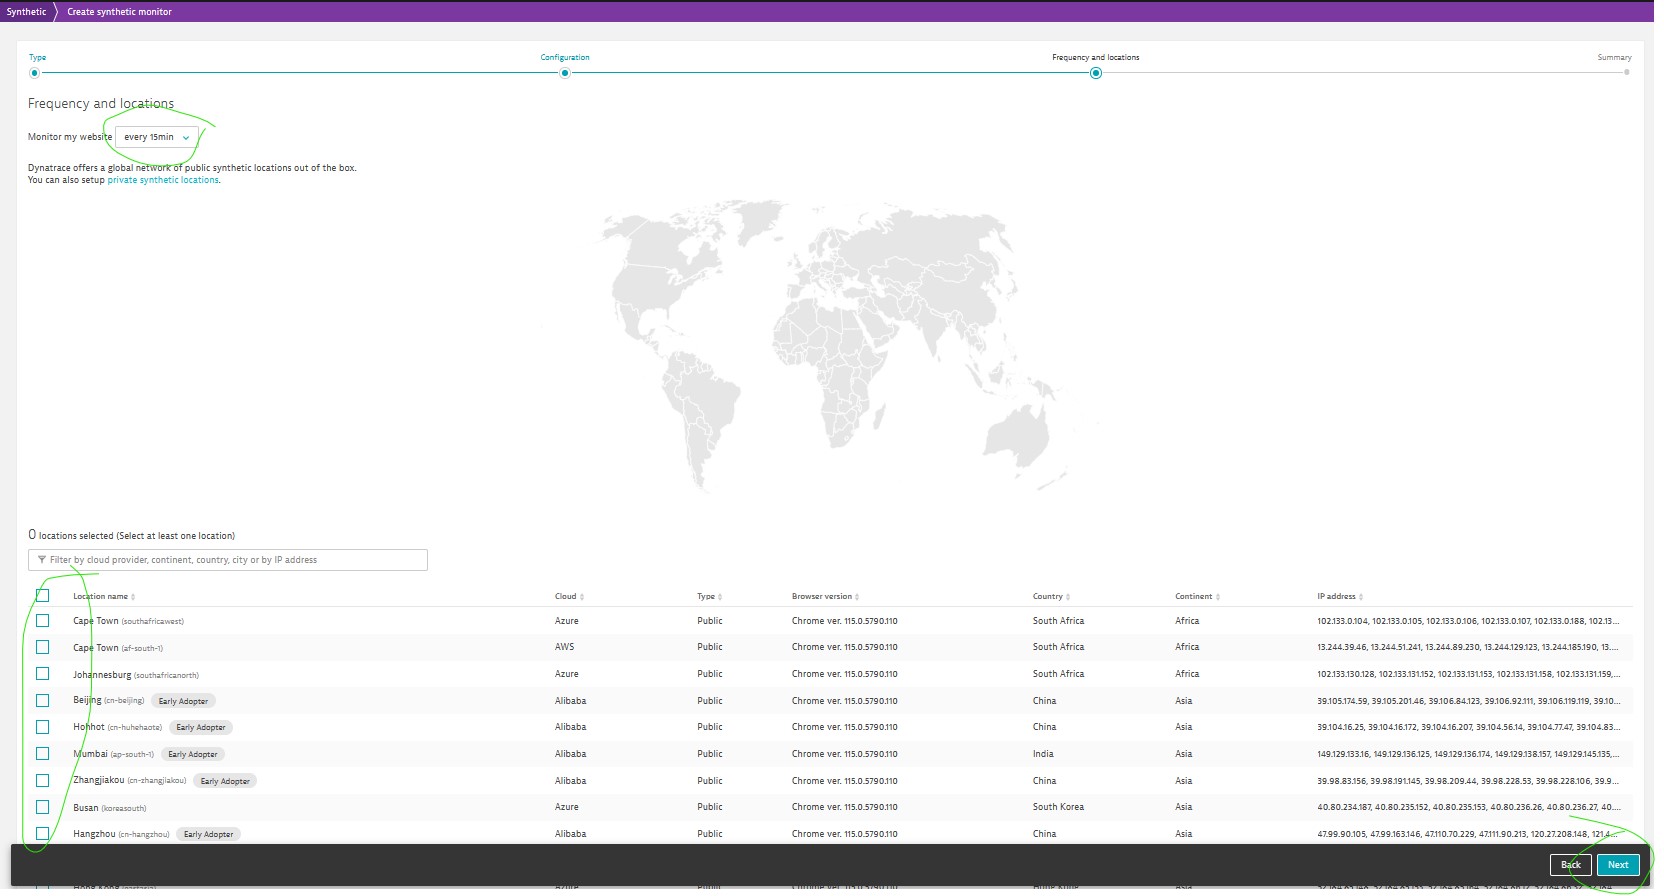
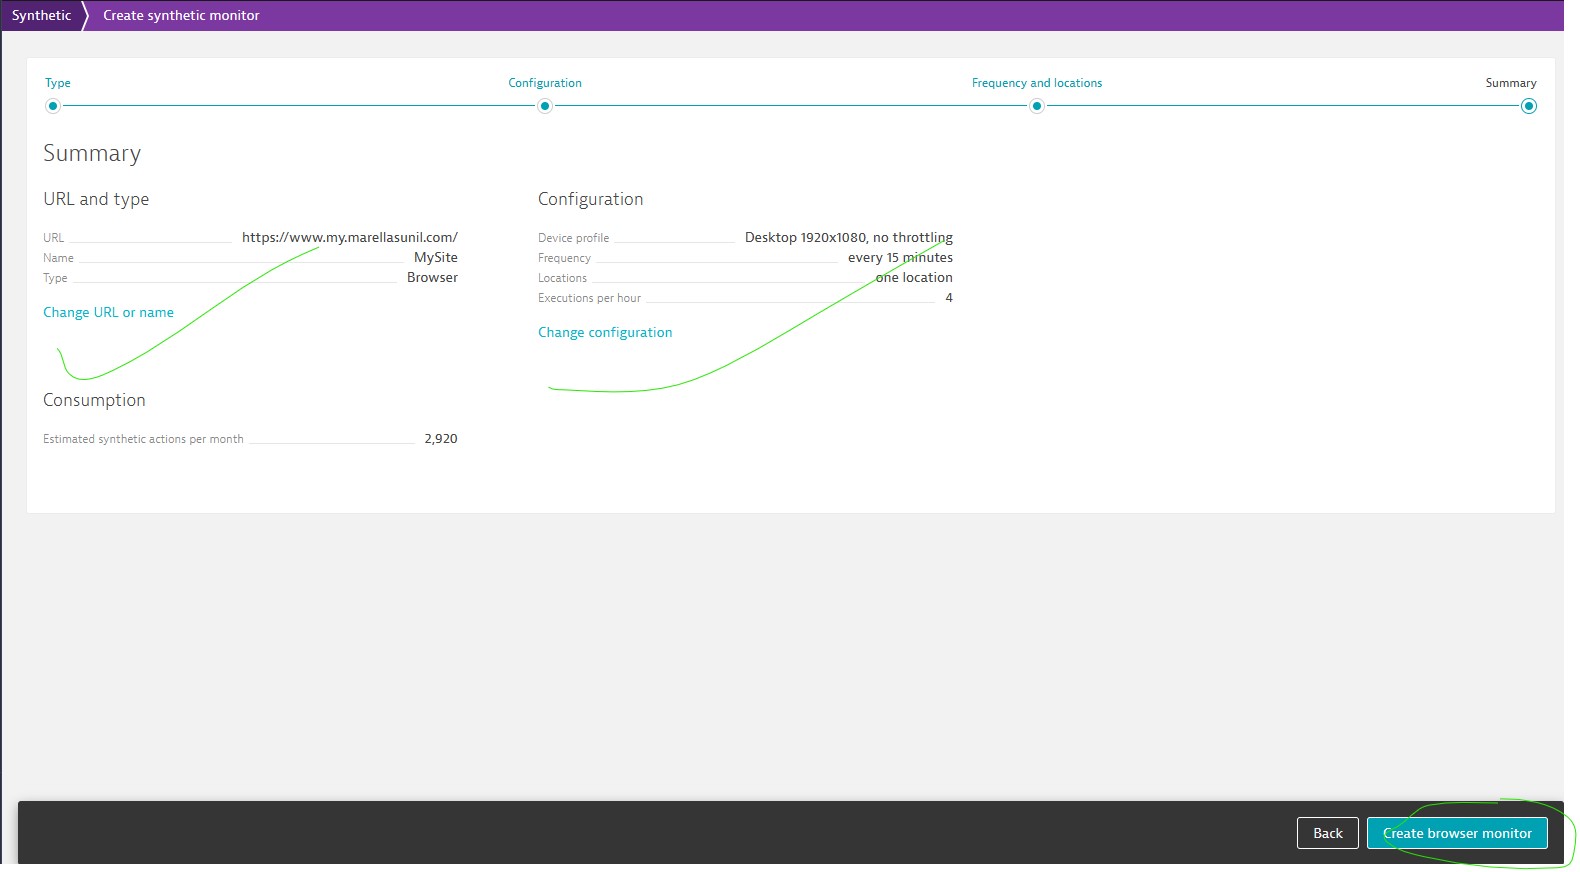
Click frequency and locations, then save
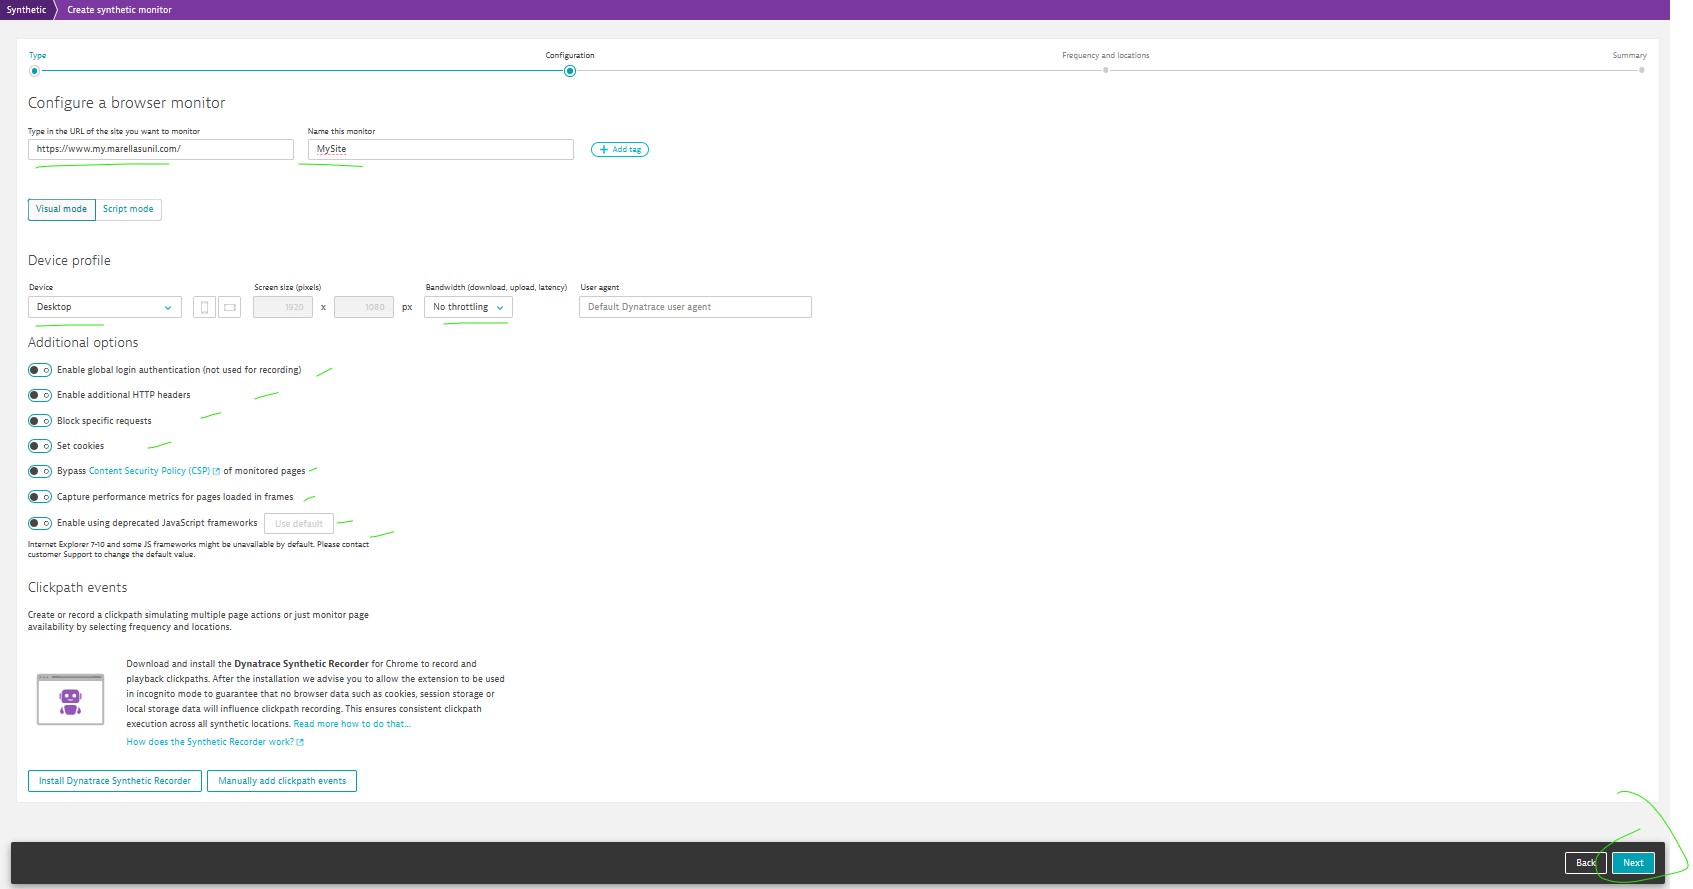
Configuring browser monitors
You can edit already exisiting synthetic scripts.
Key performance metrics Select the key performance metric that best represents the user experience of this synthetic monitor. Visually complete is the default metric for load and XHR actions. It measures how long it takes for the visible portion of each user’s browser screen to be fully rendered. The key performance metric for custom actions is always User action duration.
Recorded Clickpath</ins</b> Add / edit / change clickpath events. You can change configuration like waittime for next action, element locator to identify CSS & DOM elements etc for each clickpath event.
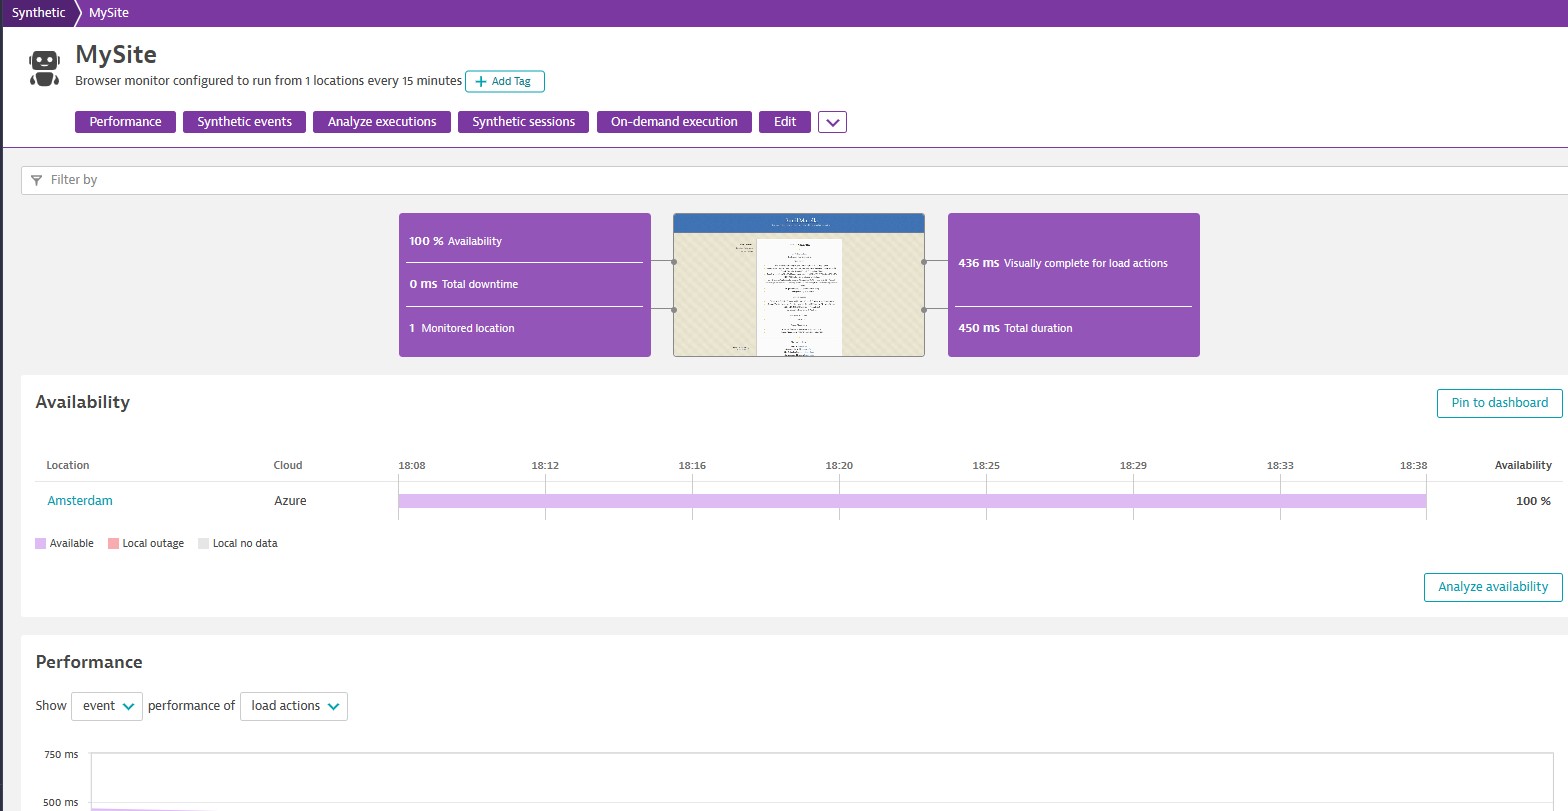
Browser monitor Availability and Performance
Outage handling and thresholds for generating availability and performance problems can be configured after monitor creation.
- Outage handling:
- Dynatrace can generate problems for both global outages and/or local outages based on the availability of either all configured locations or only individual locations over consecutive runs.
- Automatic retry on error: When enabled, which is the default, failing monitor executions are retried immediately one time to avoid false positives and only the second result is used. When disabled, we use the first result right away.
- Ignore specific status code.
- Performance Threshold:
- You can add thresholds for all synthetic events or individual synthetic events.
- Alternatively, you can use custom metrics to alert on various synthetic metrics - create a custom event for alerting for this monitor
If 3 of the 5 most recent executions exceed any of the defined thresholds, a problem is created.
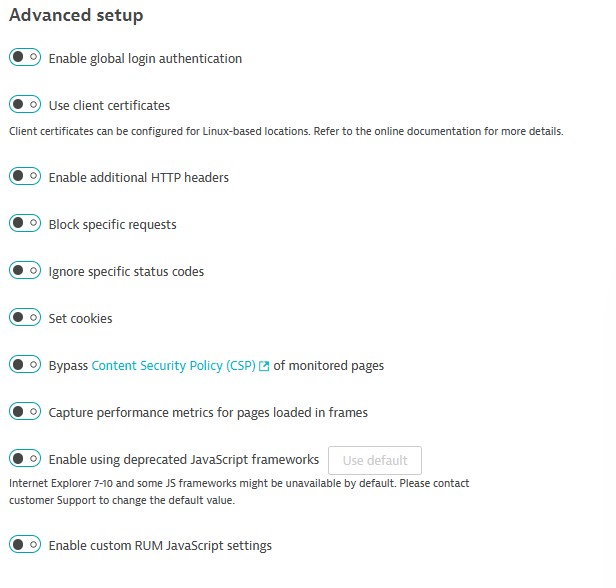
Browser Monitor Advanced Setup
It allows to fine tune the behavior of synthetic browser monitors.
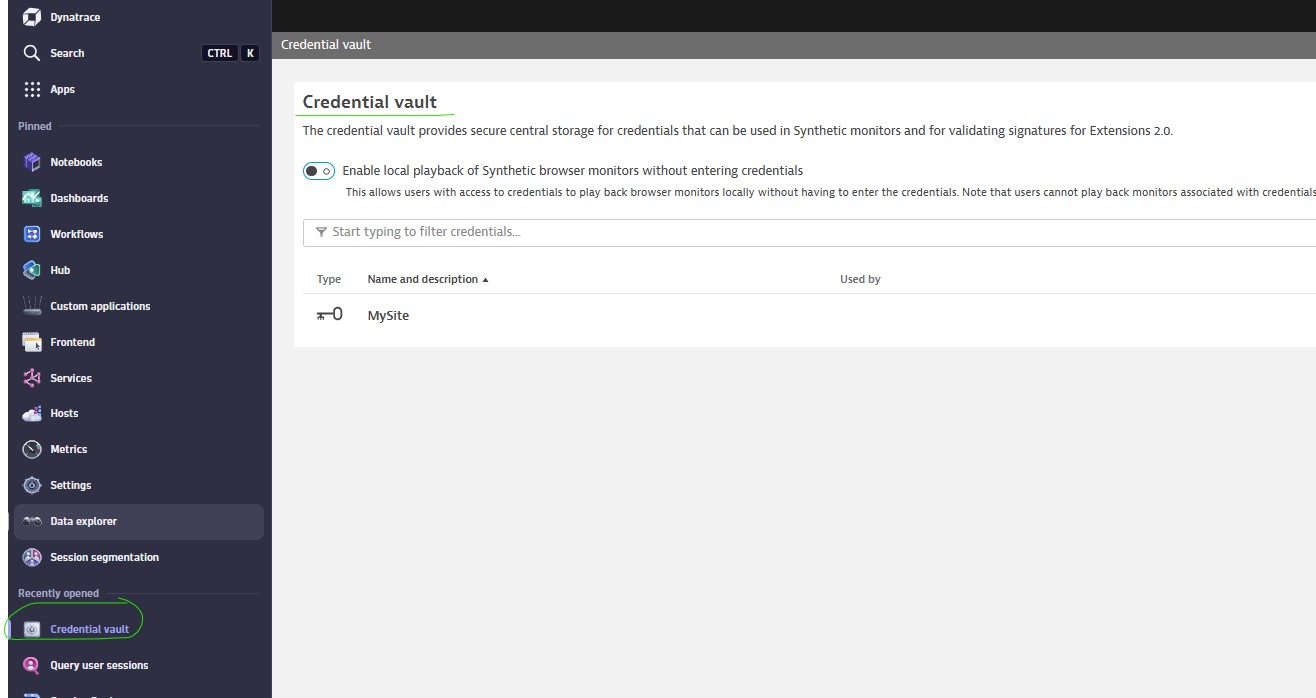
Crednetial Vault
Types:
- User name & password
- Certificate authentication
- Token
- Public Certificate
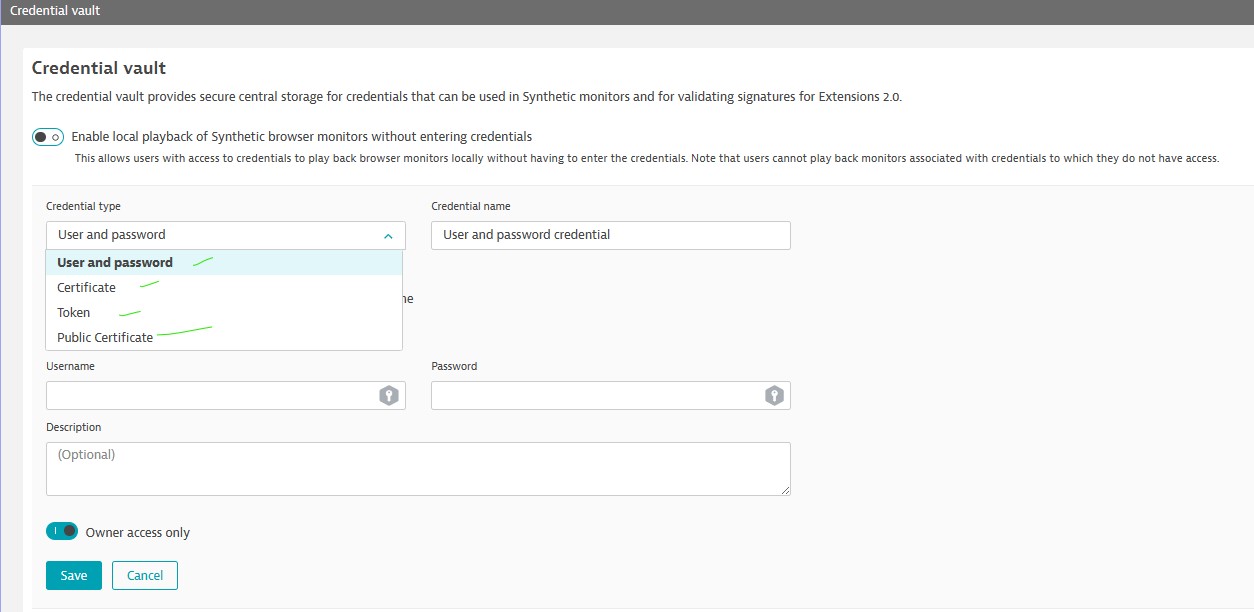
Owner access only option to make credentials available to other users with credential vault access.
Using Browser Monitor Script Mode
Script mode provide access to the underlying JSON script for configuration of browser monitors.
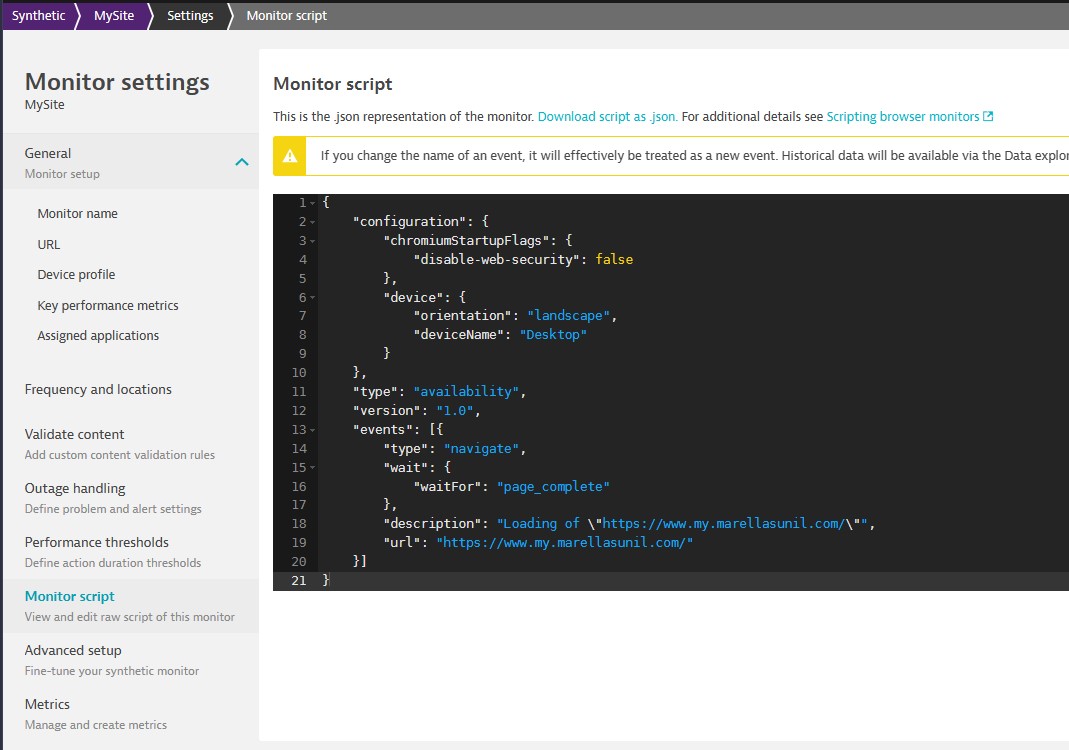
ctrl+space for auto populating the code.
Creating HTTP Monitors
You can monitor endpoints that do n’t directly expose a front end. These can be APIs used by your mobile apps or health check endpoints provided by microservices.
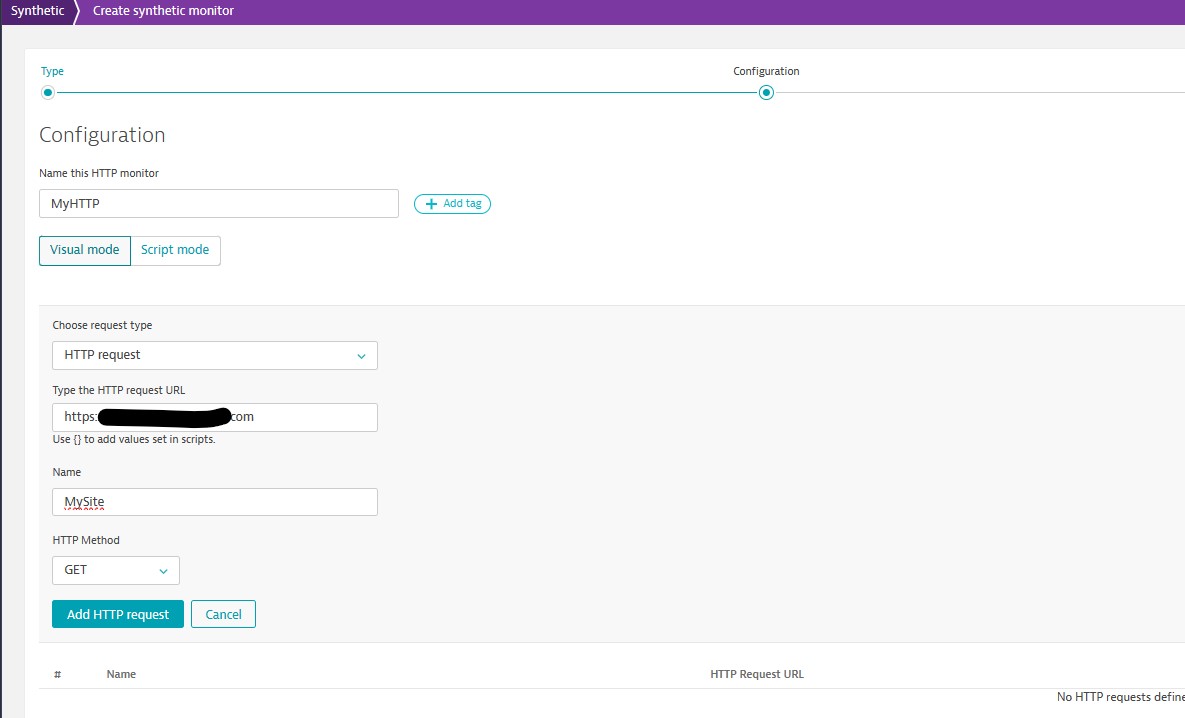
Choose the options & then save.
2 types of HTTP Monitors
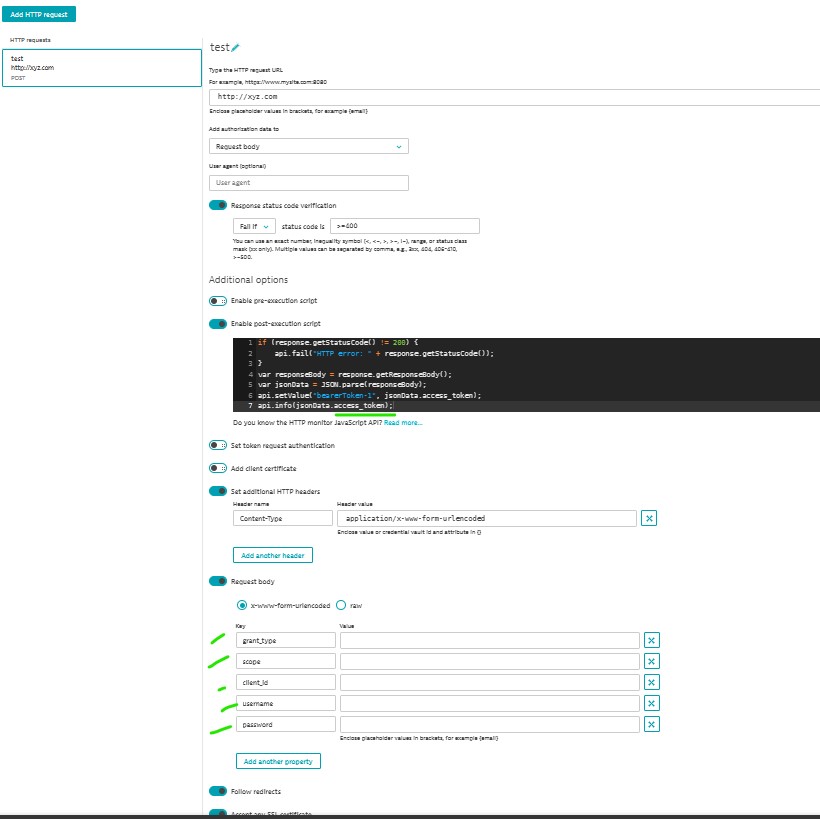
- HTTP request
- OAuth2 authorization request - This is commonly used for querying API end points.
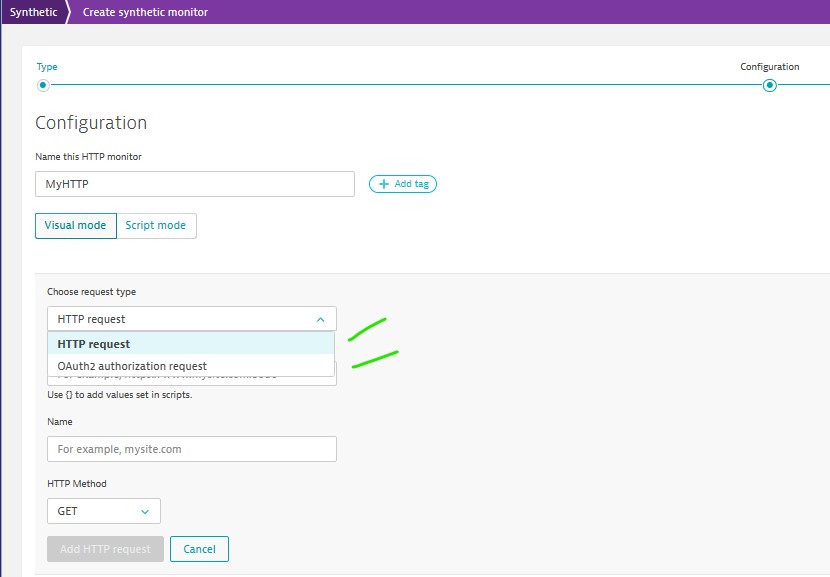
For OAuth2 authorization request, provide access token & POST parameters in the request body.
The Oauth2 request needs to be before the subsequent HTTP request that query the API end point.
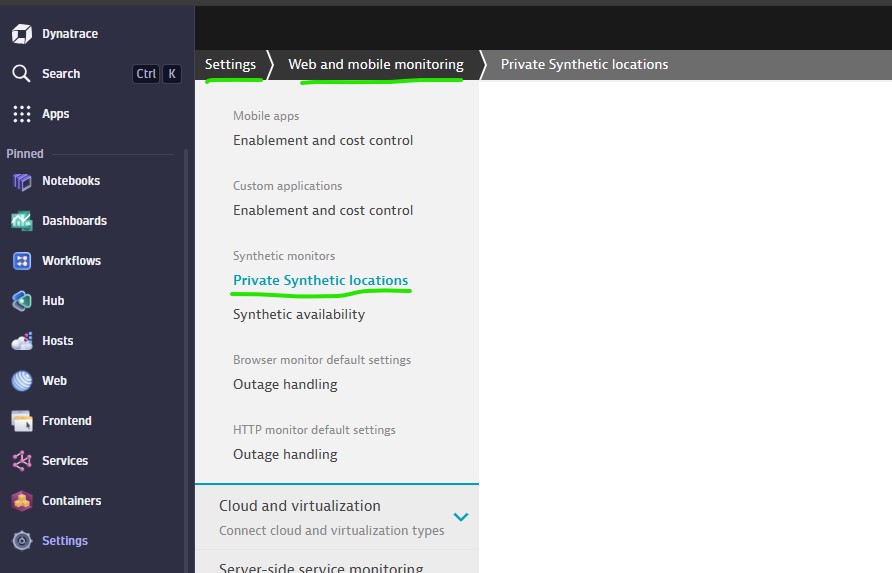
Synthetic locations:
- Public location
- Private location: Allow you to check availability of resources that are only accessible from inside your network.
These need to create on Environment ActiveGates.
Execute synthetic monitors from private locations
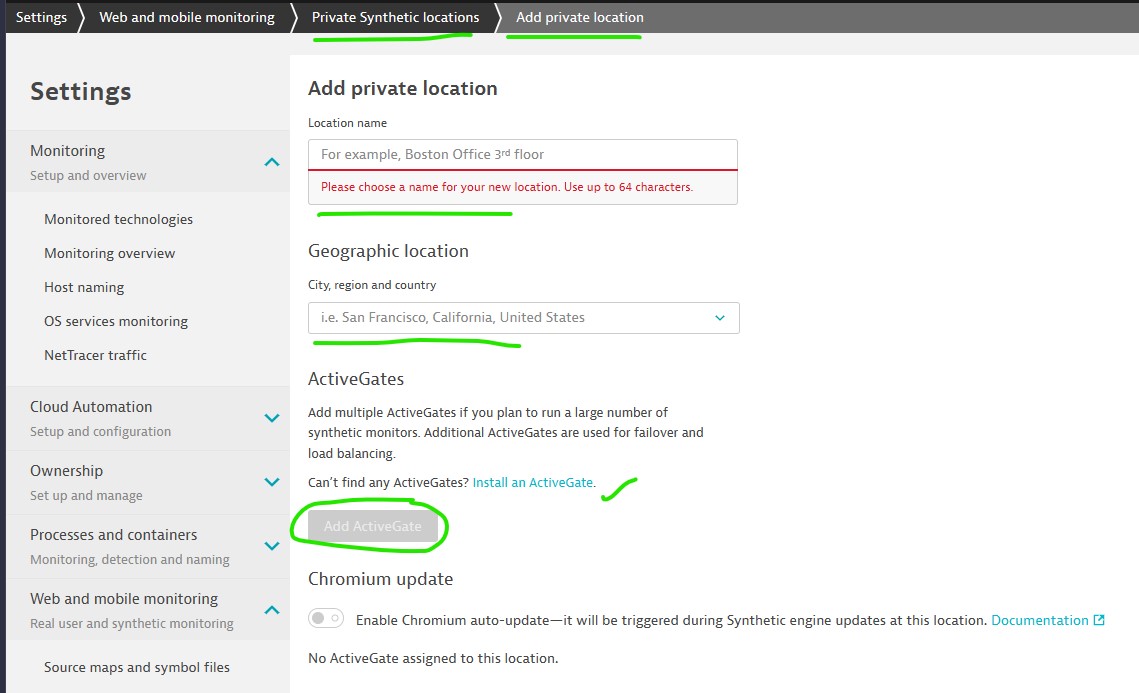
Synthetic-enabled ActiveGates enable you to set up private Synthetic locations from which you can execute synthetic monitors to monitor your internal as well as external resources.
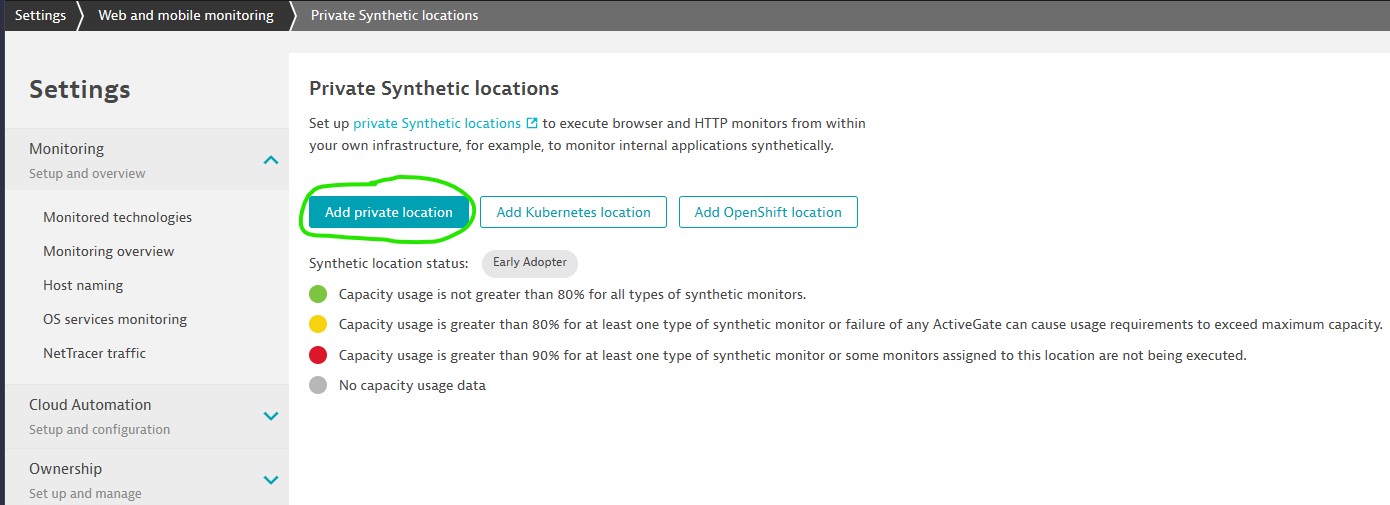
Select Activegate from drop down or Install Active gate and select Activegate from drop down.
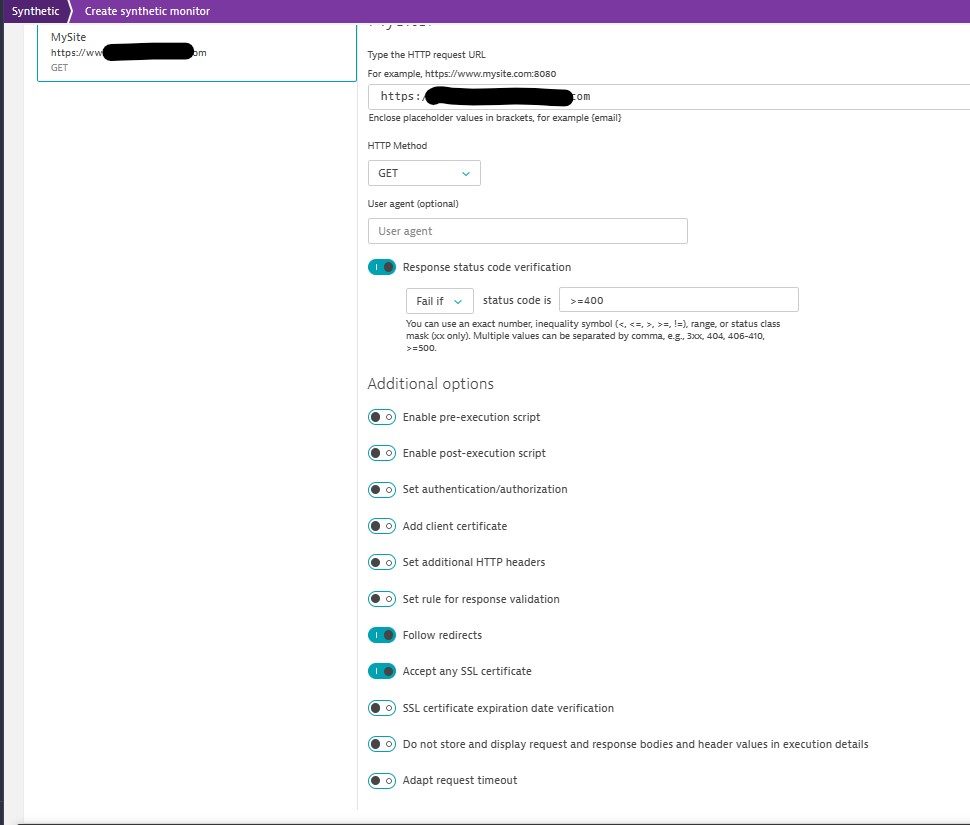
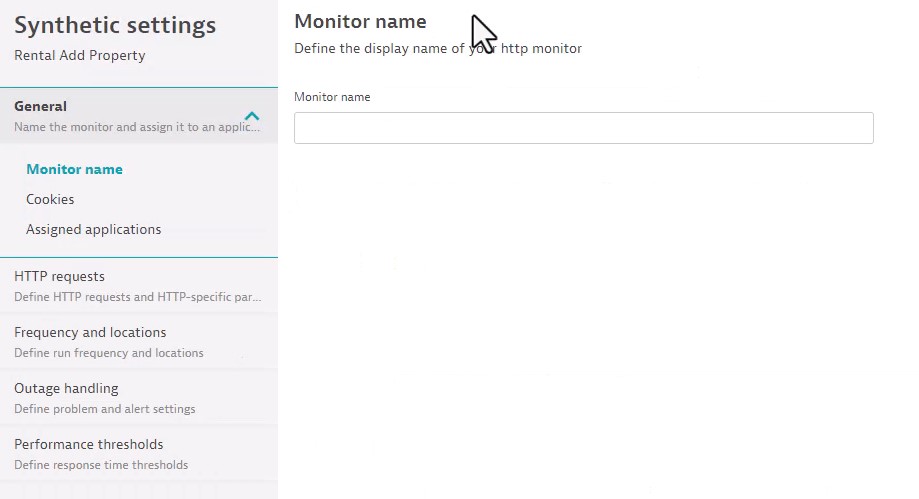
Configuring HTTP Monitors
Open HTTP monitor and edit for other configurations.
Next Page: Synthetic Monitoring
Main Page: Digital Experience Monitoring
Dynatrace : Main Page