MyObservability
Synthetic Monitoring
- Reviewing Browser Monitor Data
- Browser Monitor Analysis: Availability and Performance
- Browser Monitor Analysis: Failure and Errors
- HTTP Execution Analysis Tools
Reviewing Browser Monitor Data
All performance metrics, infographics & multidimentional analysis can see in each Synthetic script.
There are 3 main problem types for browser monitors
- Global outages
- Local outages
- Performance threshold violations
If RUM is enabled for the applications your synthetic monitor tests, Dynatrace automatically links the RUM applications tot he monitor.
Browser Monitor Analysis: Availability and Performance
- Browser monitor data allows you to keep tabs on the performance and availability of your applications.
- A much deeper analysis is available with built-in, multidimensional analysis graphs for availability, performance and errors.
Red bars indicate problems & gray bars indicate maintenance window/no data.
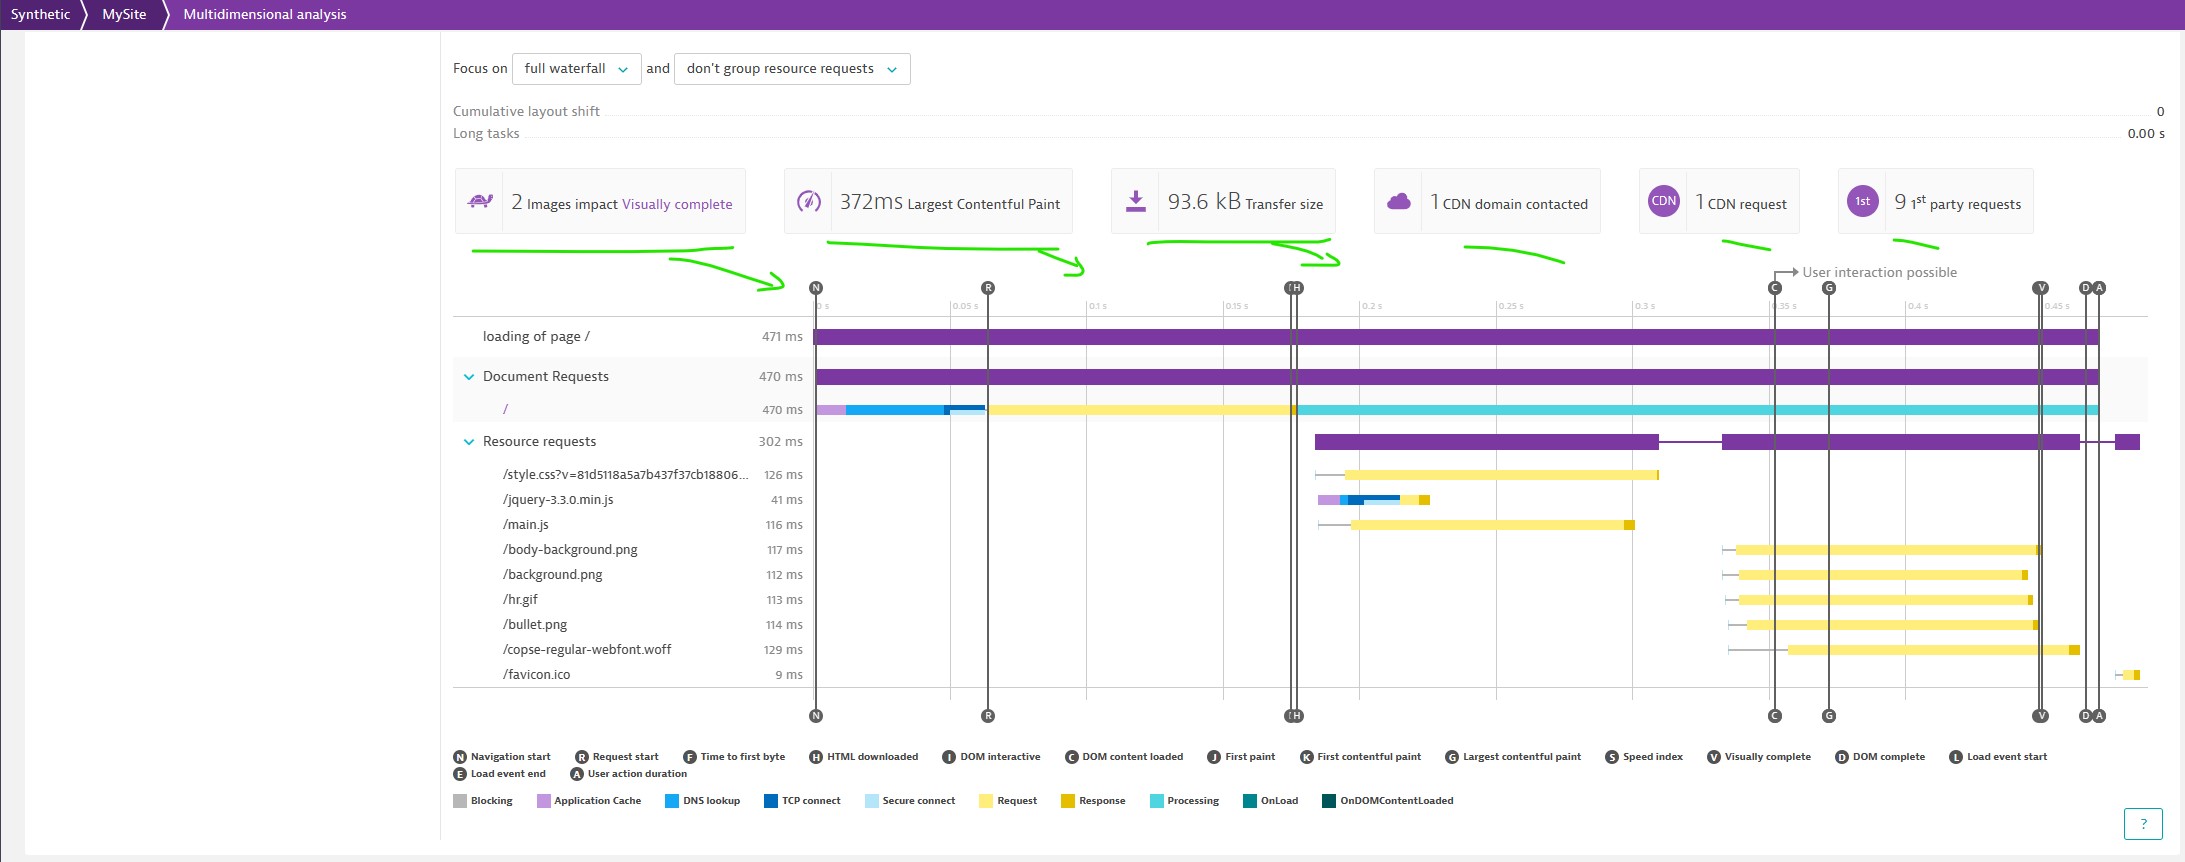
Multidimensional Analysis:

below will show screenshot of the events
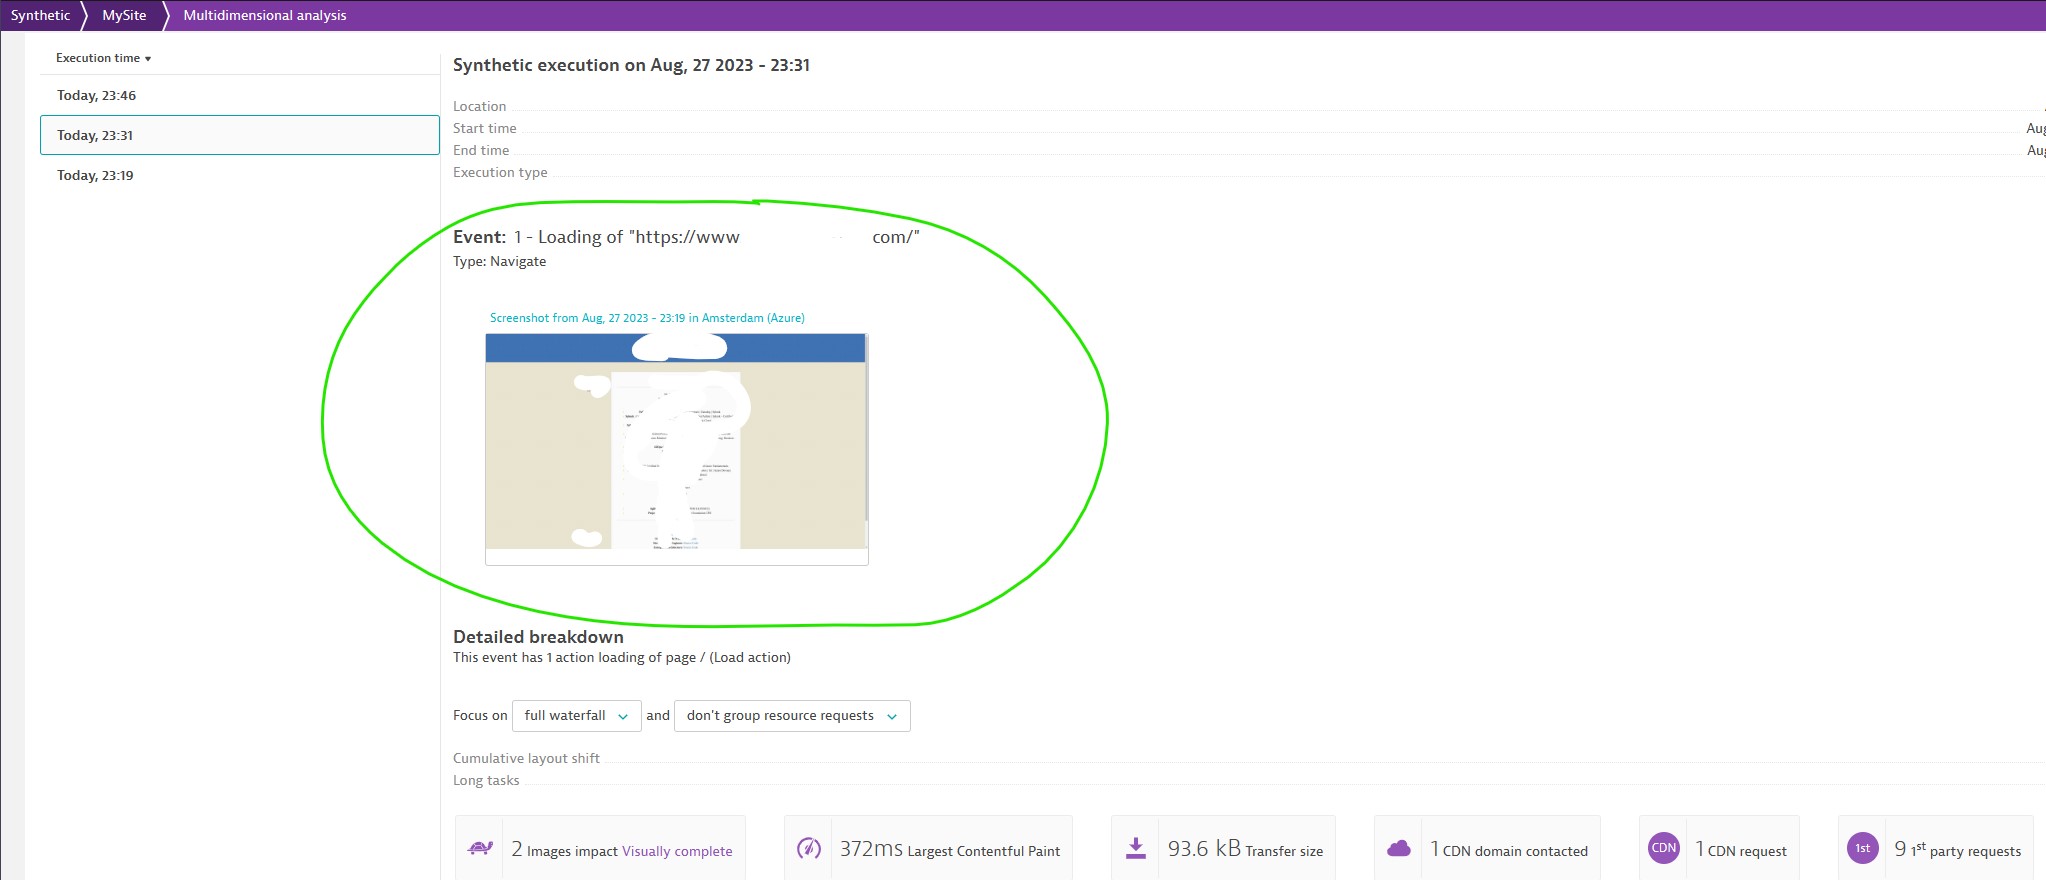
below will show waterfall graph about the individual resources that comprise a specific action in a synthetic monitor execution.
Browser Monitor Analysis: Failure and Errors
Dynatrace automatically select an appropriate wait time for synthetic monitor events. configuring your own wait options allows you to cause or prevent errors based on your needs.
Maximum timeouts for synthetic monitors are 5mins for the monitor as a whole & 60secs for an individual event. These program timeouts can not be changed.
HTTP Execution Analysis Tools
Execution analysis and on-demand execution tools can assist you in getting the most out of synthetic HTTP monitors.
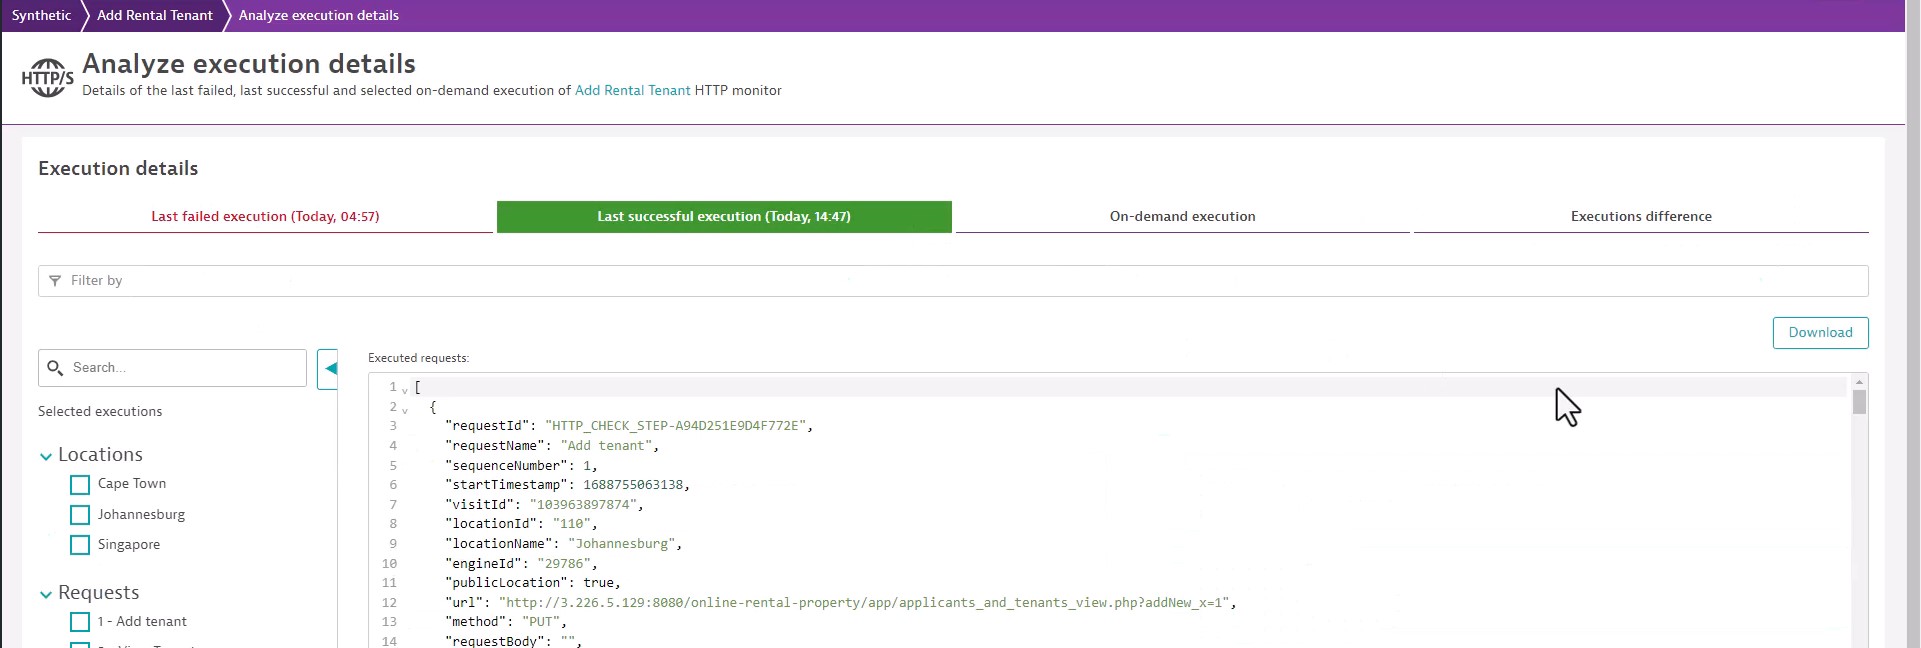
Execution analysis
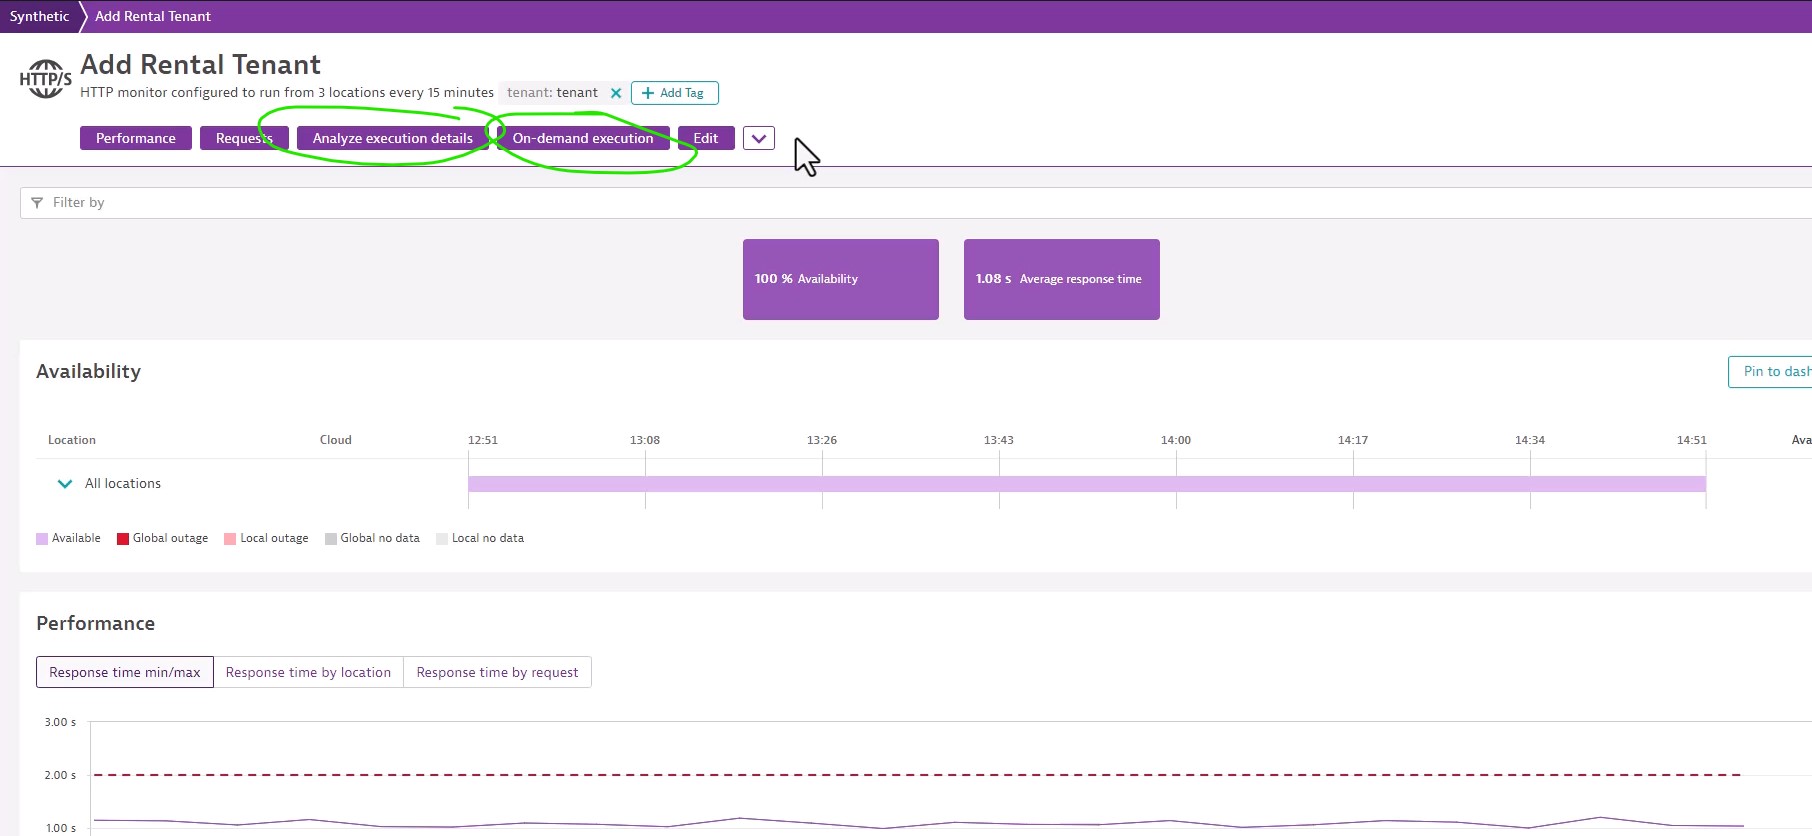
On-demand Executions
On-demand execution analysis tool enables you to trigger executions for the selected monitor from all locations or a selected location.
Main Page: Digital Experience Monitoring
Dynatrace : Main Page