MyObservability
Anomaly Detection
Anomaly Detection
Dynatrace automatically detects application-related performance anomalies such as
- Response time degradations
- Failure rate increases
- Traffic spikes/drops (RUM monitoring)
- Service load spikes/drop (Service monitoring)
- Process Monitoring (Availability)
To avoid false-positive problem notifications, automated anomaly detection is only available for applications and services that have run for at least 20% of a week (7 days).
Anomaly Detection Settings
- Global
- Application
- Service
- Host group
Thresholds Type
- Automatic thresholds
- Using fixed thresholds
Settings
Global Anomaly Detection Settings
Dynatrace automatically detects anomaly detection for all connected to Dynatrace unless anomaly detection configured individually.
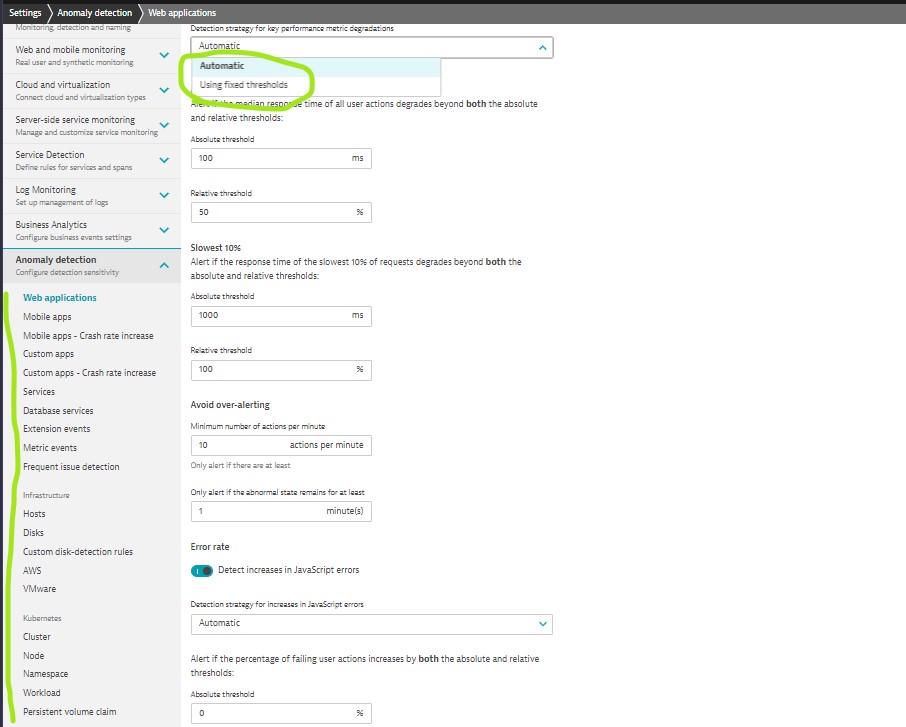
Configure anomaly detection for
- Web Applications
- Mobile applications & crash rate
- Custom applications & crash rate
- Services
- Database Services
- Extension events
- Metric events
- Infrastructre (Onprem/Cloud/Kubernetes)
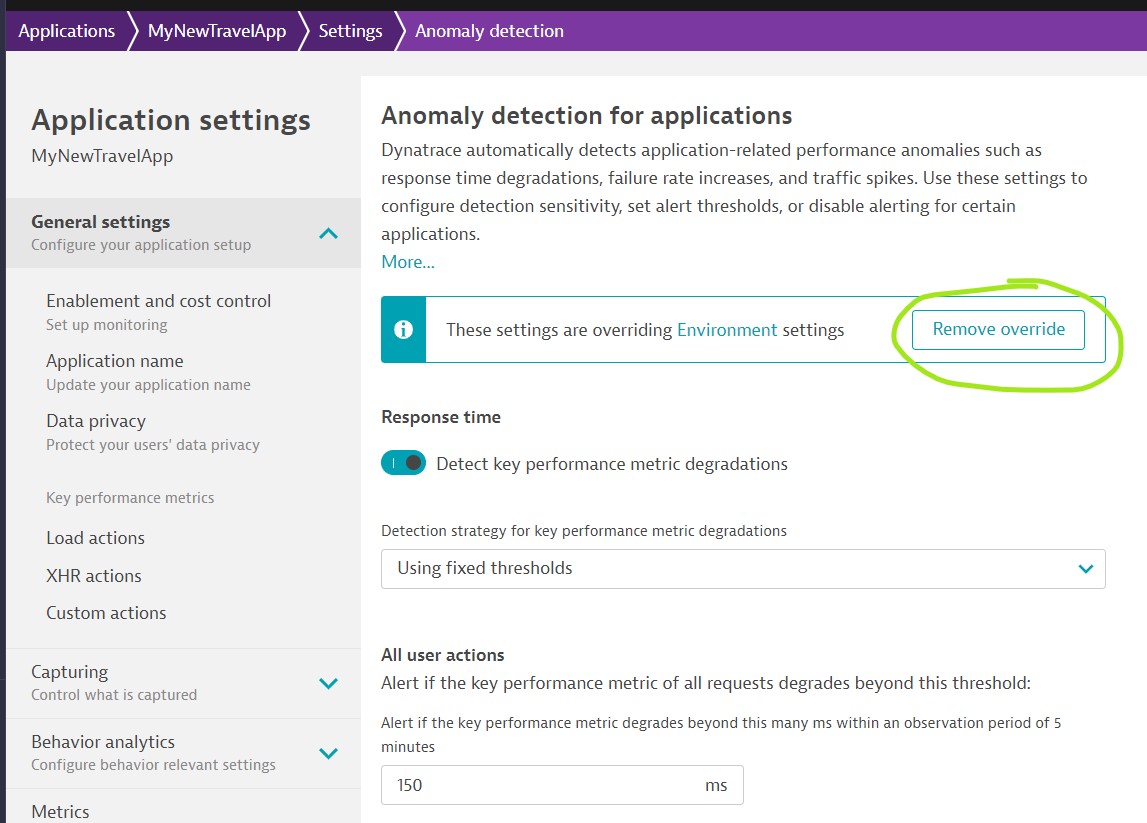
Application Anomaly Detection Settings
- If no settings defined on the current entity, using defaults set on Environment
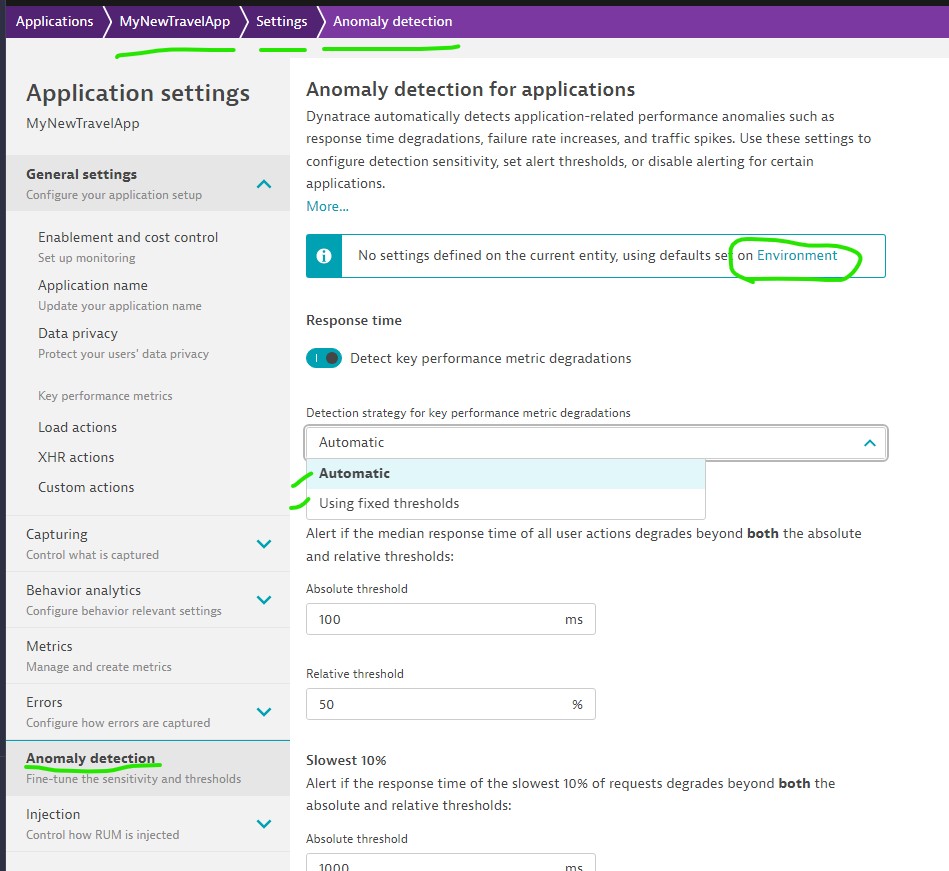
- Set thresholds at application level, settings are overriding Environment settings.
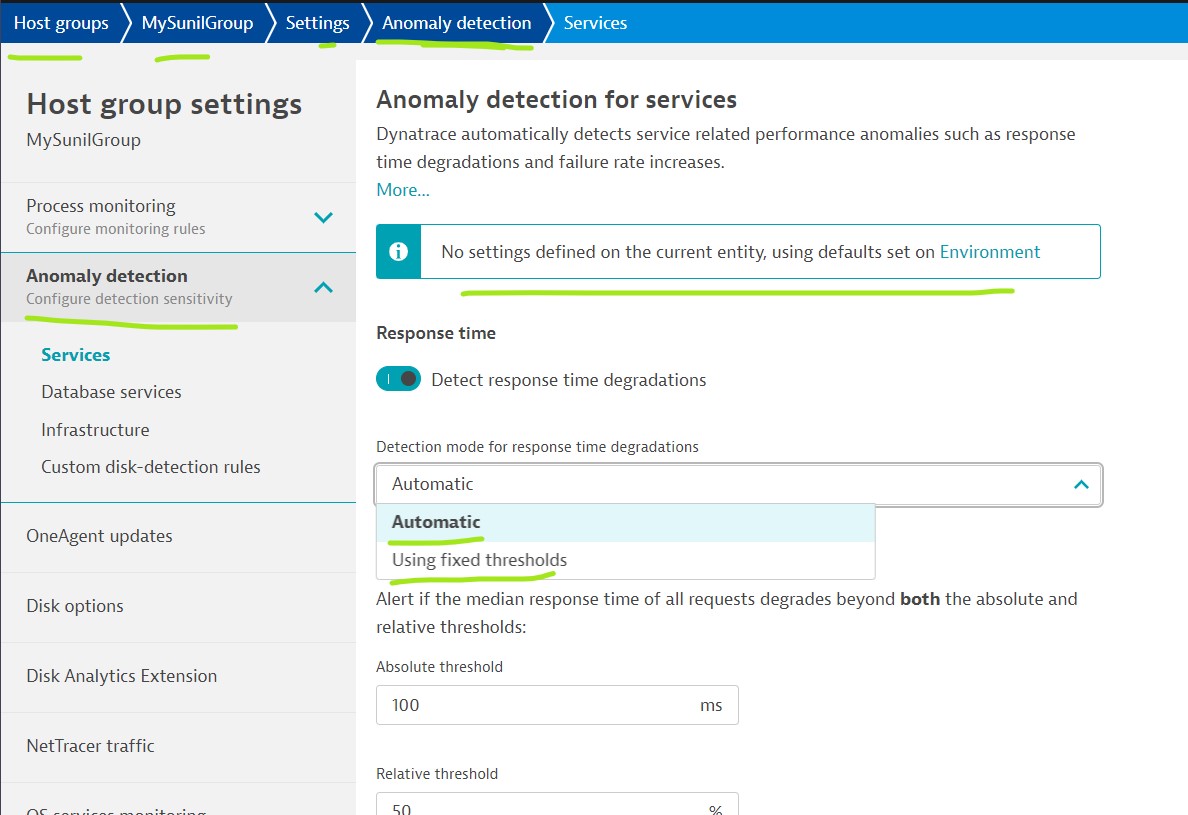
Host group Anomaly Detection Settings
Dynatrace automatically detects service related performance anomalies such as response time degradations and failure rate increases for
- Service level
- Database services
- Infrastructure
- Custom disk-detection rules
Service Anomaly Detection Settings
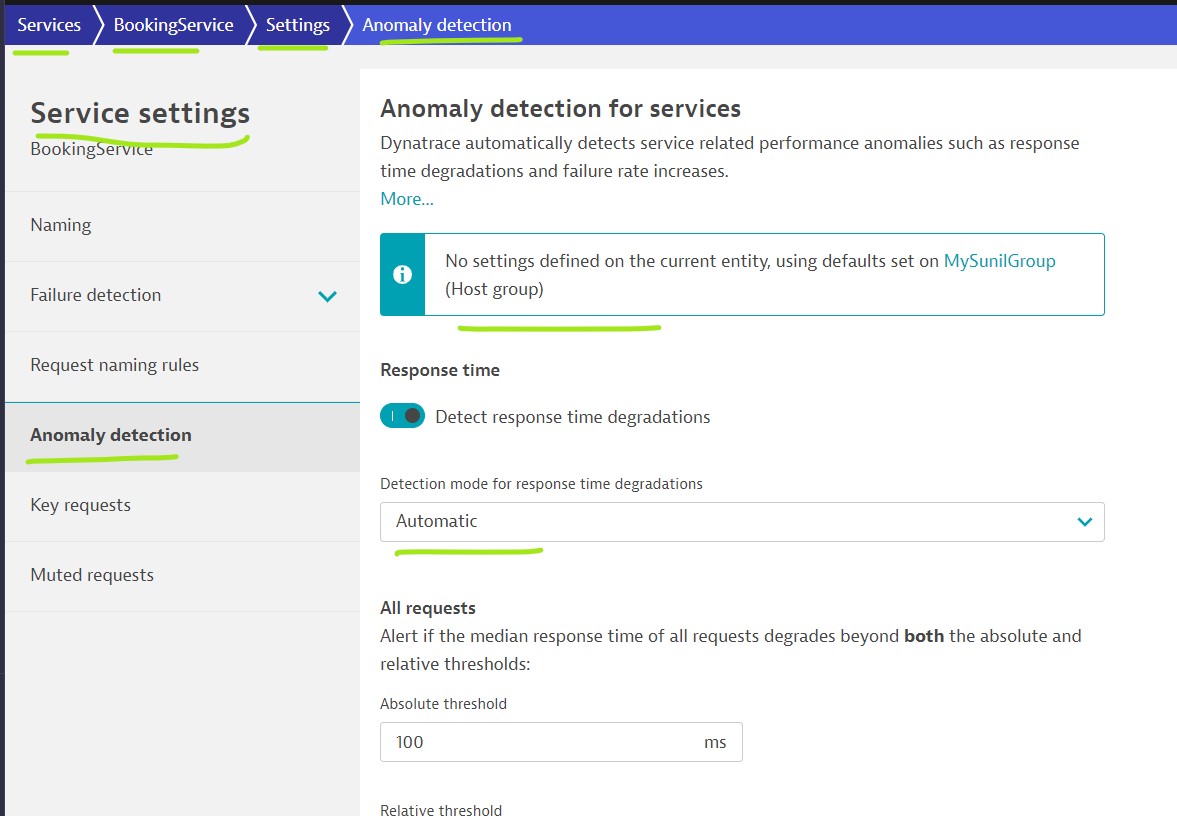
Service level monitoring: You can monitor Key requests seperatly. You can mute monitoring for requests for particular Service.
Ket requests: Key requests can be used to have long-term metric history and dedicated dashboard tiles for charting and direct access from your dashboard.
Muted requests: Each Service could have several Muted requests. Dynatrace enables you to mute automatic alerts for selected, unimportant service requests. This will also exclude them from the service chart so that you can focus on the performance of requests that affect your customers.
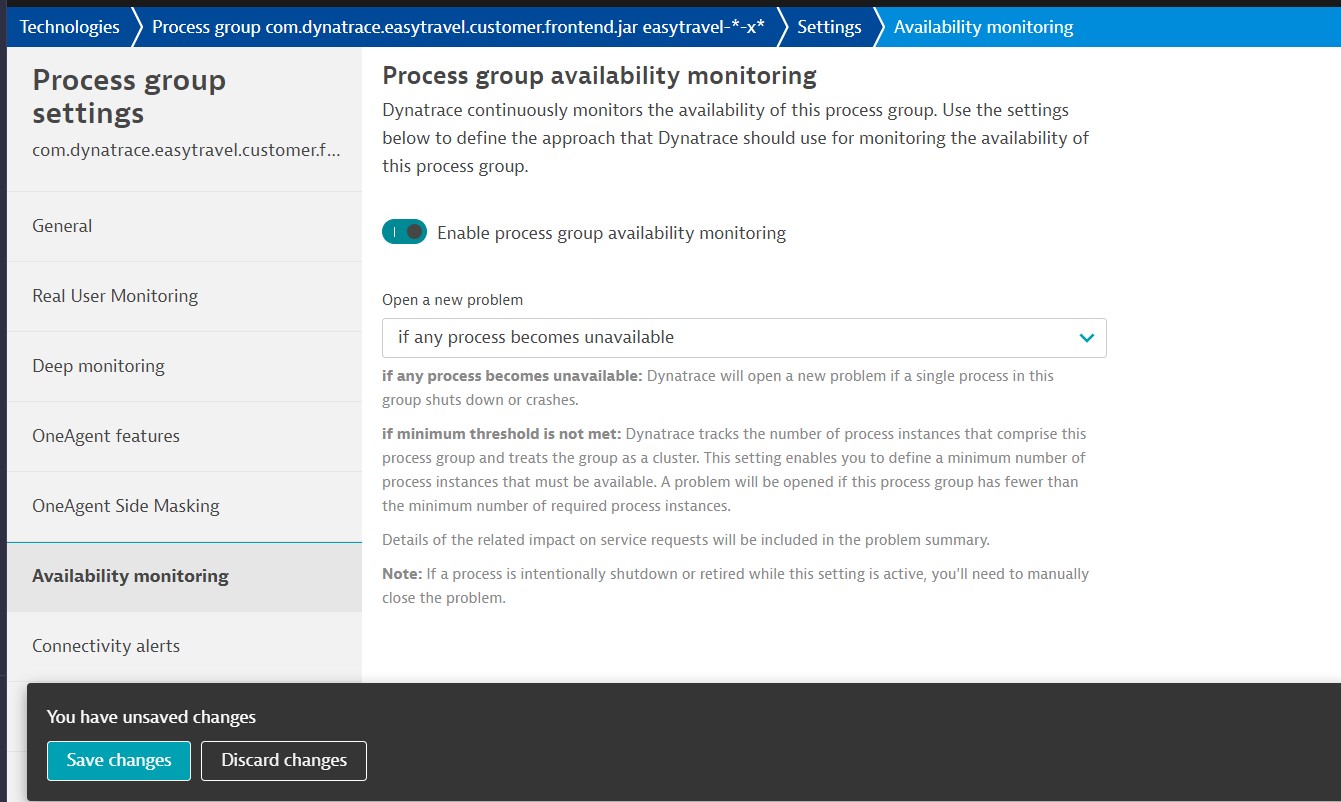
Process Monitoring
Dynatrace continuously monitors the availability of this process group.
- if any process becomes unavailable
- if minimum threshold is not met
Dynatrace : Main Page