MyObservability
Problem analysis & Reports
Problems in Dynatrace represent anomalies in normal behavior or state.
- Whenever a problem is detected, Dynatrace raises a specific problem event indicating such an anomaly.
- Raised problems provide insight into their underlying root causes.
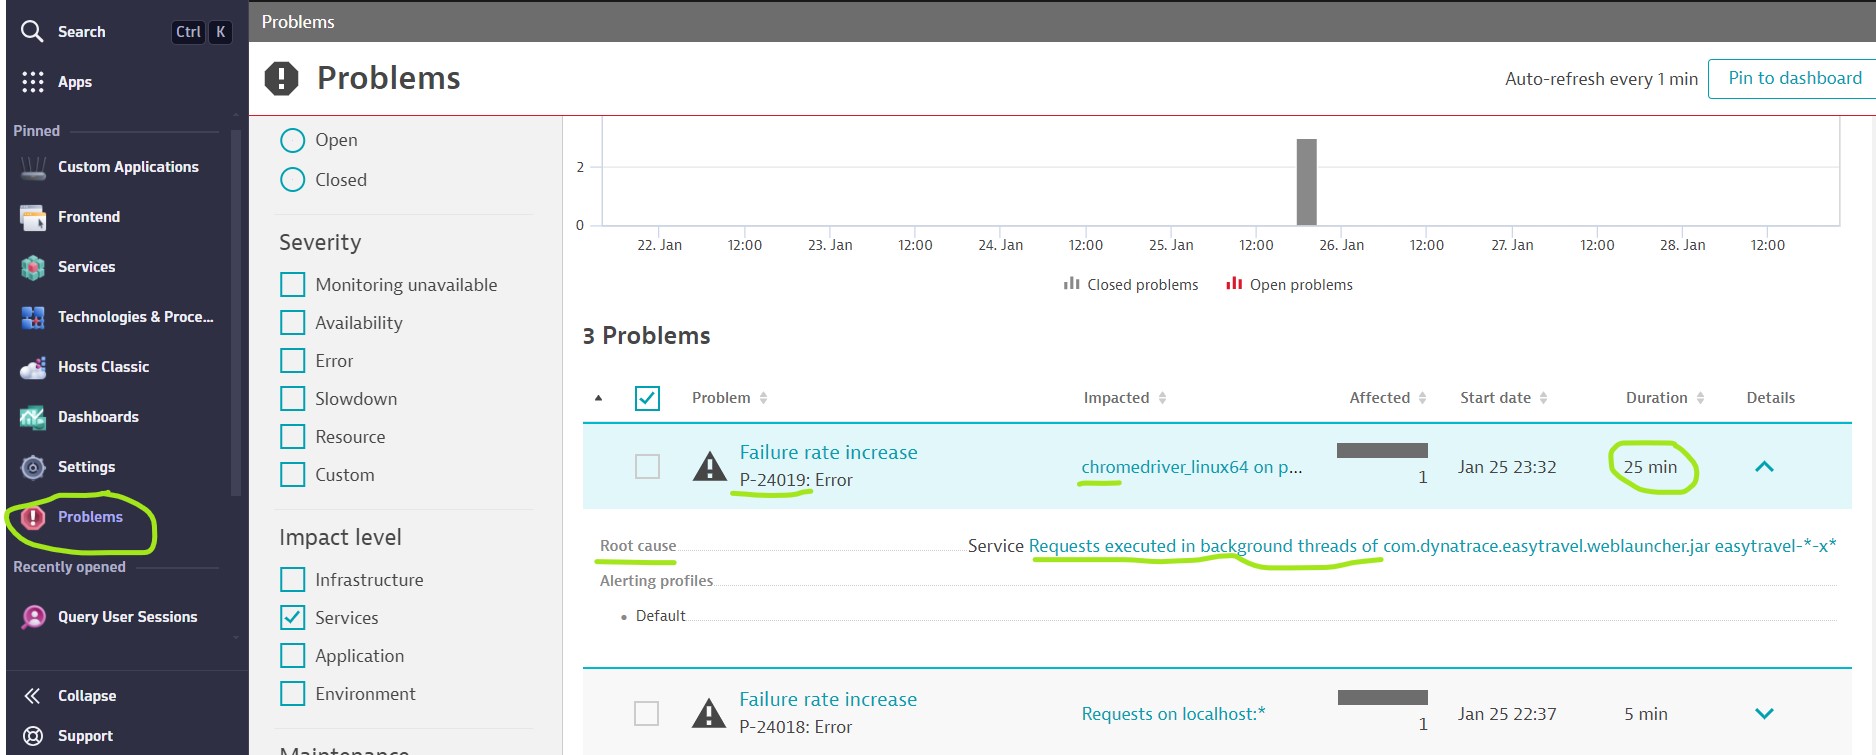
Root cause analysis

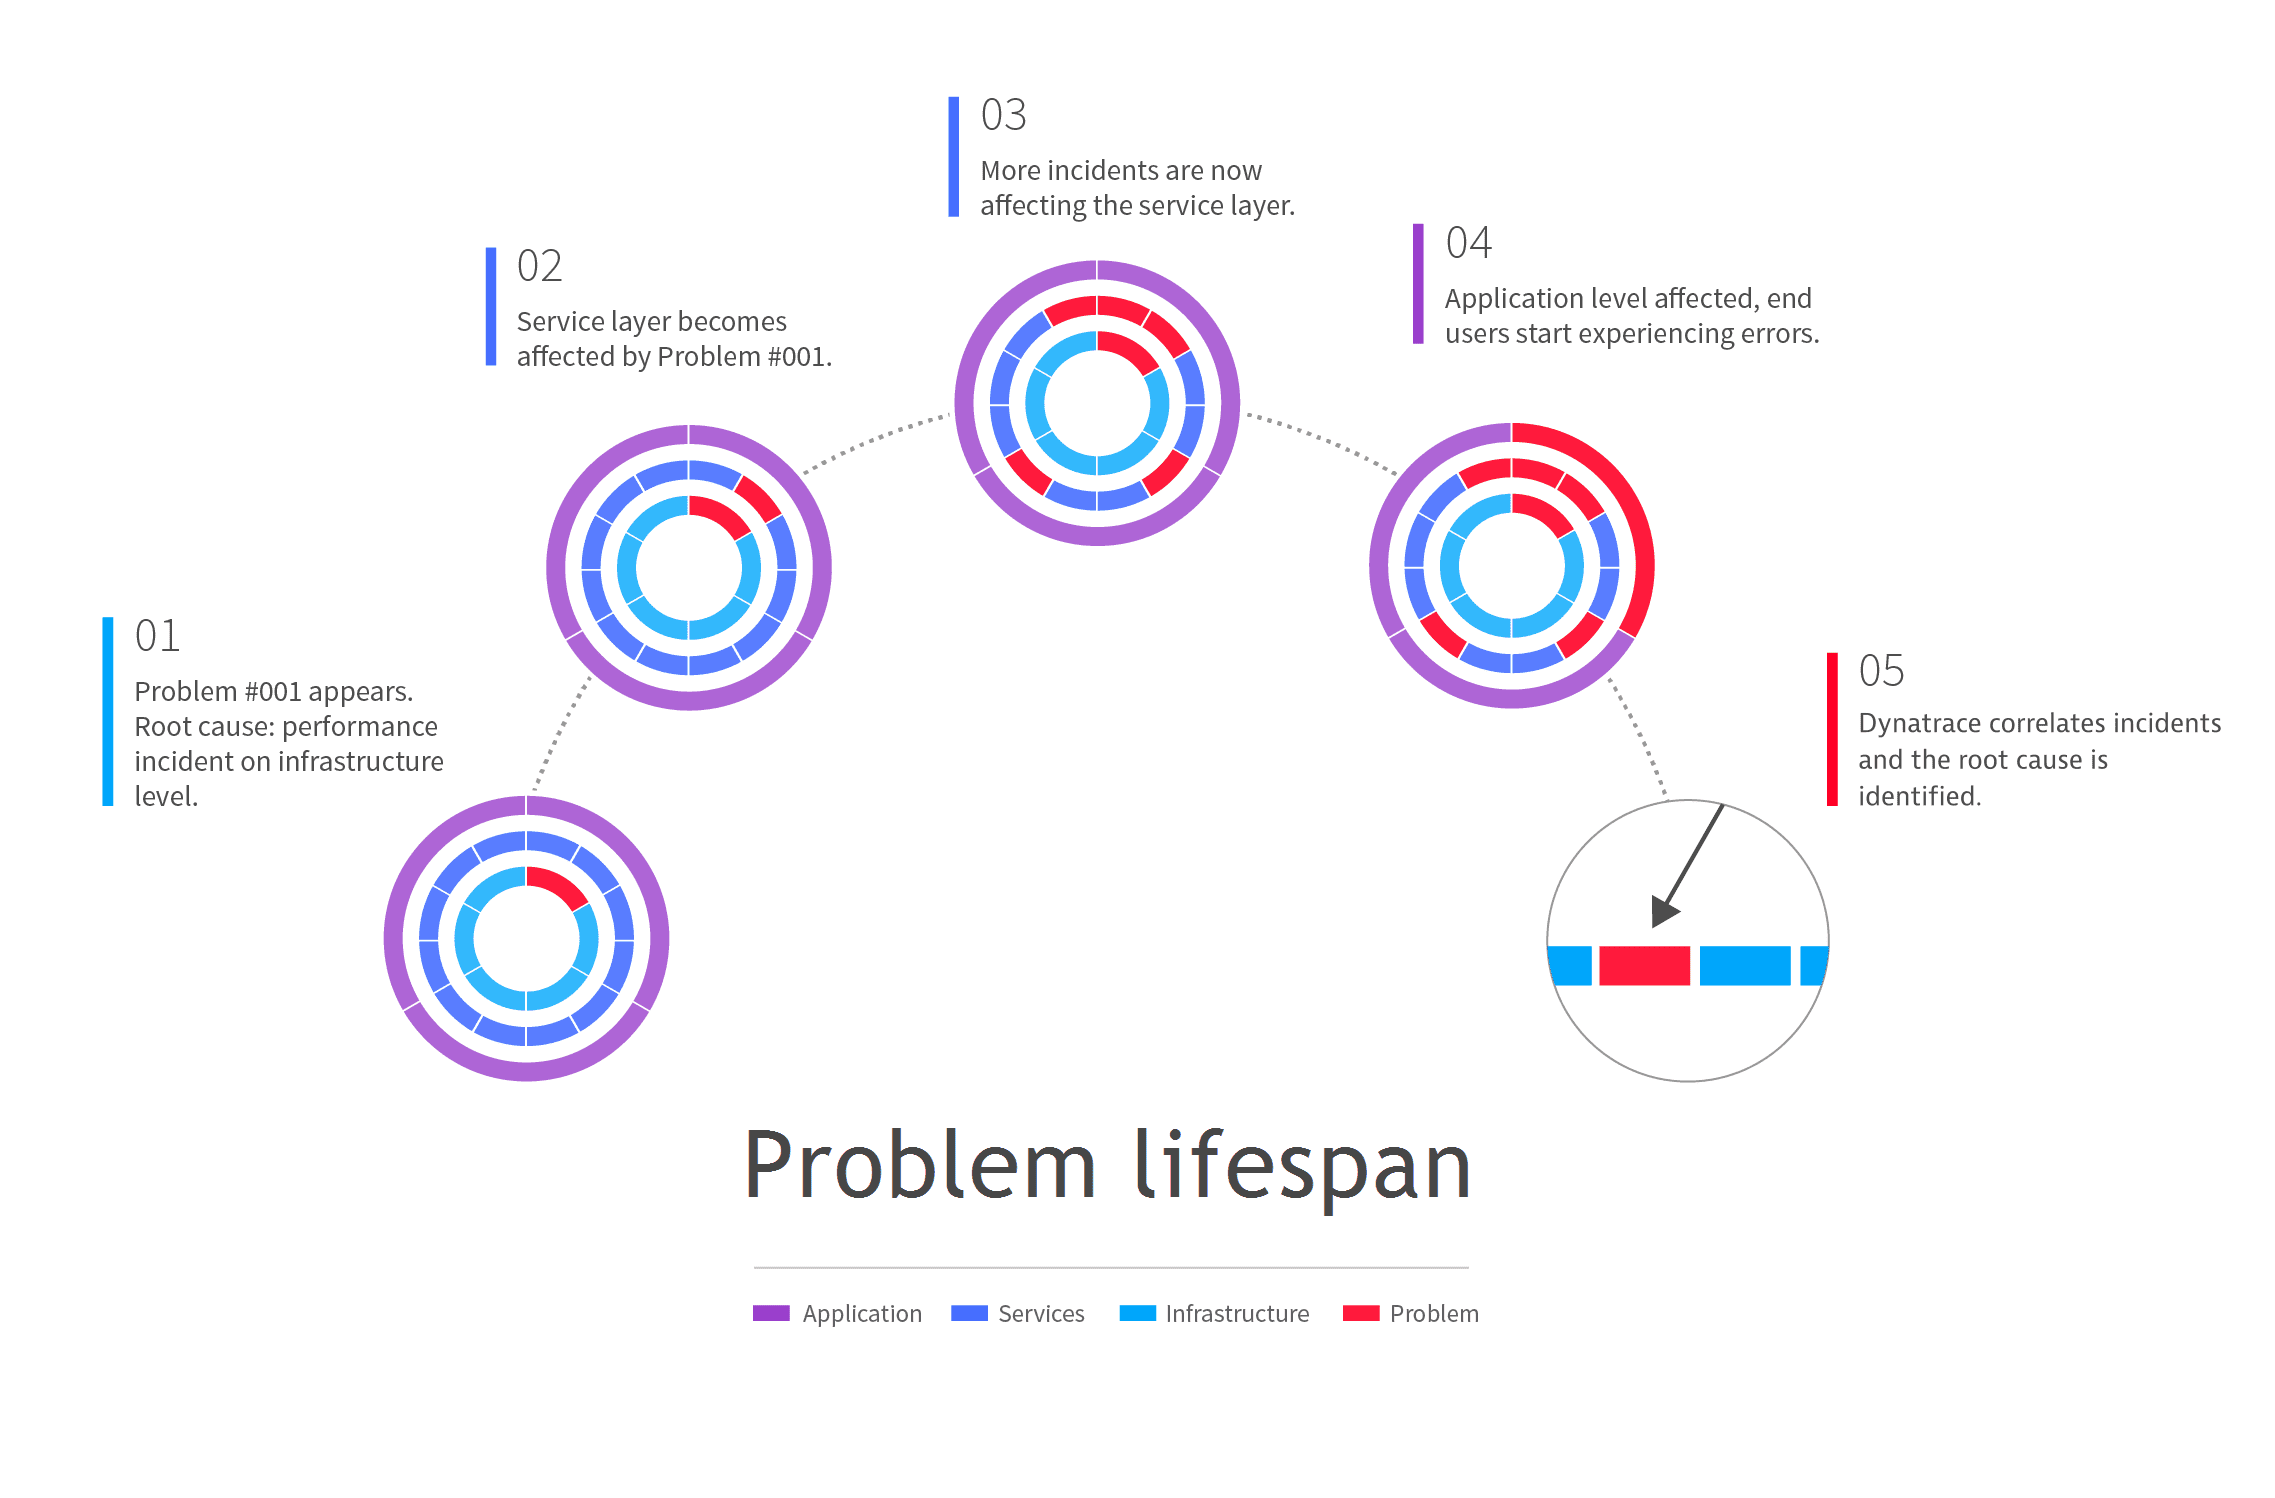
Problem detection
Understanding thresholds: Dynatrace utilizes two types of thresholds
- Automated baselines: Multidimensional baseline automatically detects individual reference values that adapt over time. Automated baseline reference values are used to cope with dynamic changes within your application or service response times, error rates, and load. Baseline calculated once per day, using 7days of historic data.
- Application & services has to run at least 20% of the time for Slowdown and error rate alerts.
- Application & services has to run full week for traffic drop/traffic spike alerts.
- Static thresholds (Built-in/User-defined)
- Anomaly detection: Dynatrace automatically detects infrastructure-related performance anomalies such as high CPU saturation and memory outages.
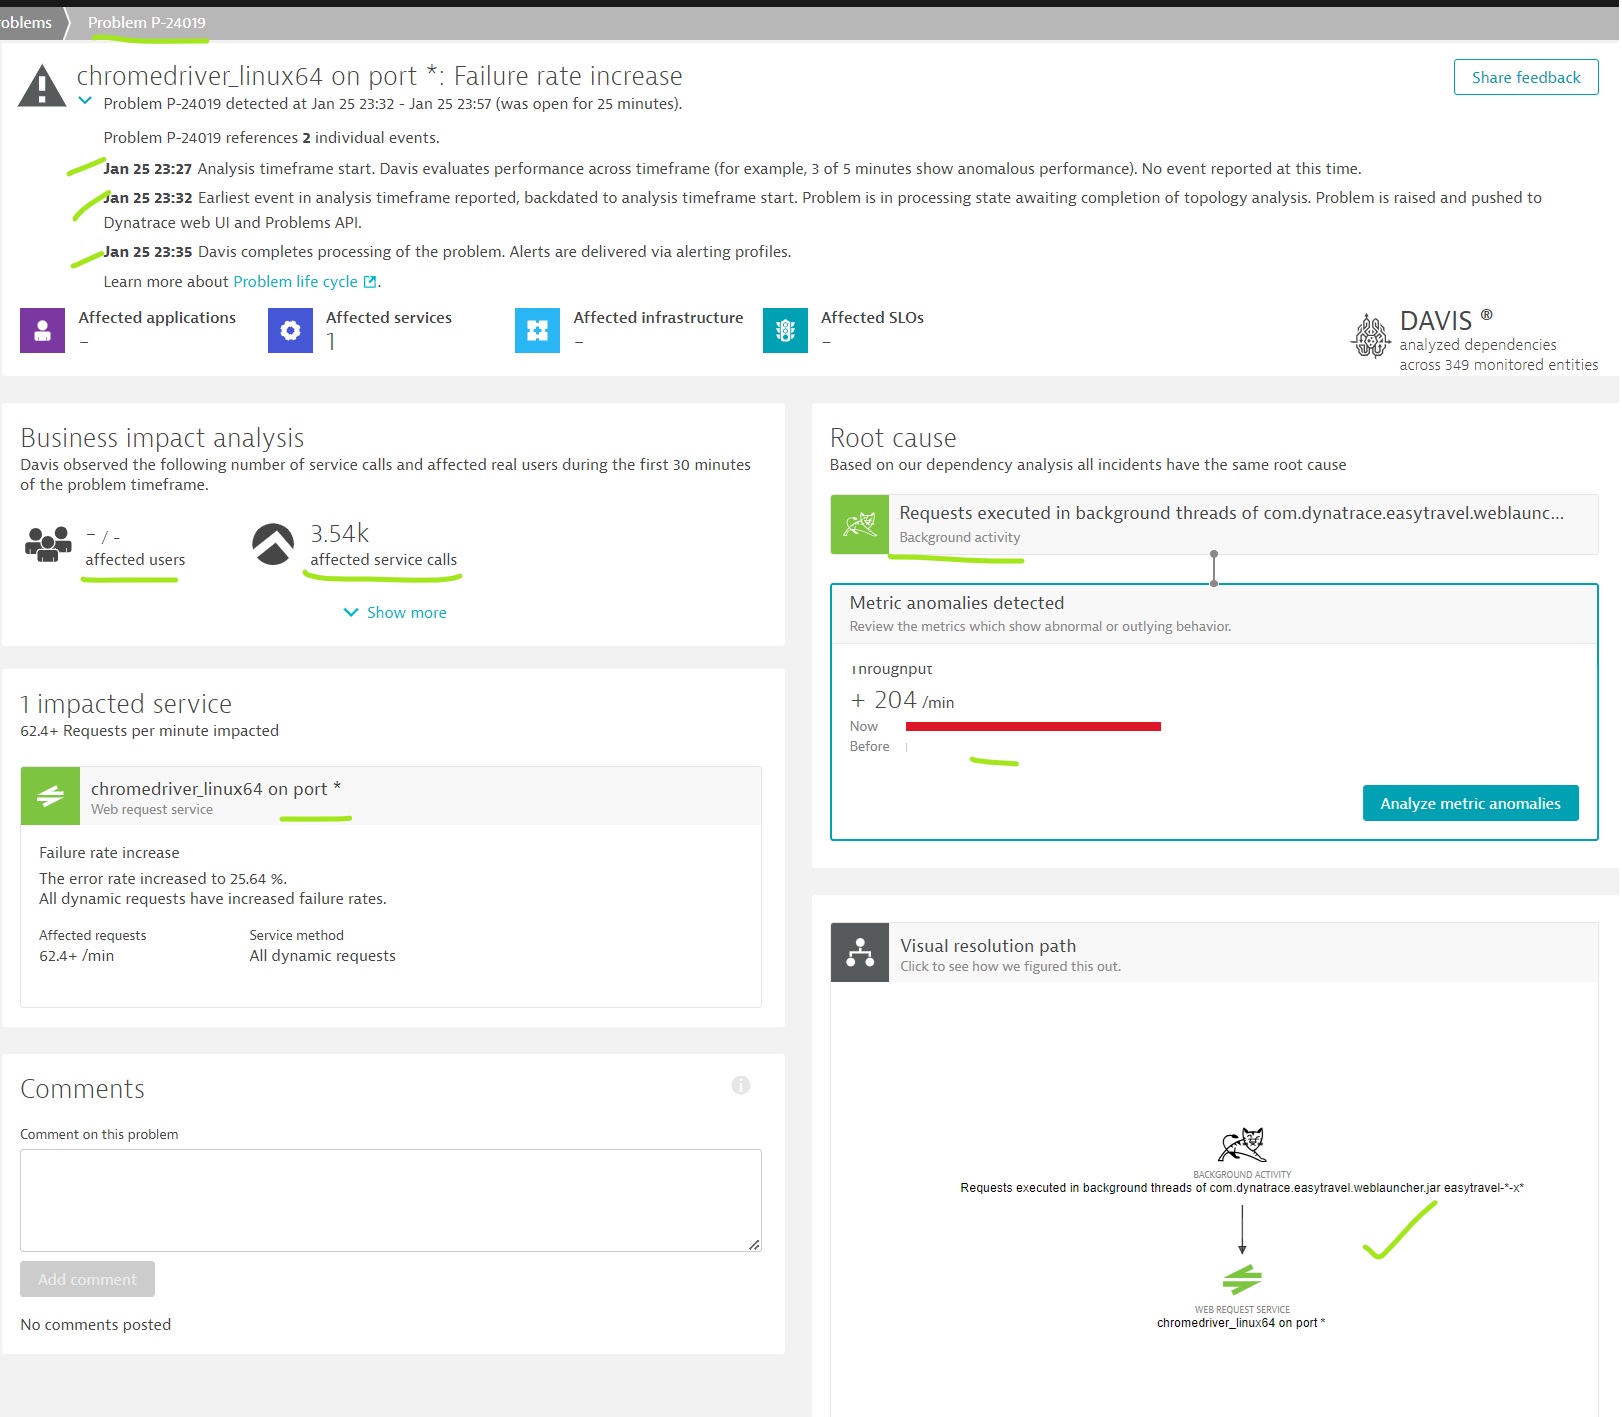
Problem analysis
Root-cause analysis: To identify the root cause of a problem, Dynatrace follows a context-aware approach to detect interdependent events across time, processes, hosts, services, applications, and both vertical and horizontal topological monitoring perspectives.
Problem alerting/notifications
Upon the detection of an anomaly, Dynatrace can generate an alert to notify the responsible team members that a problem exists.
Problem notifications:
- Incident management (Like JIRA, VictorOps)
- ChatOps (like MS Teams, Slack)
- Enterprise Service management (like ServiceNow)
- Custom integrations (like Email, webhook)
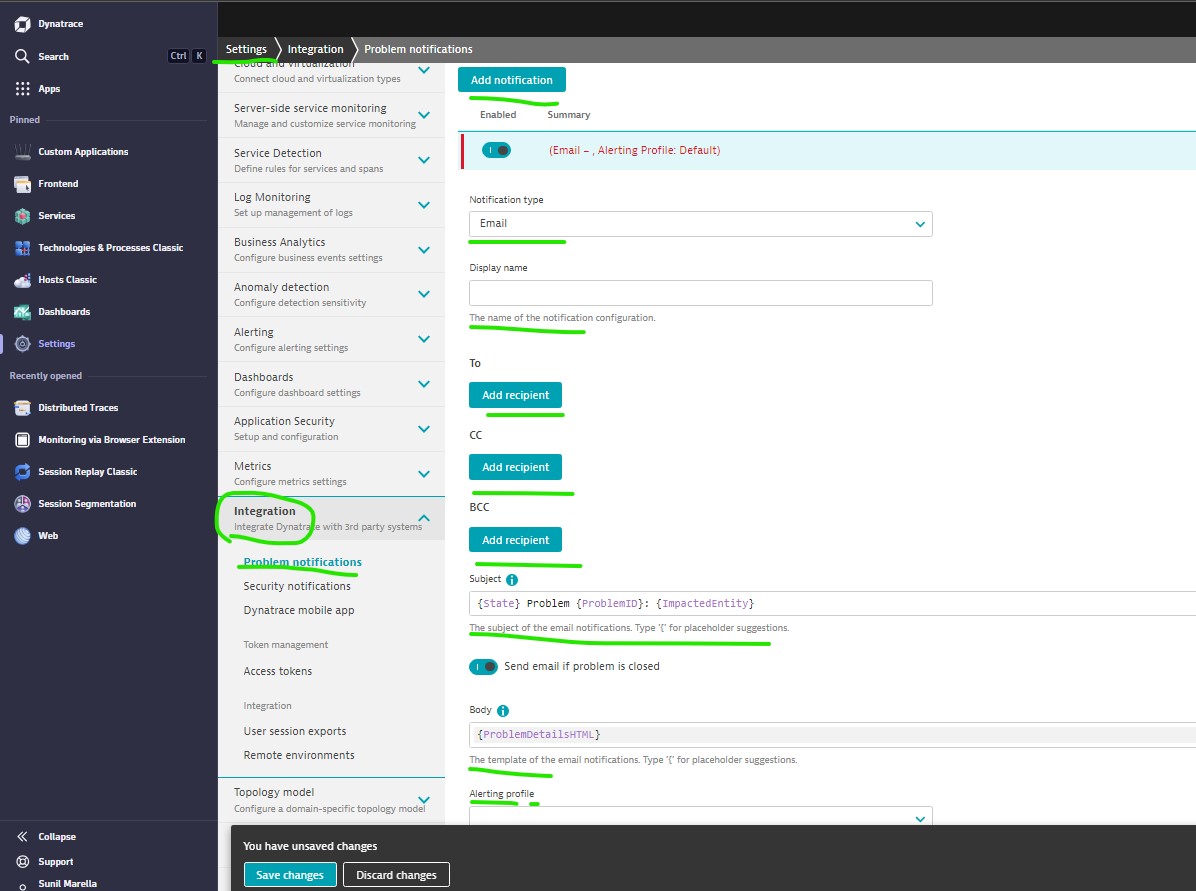
Send Dynatrace notifications via email</b>
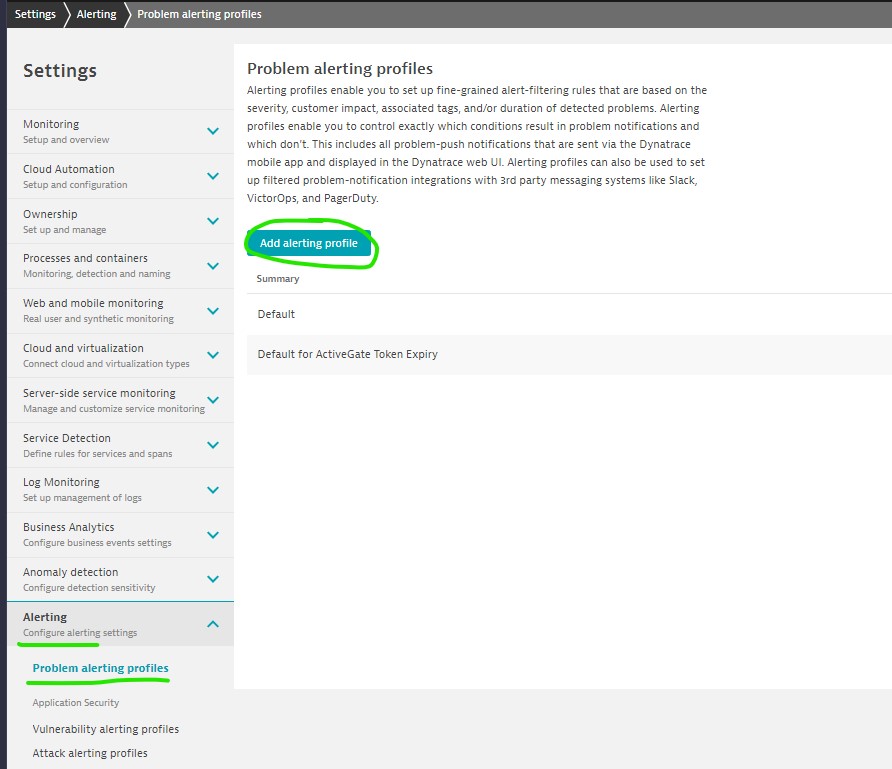
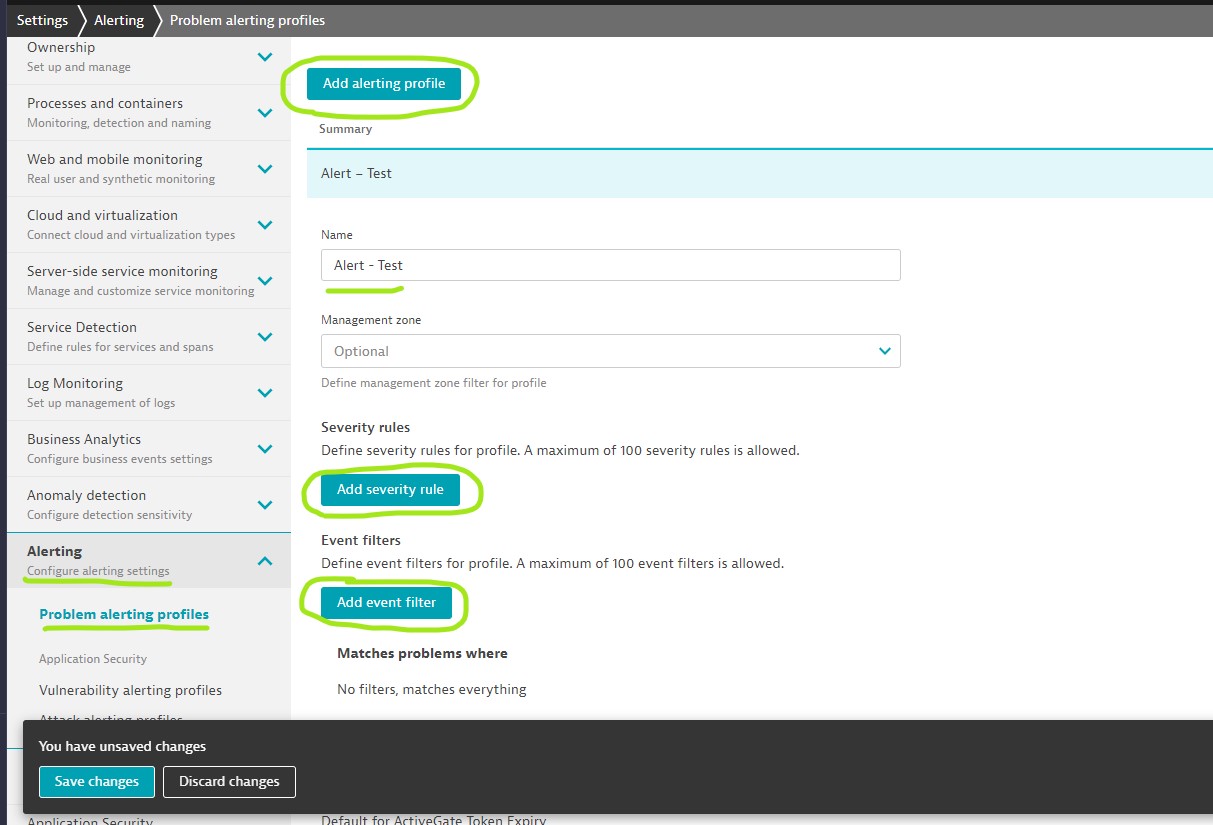
Step-1: 1. Create Alerting Profile
-
- Add alerting Profile
-
- Add severity rule
-
- Add event filter
Add alerting Profile
Add severity rule
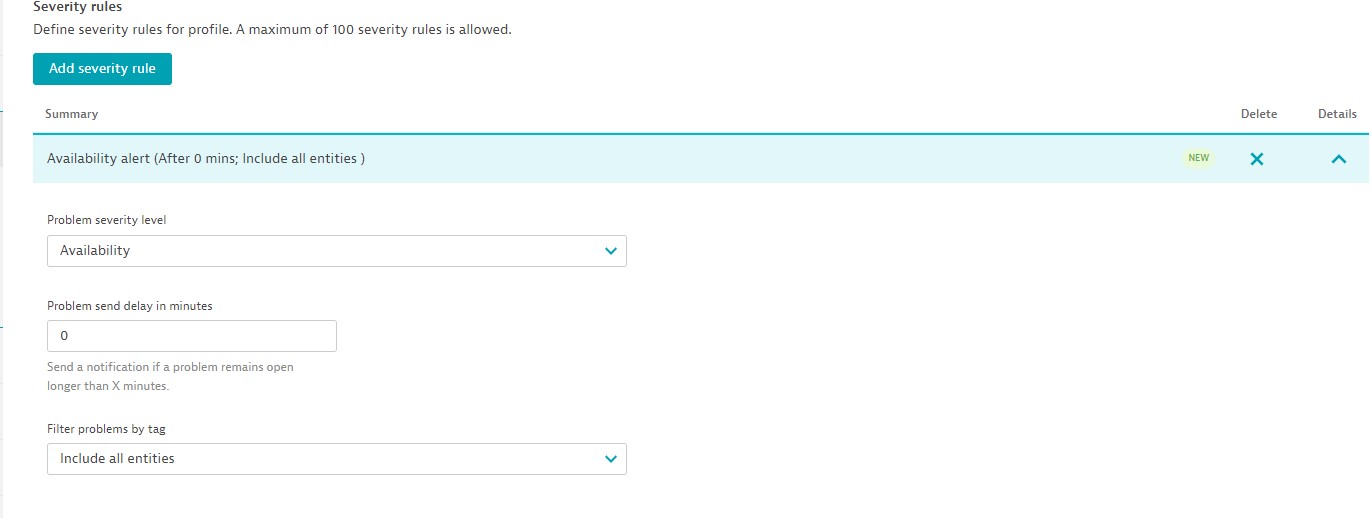
- Problem severity level:
- Availability: Complete outage or unavailability of servers or processes.
- Custom: Enable alerting on any user-defined thresholds.
- Error: Increased error rates or other error-related incidents that interfere with the regular operation of your environment.
- Monitoring unavailable: Widespread monitoring interruption, where the majority of your installed OneAgents lose their connection with the Dynatrace server.
- Resource: Resource contention like CPU, memory.
- Slowdown: Decrease of performance in one of your operational services or applications.
- info: Manually triggered events that don’t result in the creation of a new problem.
-
Problem send delay in minutes (send if problem wait for x time)
- Filter problems by tag
- Include all entities
- Only include entities that have all tags
- Only include entities that have any tags
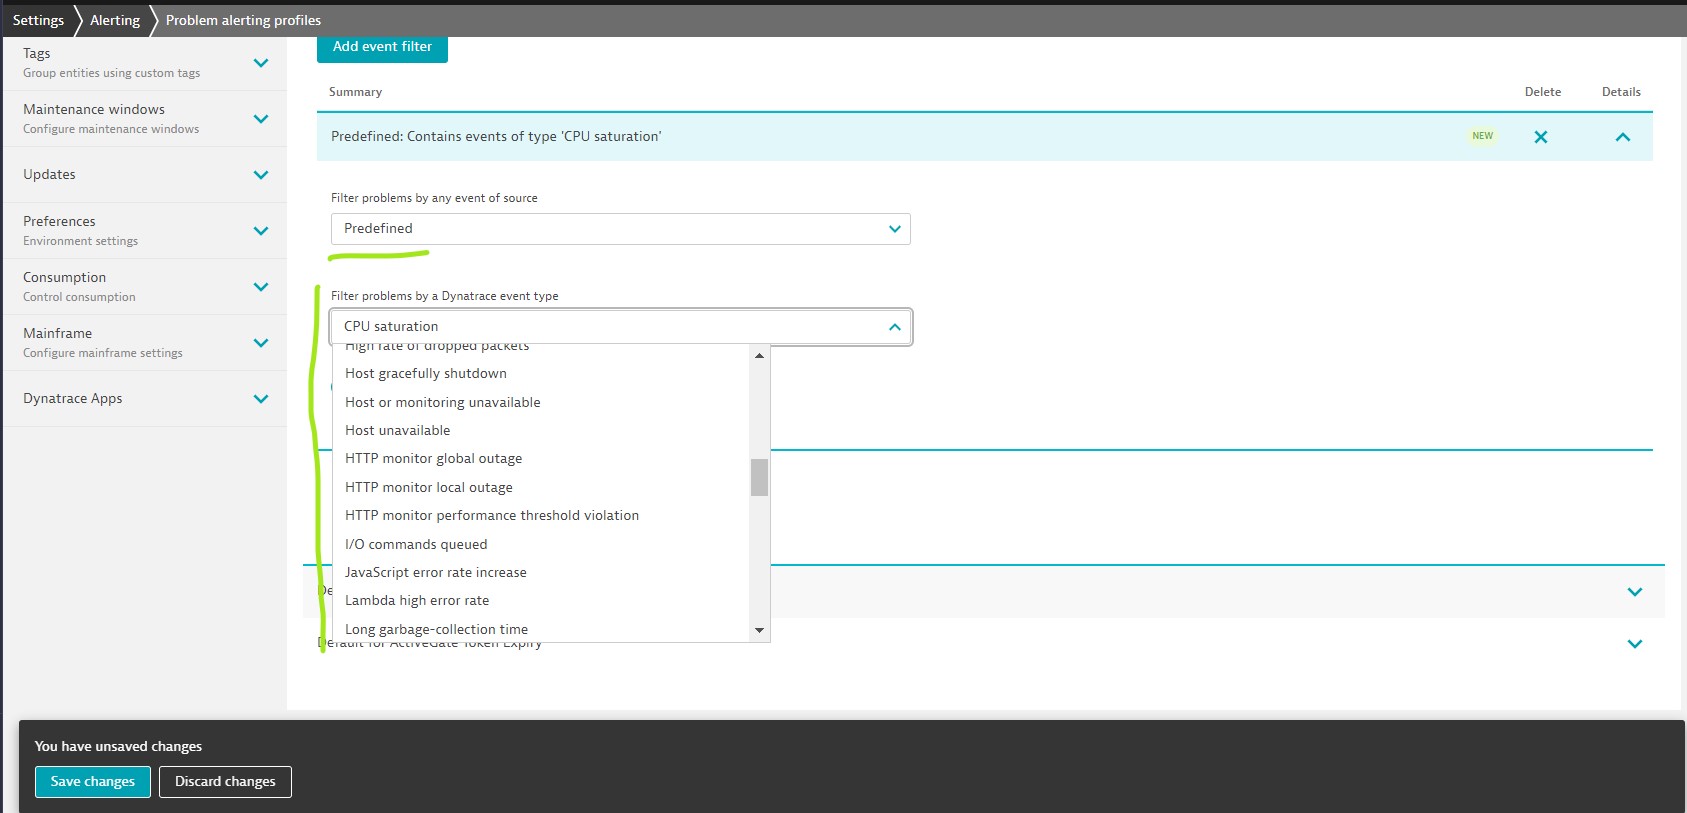
Step-2: Add event filter
Step-3: Create email alert
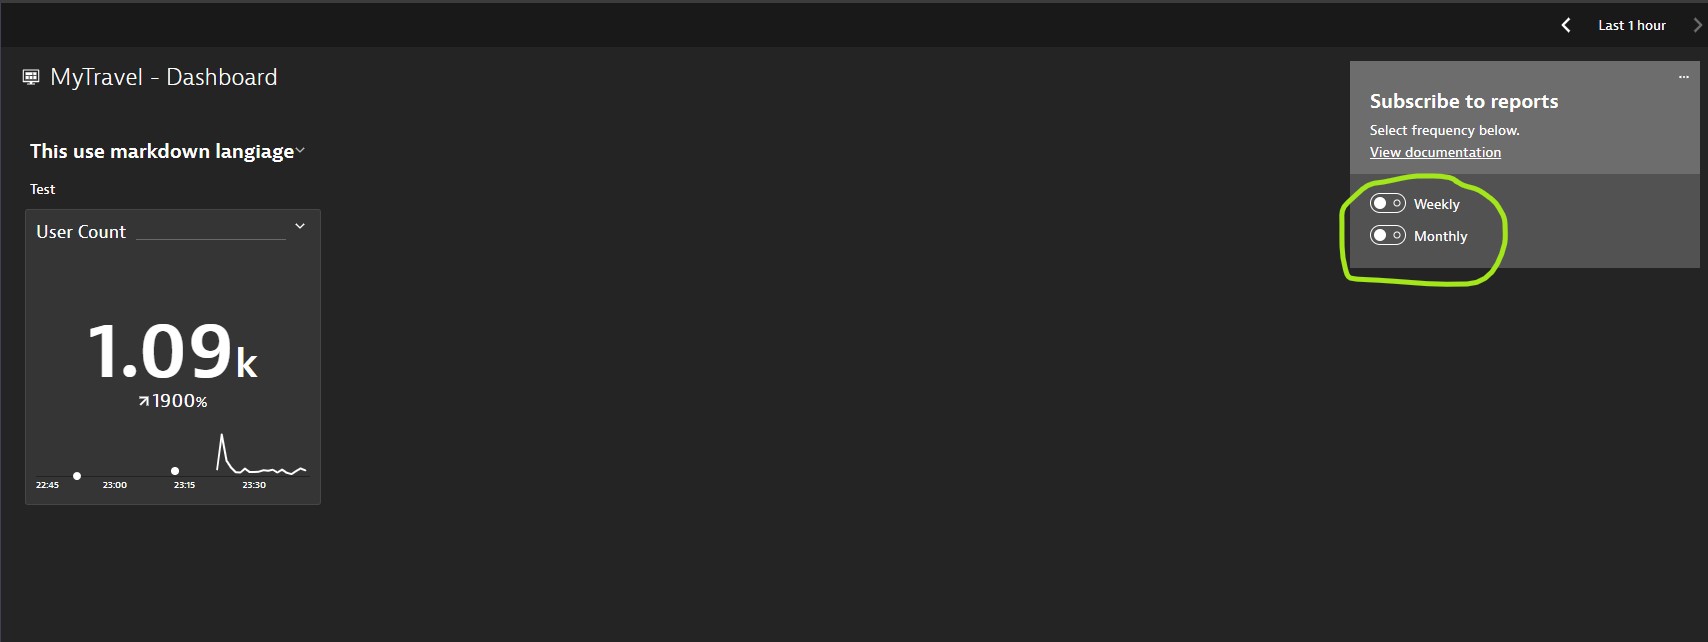
Reporting
Users with access to a dashboard can subscribe to email reports (weekly, monthly, or both) that are specific to that dashboard.
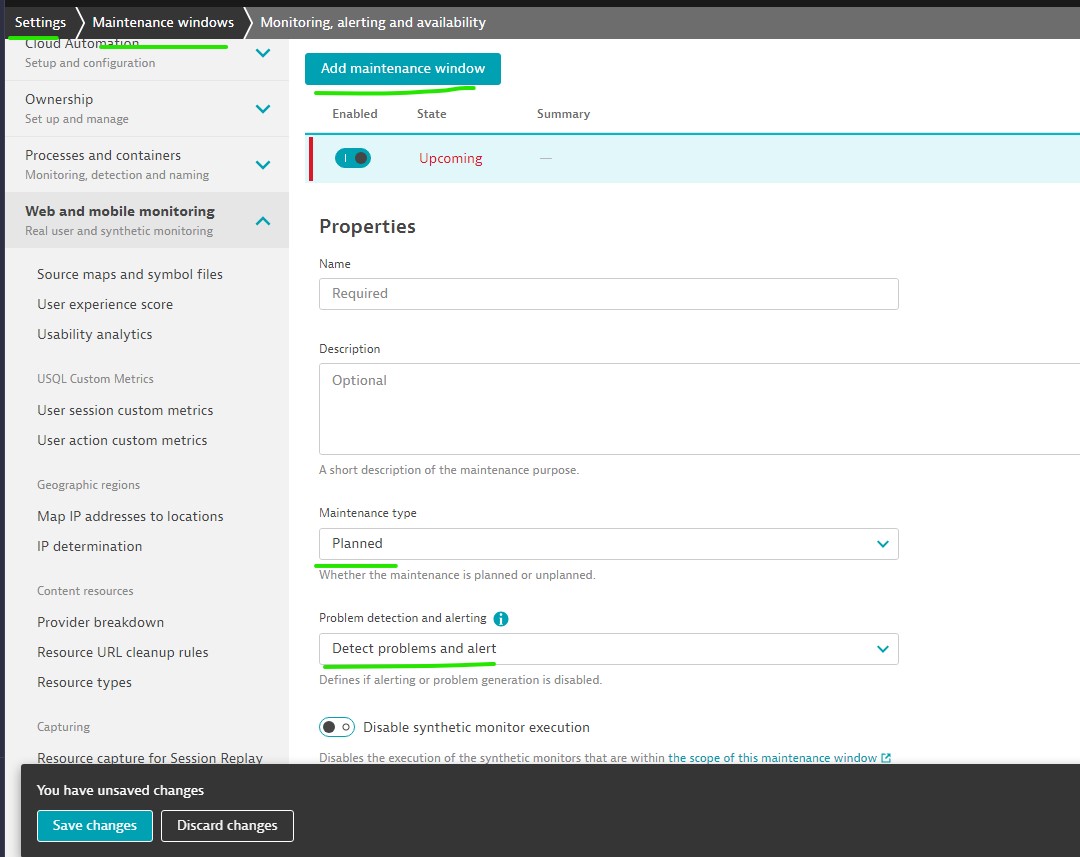
Maintenance window
Maintenance types
- Planned: Regular maintenance
- Unplanned: Add retroactively to not considering for overall performance and availability metrics
Dynatrace : Main Page