MyObservability
AIOps
Root cause analysis
To identify the root cause of problems, Dynatrace doesn’t depend solely on time correlation. It uses all the OneAgent-delivered context information—such as topology, transaction, and code-level information—to identify events that share the root cause.
Using all available context information, Dynatrace can pinpoint the root cause of problems in your application delivery chain and dramatically reduce the alert spam for single incidences that originate from the same root cause.
- All vertical topological (Application -> service -> host) dependencies are automatically analyzed as well as the complete horizontal dependency (Service1 -> Service2 -> Service3) tree.
- After Davis (the Dynatrace AI causation engine) identifies a problem, it uses all monitored transactions (distributed traces) to identify interdependencies between the problem and other components that took place around the same time and within a dependent topology.
- Drill down to code-level details of a detected root-cause component
Visual resolution path
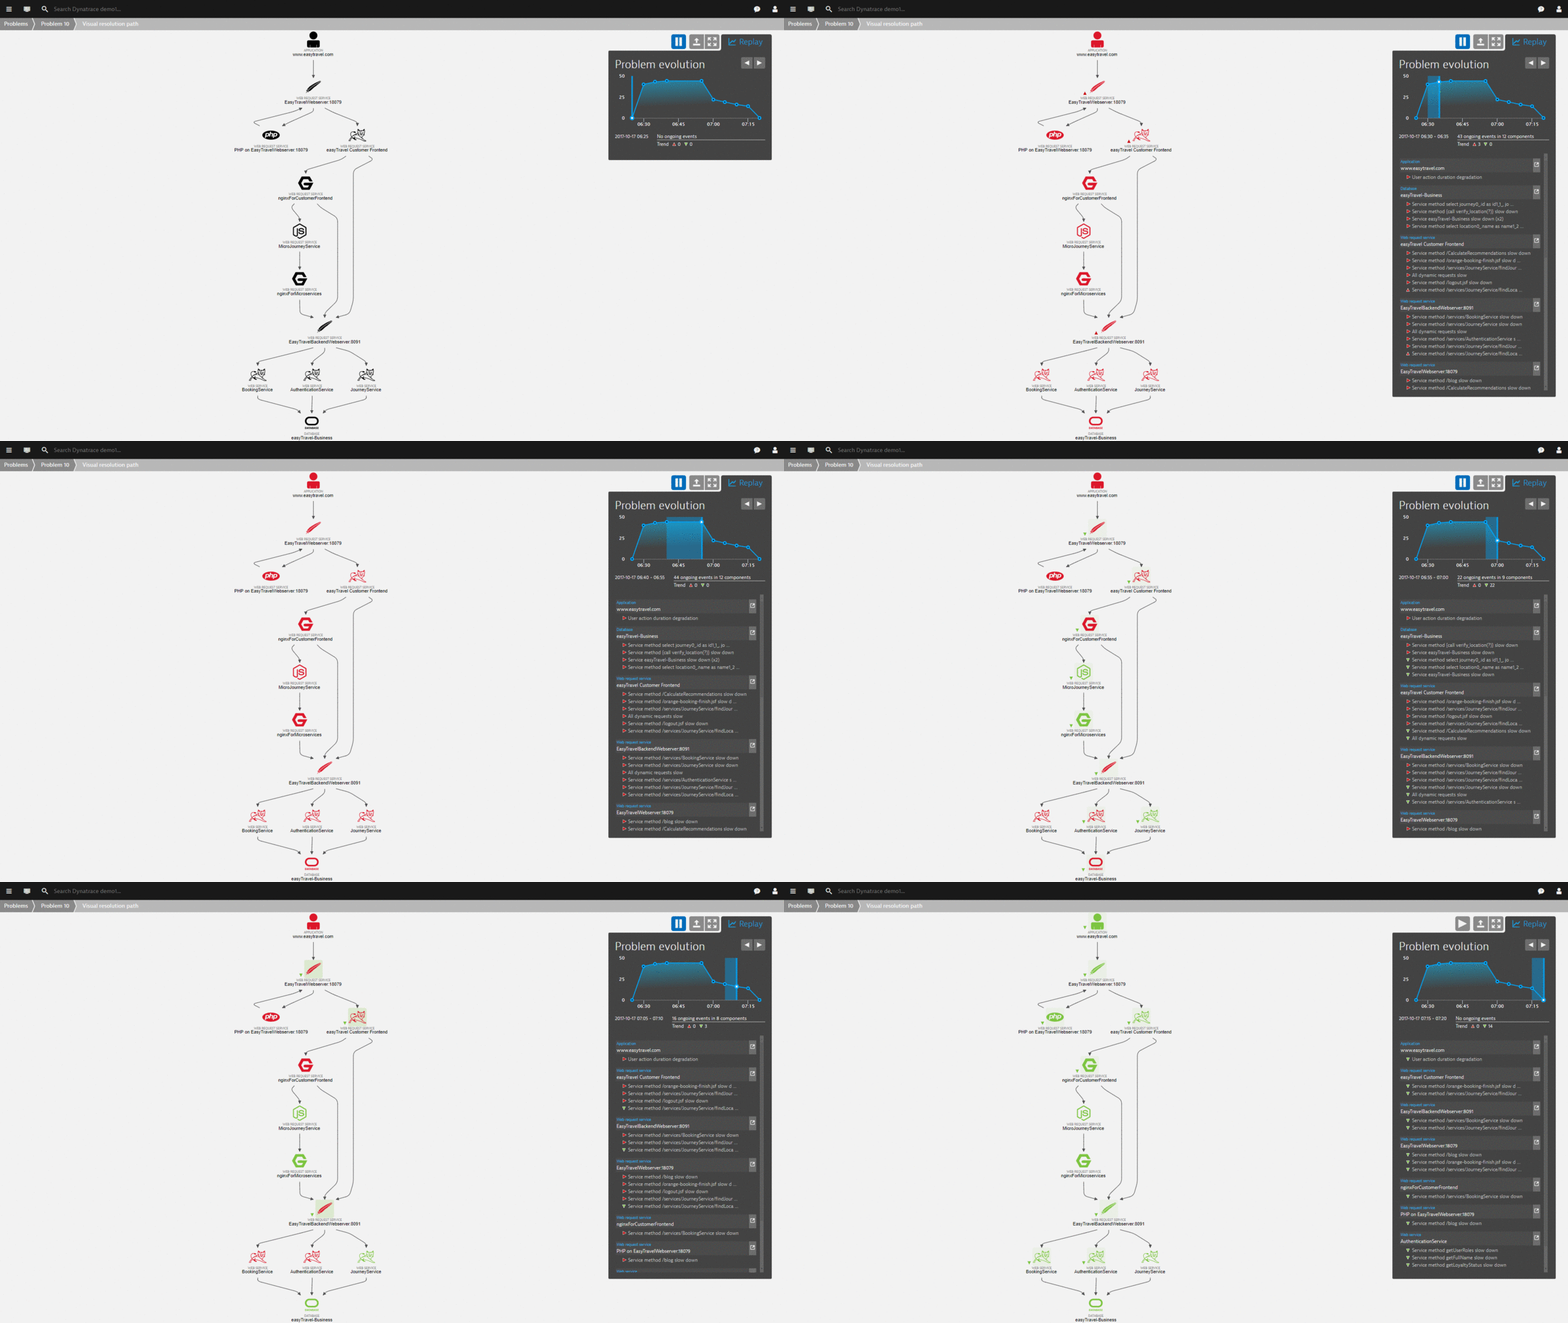
If several components of your infrastructure are affected, a Visual resolution path is included in the Root cause.
You can use Visual resolution path to replay the problem to see how it evolved over time, how application dependencies interacted and performed during the time leading up to and during the problem.
You can see which failed services calls or infrastructure health issues led to the failure of other service calls which led to the performance problem that effected user experience.

Highlights of Davis root-cause detection
- Fault-tree analysis
- Metric- and event-based detection of abnormal component state
- Seamless integration of custom metrics within the Dynatrace AI process
- Third-party event ingests
- Availability root cause
- Grouped root cause
Root cause analysis - Use case
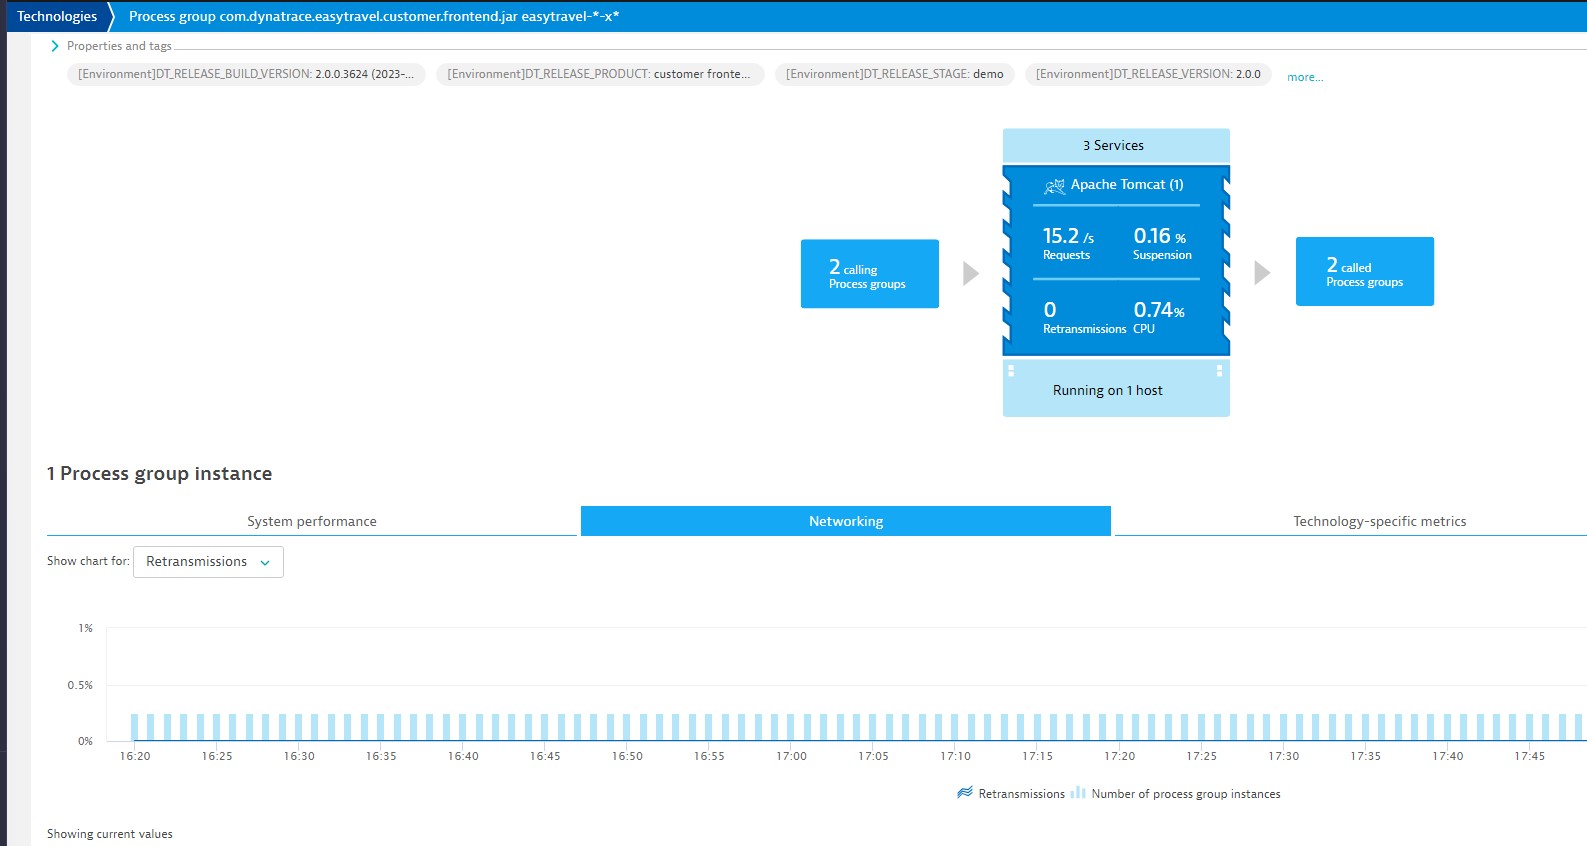
Use case: High network retransmission rate as a root cause
When a network link or segment is overloaded or underperforming, it drops data packets. This is because overloaded network equipment queues are purged during periods of excessive traffic or limited hardware resources. In response, TCP protocol mechanisms attempt to fix the situation by re-transmitting the dropped packets.
Ideally, retransmission rates should not exceed 0.5% on local area networks and 2% in Internet- or cloud-based networks. Retransmission rates above 3% will negatively affect user experience in most modern applications. Retransmission issues are especially noticeable by customers using mobile devices in poor network coverage areas.
You can detect retransmission in Dynatrace

Davis detects this problem and monitors its severity across the infrastructure, service, and Real User Monitoring layers, showing you how this infrastructure issue translates into user experience problems for your customers.
More information Dynatrace Docs
Next Page: Dynatrace APIs
Dynatrace : Main Page