MyObservability
Trail Setup - Web Applications
Setup (Astronomy shop) (OpenTelemetry)
git clone https://github.com/open-telemetry/opentelemetry-demo.git
cd opentelemetry-demo
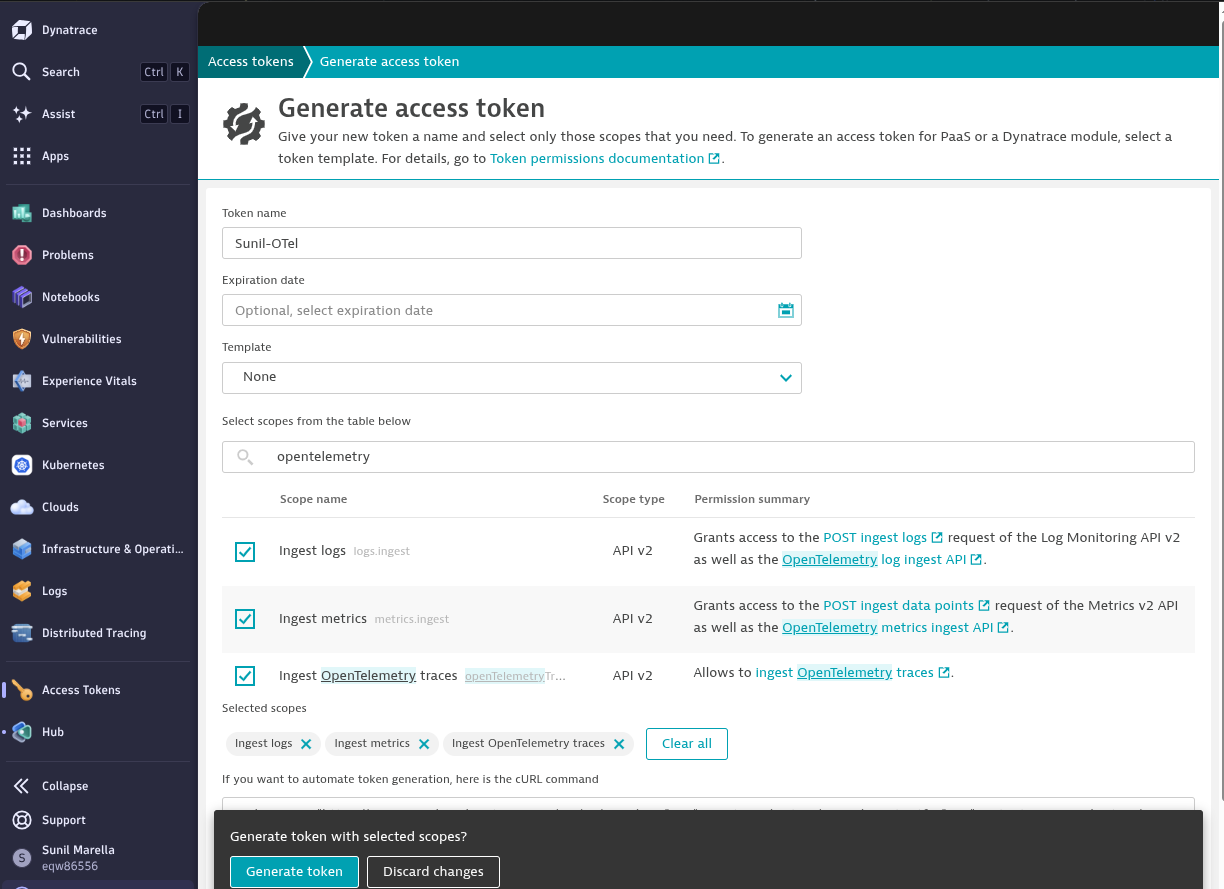
Dynatrace Access token
Create access token in Dynatrace and select Ingest logs, Ingest metrics, Ingest OpenTelemetry traces options (As per your requirement)
Setup
Edit .env folder in opentelemetry-demo and below information
DT_ENDPOINT=https://xxxx.live.dynatrace.com/api/v2/otlp
DT_API_TOKEN=dt0c01.xxxxx
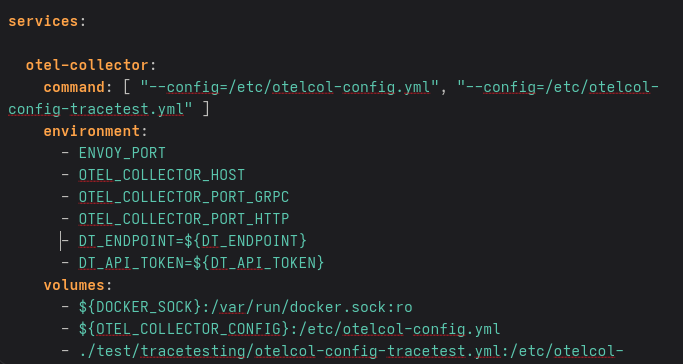
Update docker-compose.override.yml file with the below information. If file not present, use docker-compose-tests_include-override.yml and rename to docker-compose.override.yml. Full file as below
services:
  otel-collector:
    command:
      - "--config=/etc/otelcol-config.yml"
      - "--config=/etc/otelcol-config-extras.yml"
    environment:
      - DT_ENDPOINT=${DT_ENDPOINT}
      - DT_API_TOKEN=${DT_API_TOKEN}
      - ENVOY_PORT
      - OTEL_COLLECTOR_HOST
      - OTEL_COLLECTOR_PORT_GRPC
      - OTEL_COLLECTOR_PORT_HTTP
    volumes:
      - ${DOCKER_SOCK}:/var/run/docker.sock:ro
      - ${OTEL_COLLECTOR_CONFIG}:/etc/otelcol-config.yml
      - ./src/otel-collector/otelcol-config-extras.yml:/etc/otelcol-config-extras.yml
    depends_on: []
Edit src/otel-collector/otelcol-config-extras.yml file with below information.
exporters:
  otlphttp/dynatrace:
    endpoint: "${DT_ENDPOINT}"
    headers:
      Authorization: "Api-Token ${DT_API_TOKEN}"

processors:
  batch:

service:
  pipelines:
    traces:
      exporters: [spanmetrics, otlphttp/dynatrace]

    metrics:
      processors: [cumulativetodelta, batch]
      exporters: [otlphttp/dynatrace]

    logs:
      exporters: [otlphttp/dynatrace]
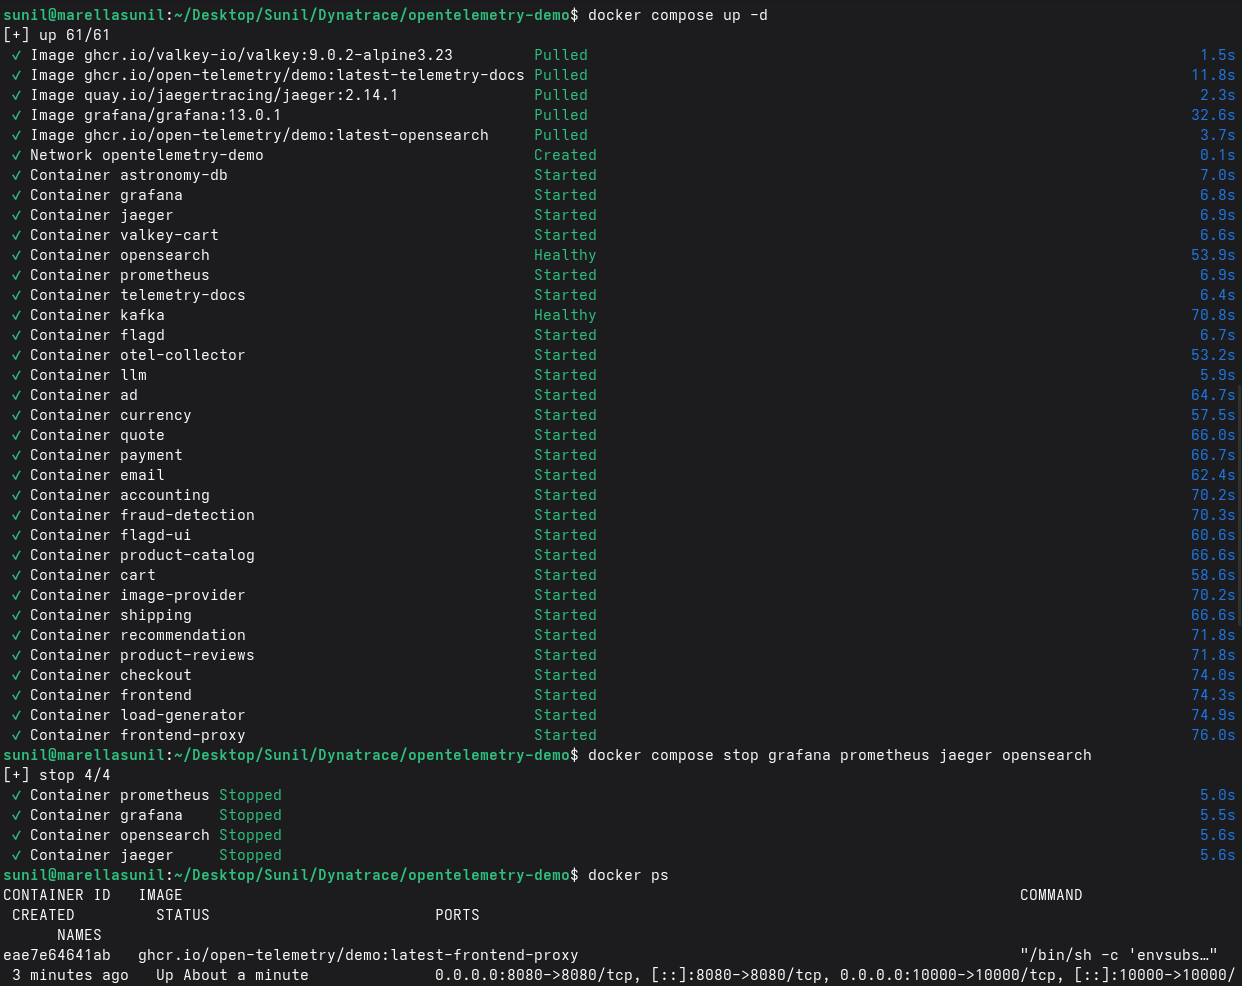
Run docker
- Run docker compose & check docker container.
- Stop other tools in the demo app using
docker compose stop grafana prometheus jaeger opensearch
Validate
- Open URL: http://localhost:8080
- Load generator:
docker compose logs load-generator --tail=50 - Verify logs:
docker compose logs otel-collector --tail=100
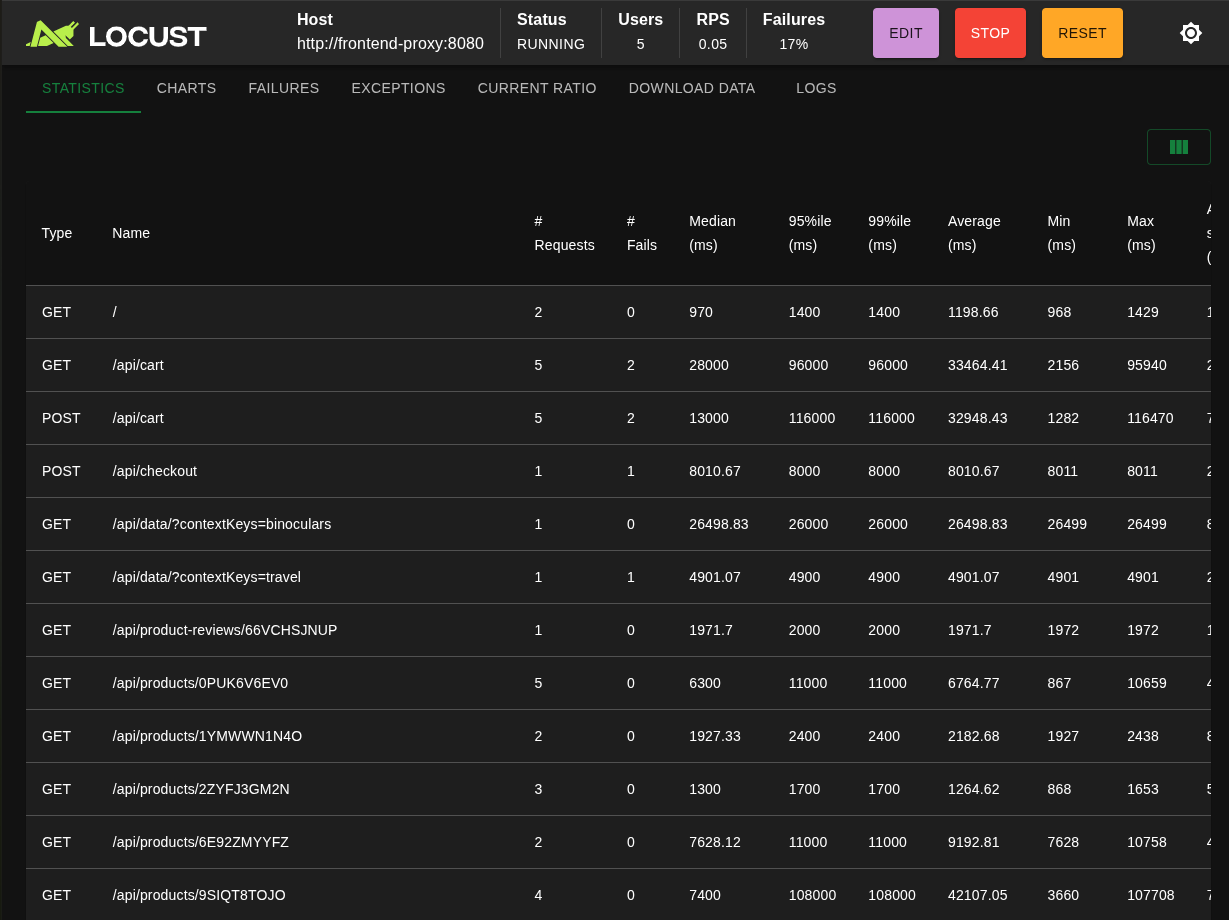
Test failure scenario
Generate load using below command.
for i in {1..200}; do
  curl -s http://localhost:8080 > /dev/null
  sleep 0.2
done
Or use http://localhost:xxxxx (Find port using docker compose ps load-generator)
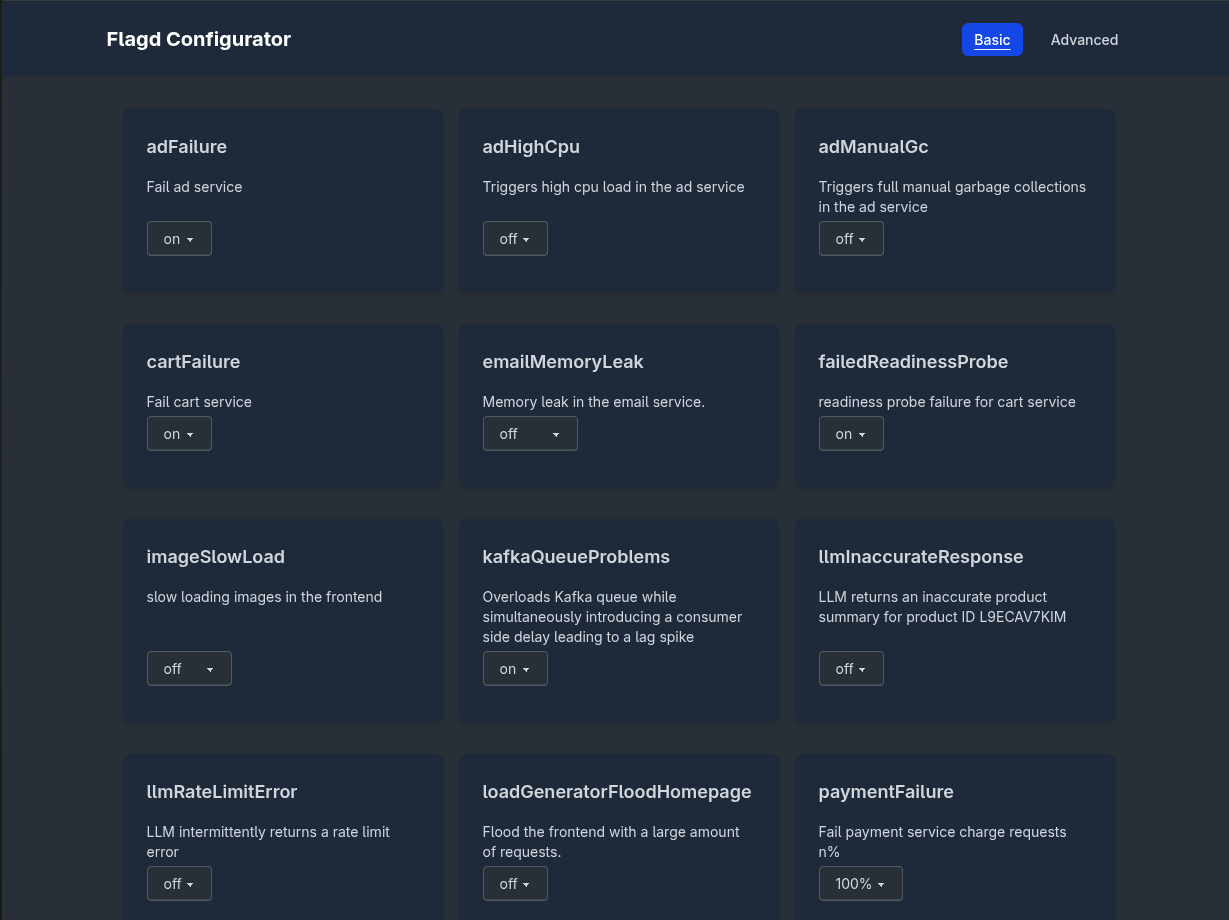
Enable failure flags using http://localhost:8080/feature
Verify Dynatrace
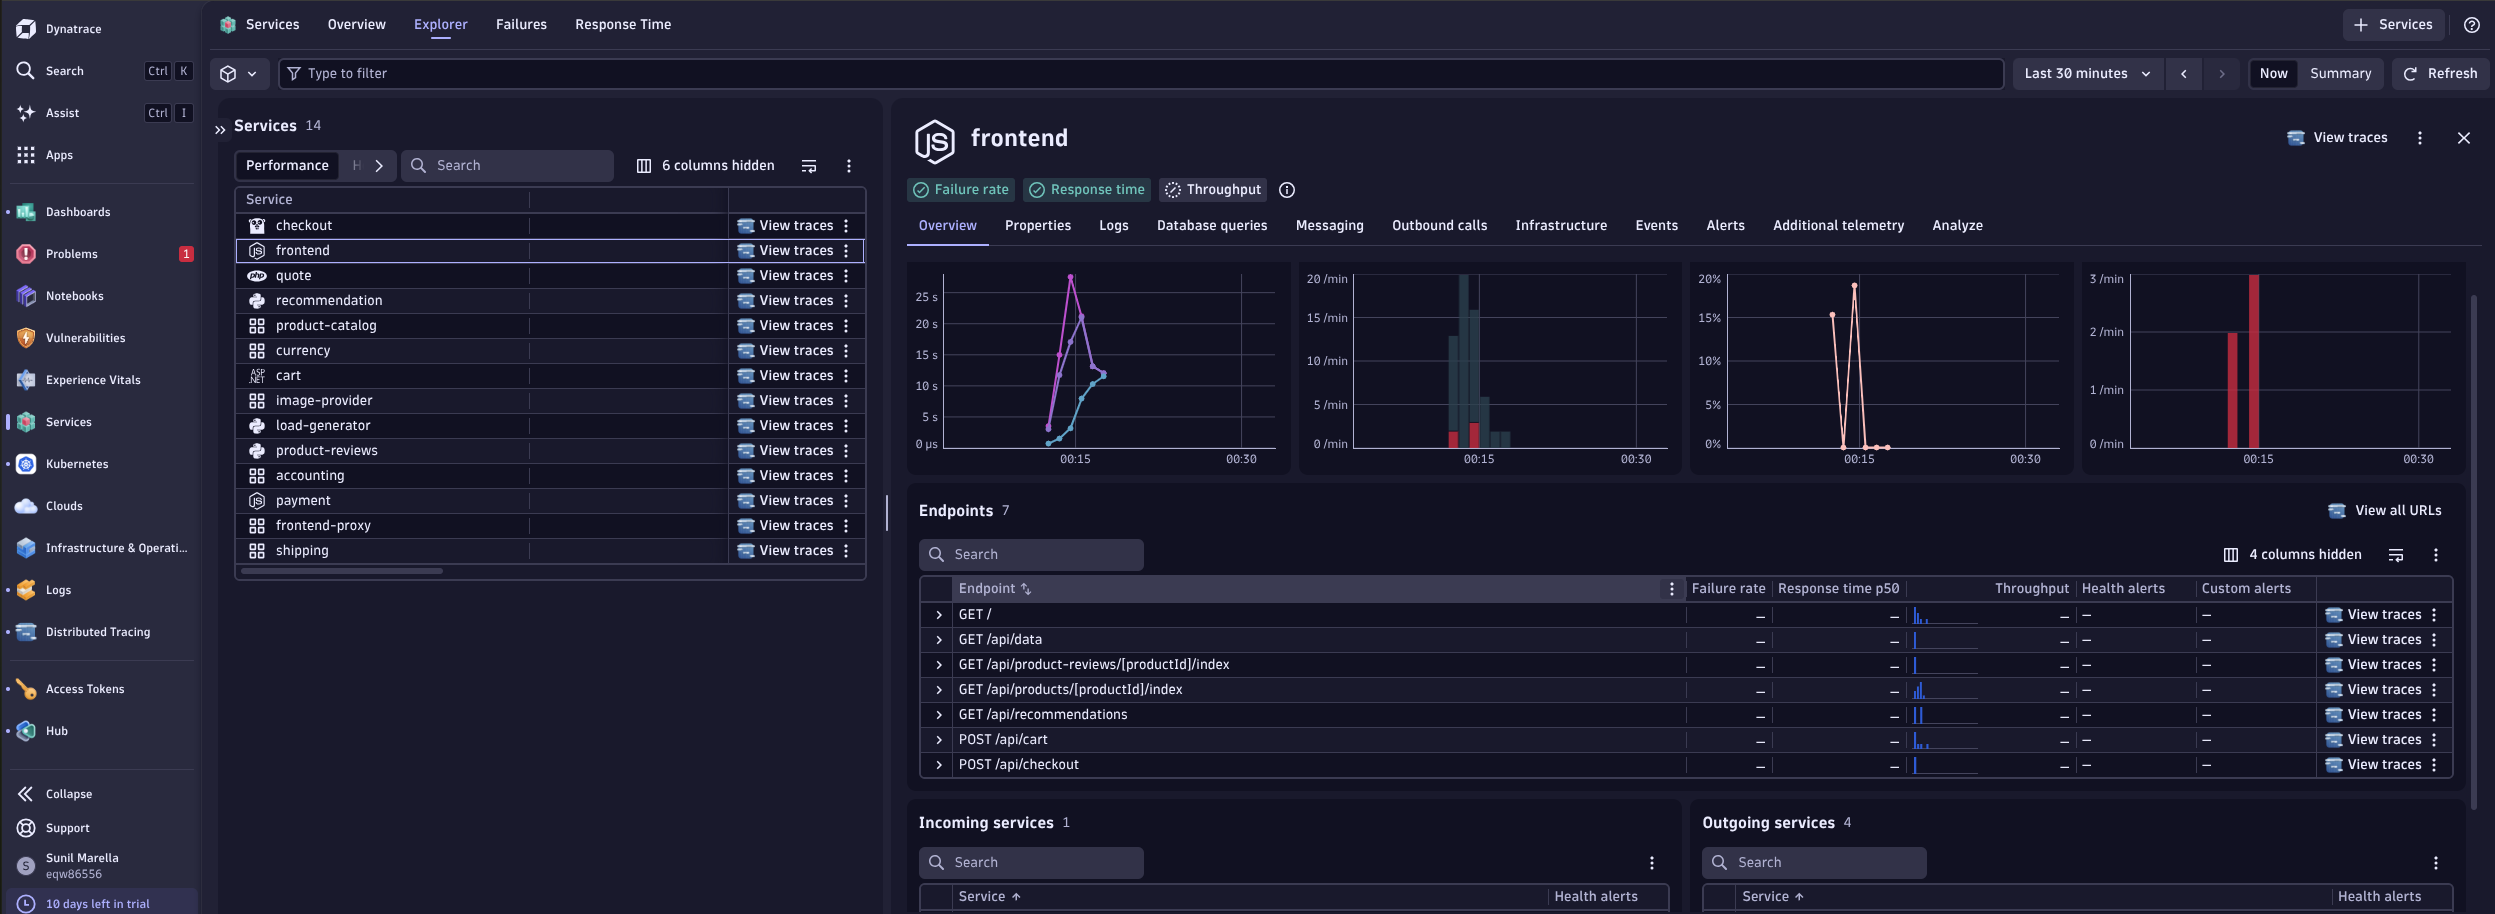
Dynatrace : Main Page