MyObservability
Collectors
Collectors are used to collect telemetric data and send to Grafana
- Grafana Alloy: Grafana Labs distribution of the OpenTelemetry Collector
- Grafana Loki: Log aggregation system inspired by Prometheus.
Grafana Alloy
Grafana Alloy collects observability data and sends it to Grafana Cloud. Alloy is flexible, and you can easily configure it to fit your needs in on-prem, cloud-only, or a mix of both.
How Grafana Alloy Works

- Grafana Alloy collect telemetry data from applications, database and OpenTelemetry Collectors. Telemetry data can be pushed to Grafana or Grafana Alloy can pull from data sources.
- Grafana Alloy process data and transform it for sending. Transformations can be used to inject extra metadata into telemetry or filter out unwanted data.
- Grafana Alloy sends data to OpenTelemetry-compatible databases or collectors, the Grafana LGTM stack, or Grafana Cloud.
How Grafana Loki Works
Grafana Loki is a log aggregation system developed by Grafana Labs. It’s designed to collect, store, and query logs, similar to how Prometheus works for metrics.
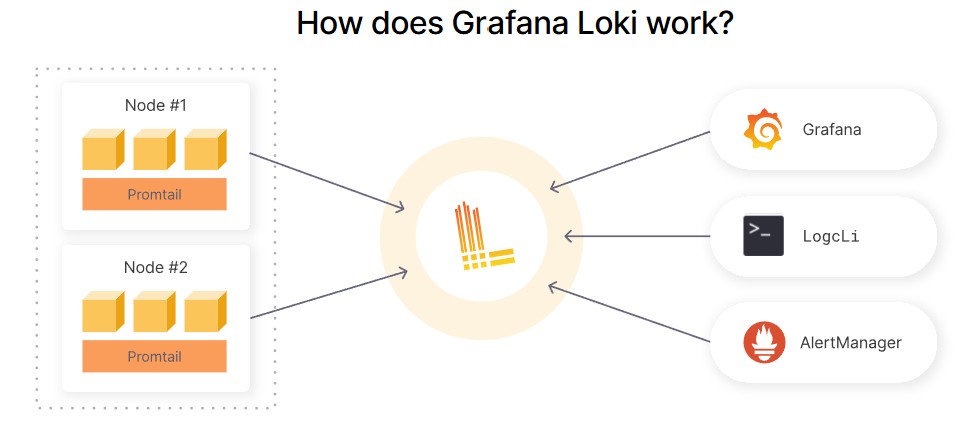
- Pull in any logs with Promtail: Promtail is a logs collector built specifically for Loki.
- Store the logs in Loki: Loki does not index the text of logs. Instead, entries are grouped into streams and indexed with labels.
- Use LogQL to explor: Use Loki’s powerful query language, LogQL, to explore your logs
- Alert on your logs: Set up alerting rules for Loki to evaluate on your incoming log data.
</hr>