MyObservability
Prometheus Architecture
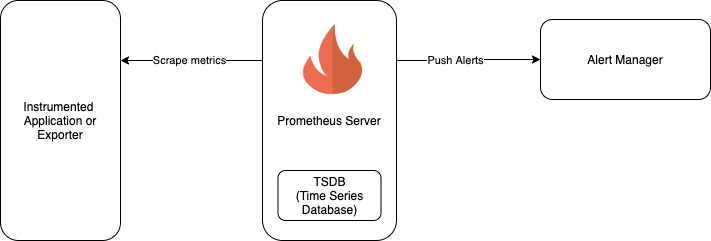
Basic Architecture
- Prometheus server: Prometheus server: the server which scrapes and stores the metrics data
- Instrumented Application or Exporter: instrumented application that exposes its metrics, or an exporter that exposes metrics of another application.
- Alert Manager: to raise alerts based on preset rules.
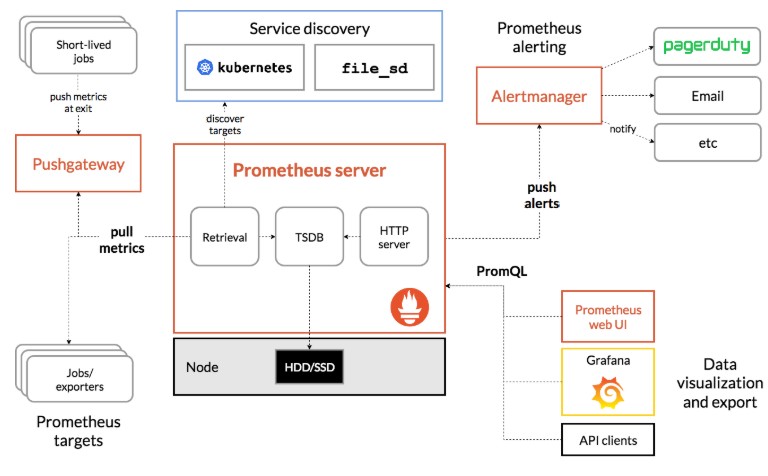
Prometheus Components
- The main Prometheus server which scrapes and stores time series data
- client libraries for instrumenting application code
- a push gateway for supporting short-lived jobs
- special-purpose exporters for services like HAProxy, StatsD, Graphite, etc.
- an alertmanager to handle alerts
- various support tools
Note: Grafana or other API consumers can be used to visualize the collected data.
Architecture
Next Page: Lab Setup
Main Page: Click Here