MyObservability
PromQL (Prometheus Query Language)
PromQL query follows three key steps
- Metric Selection: Choose a metric name to query.
- Label Filtering: Add label selectors to narrow your results.
- Time window selection: Use a time range to focus your query.
Example: http_requests_total {job=”web-server”} 5m
In Prometheus’s expression language, an expression or sub-expression can evaluate to one of four types:
- Instant vector: a set of time series containing a single sample for each time series, all sharing the same timestamp.
- Range vector: a set of time series containing a range of data points over time for each time series. Required for functions like rate() or increase() that need multiple samples.
- Scalar vector: a simple numeric floating point value
- String: a simple string value; currently unused/rarely used.
Prometheus metric types
-
Gauge: A gauge is a metric that represents a single numerical value that can arbitrarily go up and down. Ex: avg_over_time(cpu_usage_percent[5m])
- Counter: A counter is a cumulative metric that represents a single monotonically increasing counter whose value can only increase or be reset to zero on restart.
- Use rate() or increase().
- rate() and increase() are designed for counters, not gauges. Ex: rate(http_requests_total[5m])
-
Histogram: A histogram samples observations (usually things like request durations or response sizes) and counts them in configurable buckets. It also provides a sum of all observed values. Ex: http_request_duration_seconds_bucket
- Summary: summary samples observations (usually things like request durations and response sizes). While it also provides a total count of observations and a sum of all observed values, it calculates configurable quantiles over a sliding time window. Ex: response_time_seconds_99th_99thpercentile
Time based Functions
Functions like rate(), irate(), and increase() turn counter data into powerful indicators of system behavior. Use rate() for smooth trend visualization, irate() for real-time alerting, and increase() for measuring absolute change.
Counters tell you the gradual increase (Like distance travelled etc) and rate helps converting total trends (Speed movement etc)
PromQL’s time-based targeting functions: rate(), irate(), and increase().
- rate(): Calculates the per-second average rate of increase of the time series in the range vector.
- Ex: rate(http_requests_total{job=”api-server”}[5m]) per-second average rate of HTTP requests over the last 5 minutes, per time series
- irate(): (Also called instant rate) Alerting on sudden spikes. Calculates the per-second instant rate of increase of the time series in the range vector. This is based on the last two data points.
- Ex: irate(http_requests_total{job=”api-server”}[5m]) returns the per-second rate of HTTP requests looking up to 5 minutes back for the two most recent data points, per time series.
- increase(): Calculates the increase in the time series in the range vector.
- Ex: increase(http_requests_total{job=”api-server”}[5m]) returns the number of HTTP requests as measured over the last 5 minutes, per time series.
Aggregation
Combines many individual time series into a single, unified reading using functions like sum(). Ex: sum(), avg(), count() etc
Grouping
Group time series by targetting the system.
Ex: by(), without(),
Selectors & Matchers
- Selectors: Select the metric name you wish to see
- Matchers/Label Matchers: Return a subset of times series for a metric.
- Equality matcher (=)
- Negative equality matcher (!=)
- Regular expression matcher (=~)
- Negative regular expression matcher (!~)
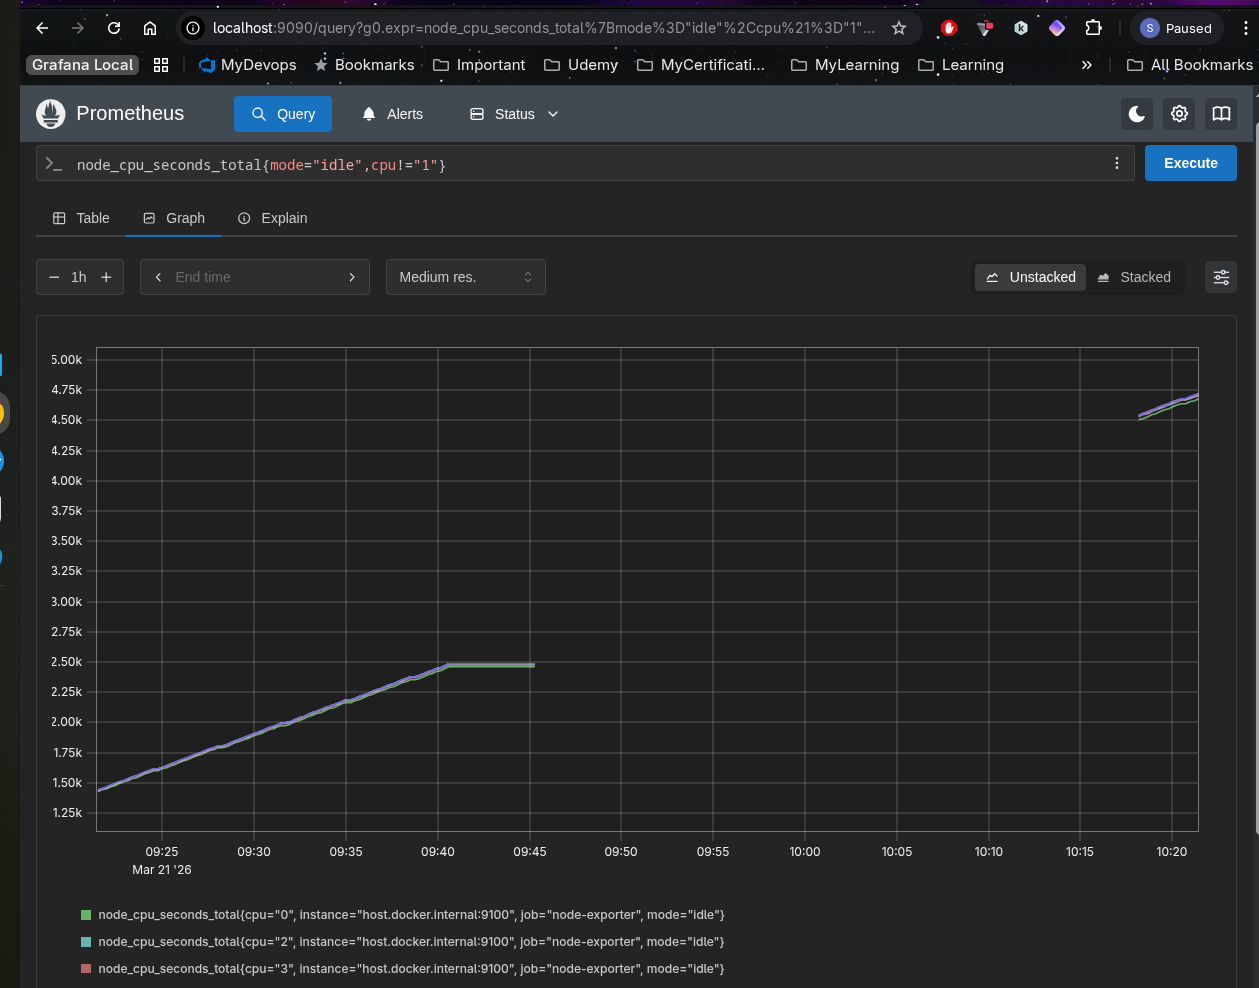
Ex: node_cpu_seconds_total{mode="idle",cpu!="1"}
Modifiers
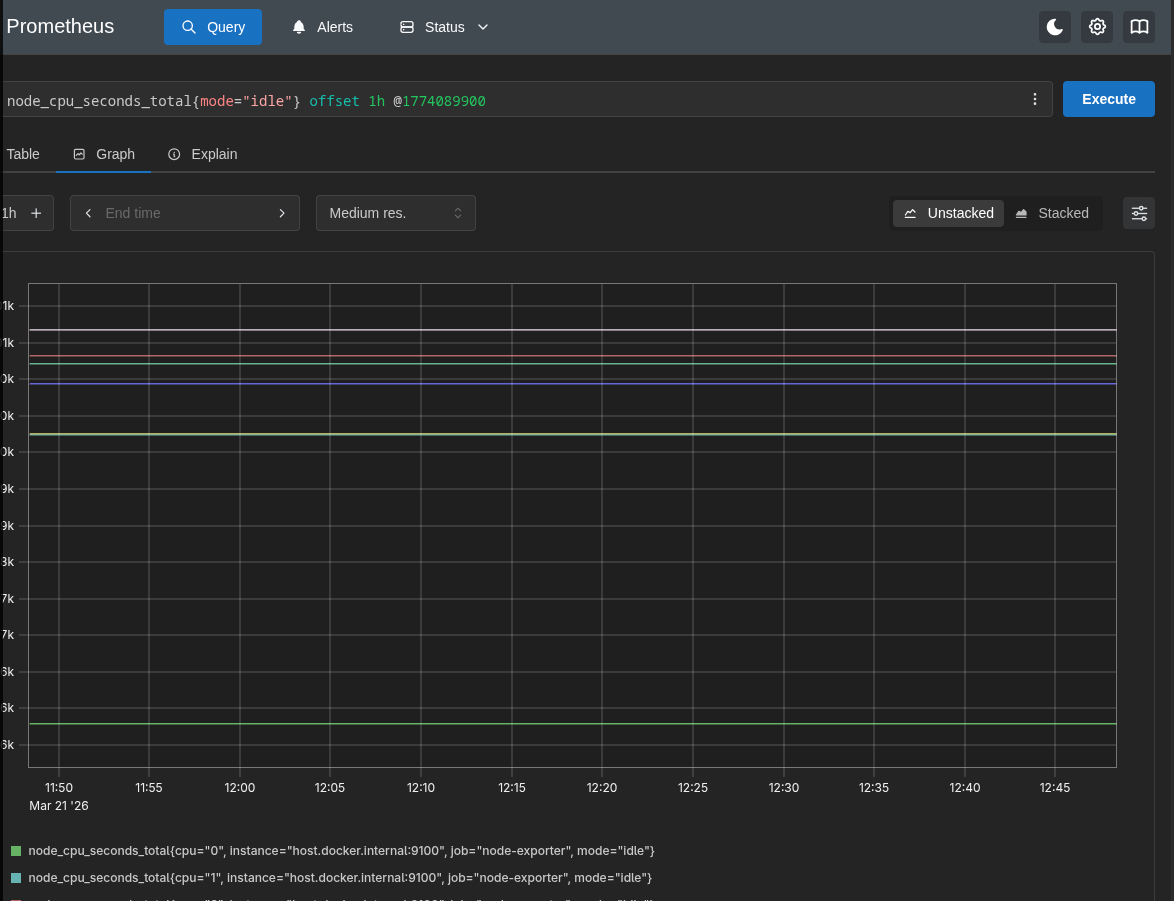
- Offset modifiers: Use off set for searching for historic data ex:
node_cpu_seconds_total{mode="idle"} offset 1h - modifier: To go back to specific in time use the modifier using @unixepoctime ex:
node_cpu_seconds_total{mode="idle"} @1774082700
You can combine both offset and modifier. Ex: node_cpu_seconds_total{mode="idle"} @1774082700 offset 1h.
- Order does not matter.
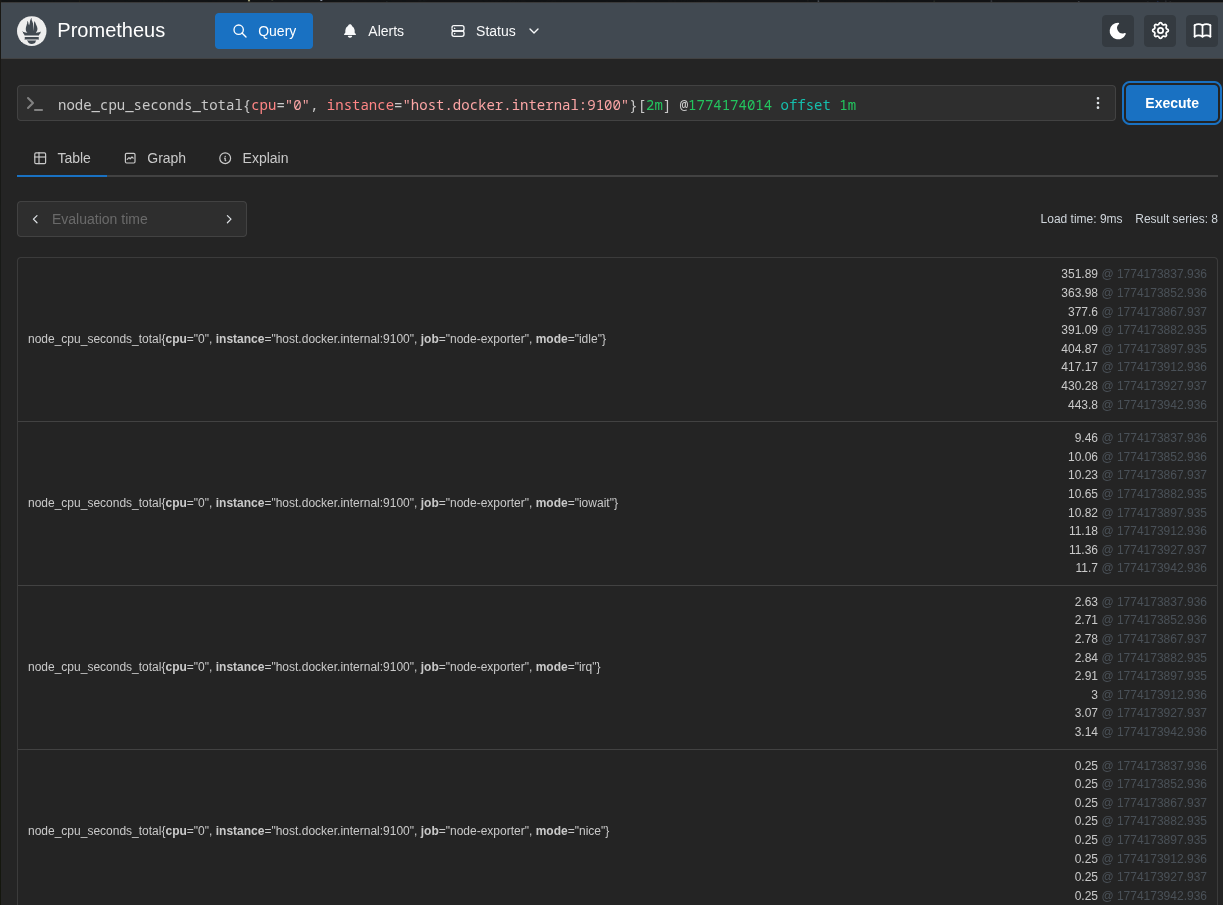
Ex: get 2mins worth of data 1m before Sunday, 22 March 2026 at 11:06:54 (which is 11:03:54 to 11:05:54). nnode_cpu_seconds_total{cpu="0", instance="host.docker.internal:9100"}[2m] @1774174014 offset 1m.
Operators
You can use operators like
- Arthimatics: addition, subtraction, multiplication, division, modulo & power
- Logical: OR, AND, UNLESS
- Comparision: equal, not equal, greater than, less than, greater or equal, less or equal
- Bool: true, false
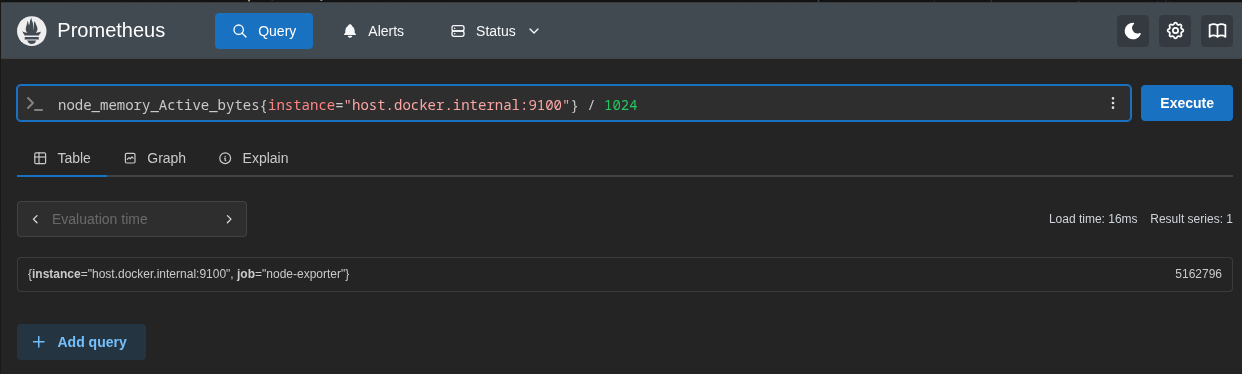
Ex: node_memory_Active_bytes{instance="host.docker.internal:9100"} / 1024
Ex: Unless - Return all time series greater than 500 unless it is greater than 5000. node_file_system_avail_bytes > 500 UNLESS node_file_system_avail_bytes > 5000
Vector Matching
Vector matching: when you perform metric1 / metric2. Ptometheus tries to match all labels exactly. the results will be incorrect / confusing output. So vector matrics helps to solves the problem.
Two basic types of matching behavior:
- One-to-one
- many-to-one/one-to-many.
one to one
All labels must be same for sample to match. Even extra labels do not allow to match
Ex:
- node_filesystem_avail_bytes{instance=”node1”,job=”node”,mountpoint=”/home”} 512
- node_filesystem_avail_bytes{instance=”node1”,job=”node”,mountpoint=”/var”} 484
- node_filesystem_size_bytes{instance=”node1”,job=”node”,mountpoint=”/home”} 1024
- node_filesystem_size_bytes{instance=”node1”,job=”node”,mountpoint=”/var”} 2048
Query: node_filesystem_avail_bytes / node_filesystem_size_bytes * 100
Result:
- {instance=”node1”,job=”node”,mountpoint=”/home”} 50
- {instance=”node1”,job=”node”,mountpoint=”/var”} 23.683r23
There might be certain instances where an operation needs to be perfromed on 2 vectors with different labels.
Use below methods
- ignoring: allows ignoring certain labels when matching.
- on: allows reducing the set of considered labels to a provided list:
Ex:
- method_code:http_errors{method=”get”, code=”500”} 24
- method_code:http_errors{method=”put”, code=”501”} 3
-
method_code:http_errors{method=”post”, code=”500”} 6
- method:http_requests{method=”get”} 600
- method:http_requests{method=”del”} 34
- method:http_requests{method=”post”} 120
If you perform http_errors:rate5m{code="500"} / http_requests it do not work as lables are different.
In this case use ignore or on
- use ignore
method_code:http_errors:rate5m{code="500"} / ignoring(code) method:http_requests:rate5m
- method put & del will not show any results as there is no match on both side.
- method get retuen results 0.04 (which is 24/600)
- method post retuen results 0.05 (which is 6/120)
- Use on
method_code:http_errors:rate5m{code="500"} / on(method) method:http_requests:rate5m
- This will consider list of all lables to match on.
many-to-one/one-to-many
Eqach vector elements on the the one side can match with multiple elements on the many side.
Ex:
- method_code:http_errors{method=”get”, code=”500”} 24
- method_code:http_errors{method=”get”, code=”404”} 30
- method_code:http_errors{method=”put”, code=”501”} 3
- method_code:http_errors{method=”post”, code=”500”} 6
-
method_code:http_errors{method=”post”, code=”404”} 21
- method:http_requests{method=”get”} 600
- method:http_requests{method=”del”} 34
- method:http_requests{method=”post”} 120
If you use on(method), there are multiple matches for method on left side (2 get methods, 2 post). The error will be many-to-one matching must be explicit (group_left/group.right).
So use group modifiers
- group_left: Allow many-to-one matching, where the left vector has higher cardinality.
- group_right: Allow one-to-many matching, where the right vector has higher cardinality.
Ex: method_code:http_errors:rate5m / ignoring(code) group_left method:http_requests:rate5m
Result:
- {method=”get”, code=”500”} 0.04 // 24 / 600
- {method=”get”, code=”404”} 0.05 // 30 / 600
- {method=”post”, code=”500”} 0.05 // 6 / 120
- {method=”post”, code=”404”} 0.175 // 21 / 120
group_right is the opposite
filling in missing matches
Fill modifiers are experimental and must be enabled with --enable-feature=promql-binop-fill-modifiers
By default, vector elements that do not find a match on the other side of a binary operation are not included in the result vector. Fill modifiers allow overriding this behavior by filling in missing series on either side of a binary operation with a provided default sample value:
- fill(
): Fill in missing matches on either side with value. - fill_left(
): Fill in missing matches on the left side with value. - fill_right(
): Fill in missing matches on the right side with value.
Aggregation operators
- sum(v) (calculate sum over dimensions)
- avg(v) (calculate the arithmetic average over dimensions)
- min(v) (select minimum over dimensions)
- max(v) (select maximum over dimensions)
- bottomk(k, v) (smallest k elements by sample value)
- topk(k, v) (largest k elements by sample value)
- limitk(k, v) (sample k elements, experimental, must be enabled with –enable-feature=promql-experimental-functions)
- limit_ratio(r, v) (sample a pseudo-random ratio r of elements, experimental, must be enabled with –enable-feature=promql-experimental-functions)
- group(v) (all values in the resulting vector are 1)
- count(v) (count number of elements in the vector)
- count_values(l, v) (count number of elements with the same value)
- stddev(v) (calculate population standard deviation over dimensions)
- stdvar(v) (calculate population standard variance over dimensions)
- quantile(φ, v) (calculate φ-quantile (0 ≤ φ ≤ 1) over dimensions)
These operators can either be used to aggregate over all label dimensions or preserve distinct dimensions by including a without or by clause. These clauses may be used before or after the expression.
ex:
- method_code:http_errors{method=”get”, code=”500”} 24
- method_code:http_errors{method=”get”, code=”404”} 30
- method_code:http_errors{method=”put”, code=”501”} 3
- method_code:http_errors{method=”post”, code=”500”} 6
- method_code:http_errors{method=”post”, code=”404”} 21
using sum by(code) (http_errors)
Result:
- {code=”500”} 30 (24+6)
- {code=”404”} 51 (30+21)
- {code=”501”} 3 (3)
You can also use muliple by clauses sum by(code, method) (http_errors)
using without does the oppoiste of by, tells the query which labels not to include in the aggregation
- method_code:http_errors{method=”get”, code=”500”} 24
- method_code:http_errors{method=”get”, code=”404”} 30
- method_code:http_errors{method=”put”, code=”501”} 3
- method_code:http_errors{method=”post”, code=”500”} 6
- method_code:http_errors{method=”post”, code=”404”} 21
using sum without(code) (http_errors)
Result:
- {method=”get”} 54 (24+30)
- {method=”put”} 3 (3)
- {method=”post”} 27 (6+21)
Next Page: Architecture
Main Page: Click Here