MyObservability
Profiling
profiling is another telemetry type used to precisely determine how an application consumes resources. Profiling can help you understand how your applications are using resources like CPU and memory, and identify areas where optimization may be needed to improve their performance.
Continuous Profiling/AlwaysOn profiling: Unlike traditional profiling, which may be turned on temporarily or during specific investigations, AlwaysOn Profiling is designed to run continuously, gathering profiling data with minimal impact on application performance.
Profiling Types
- - Event-based profilers
- - Statistical profilers
Event-based profilers
- Java: the JVMTI (JVM Tools Interface) API, formerly JVMPI (JVM Profiling Interface), provides hooks to profilers, for trapping events like calls, class-load, unload, thread enter leave.
- .NET: Can attach a profiling agent as a COM server to the CLR using Profiling API. Like Java, the runtime then provides various callbacks into the agent, for trapping events like method JIT / enter / leave, object creation, etc. Particularly powerful in that the profiling agent can rewrite the target application's bytecode in arbitrary ways.
- Python: Python profiling includes the profile module, hotshot (which is call-graph based), and using the 'sys.setprofile' function to trap events like c_{call,return,exception}, python_{call,return,exception}.
- Ruby: Ruby also uses a similar interface to Python for profiling. Flat-profiler in profile.rb, module, and ruby-prof a C-extension are present.
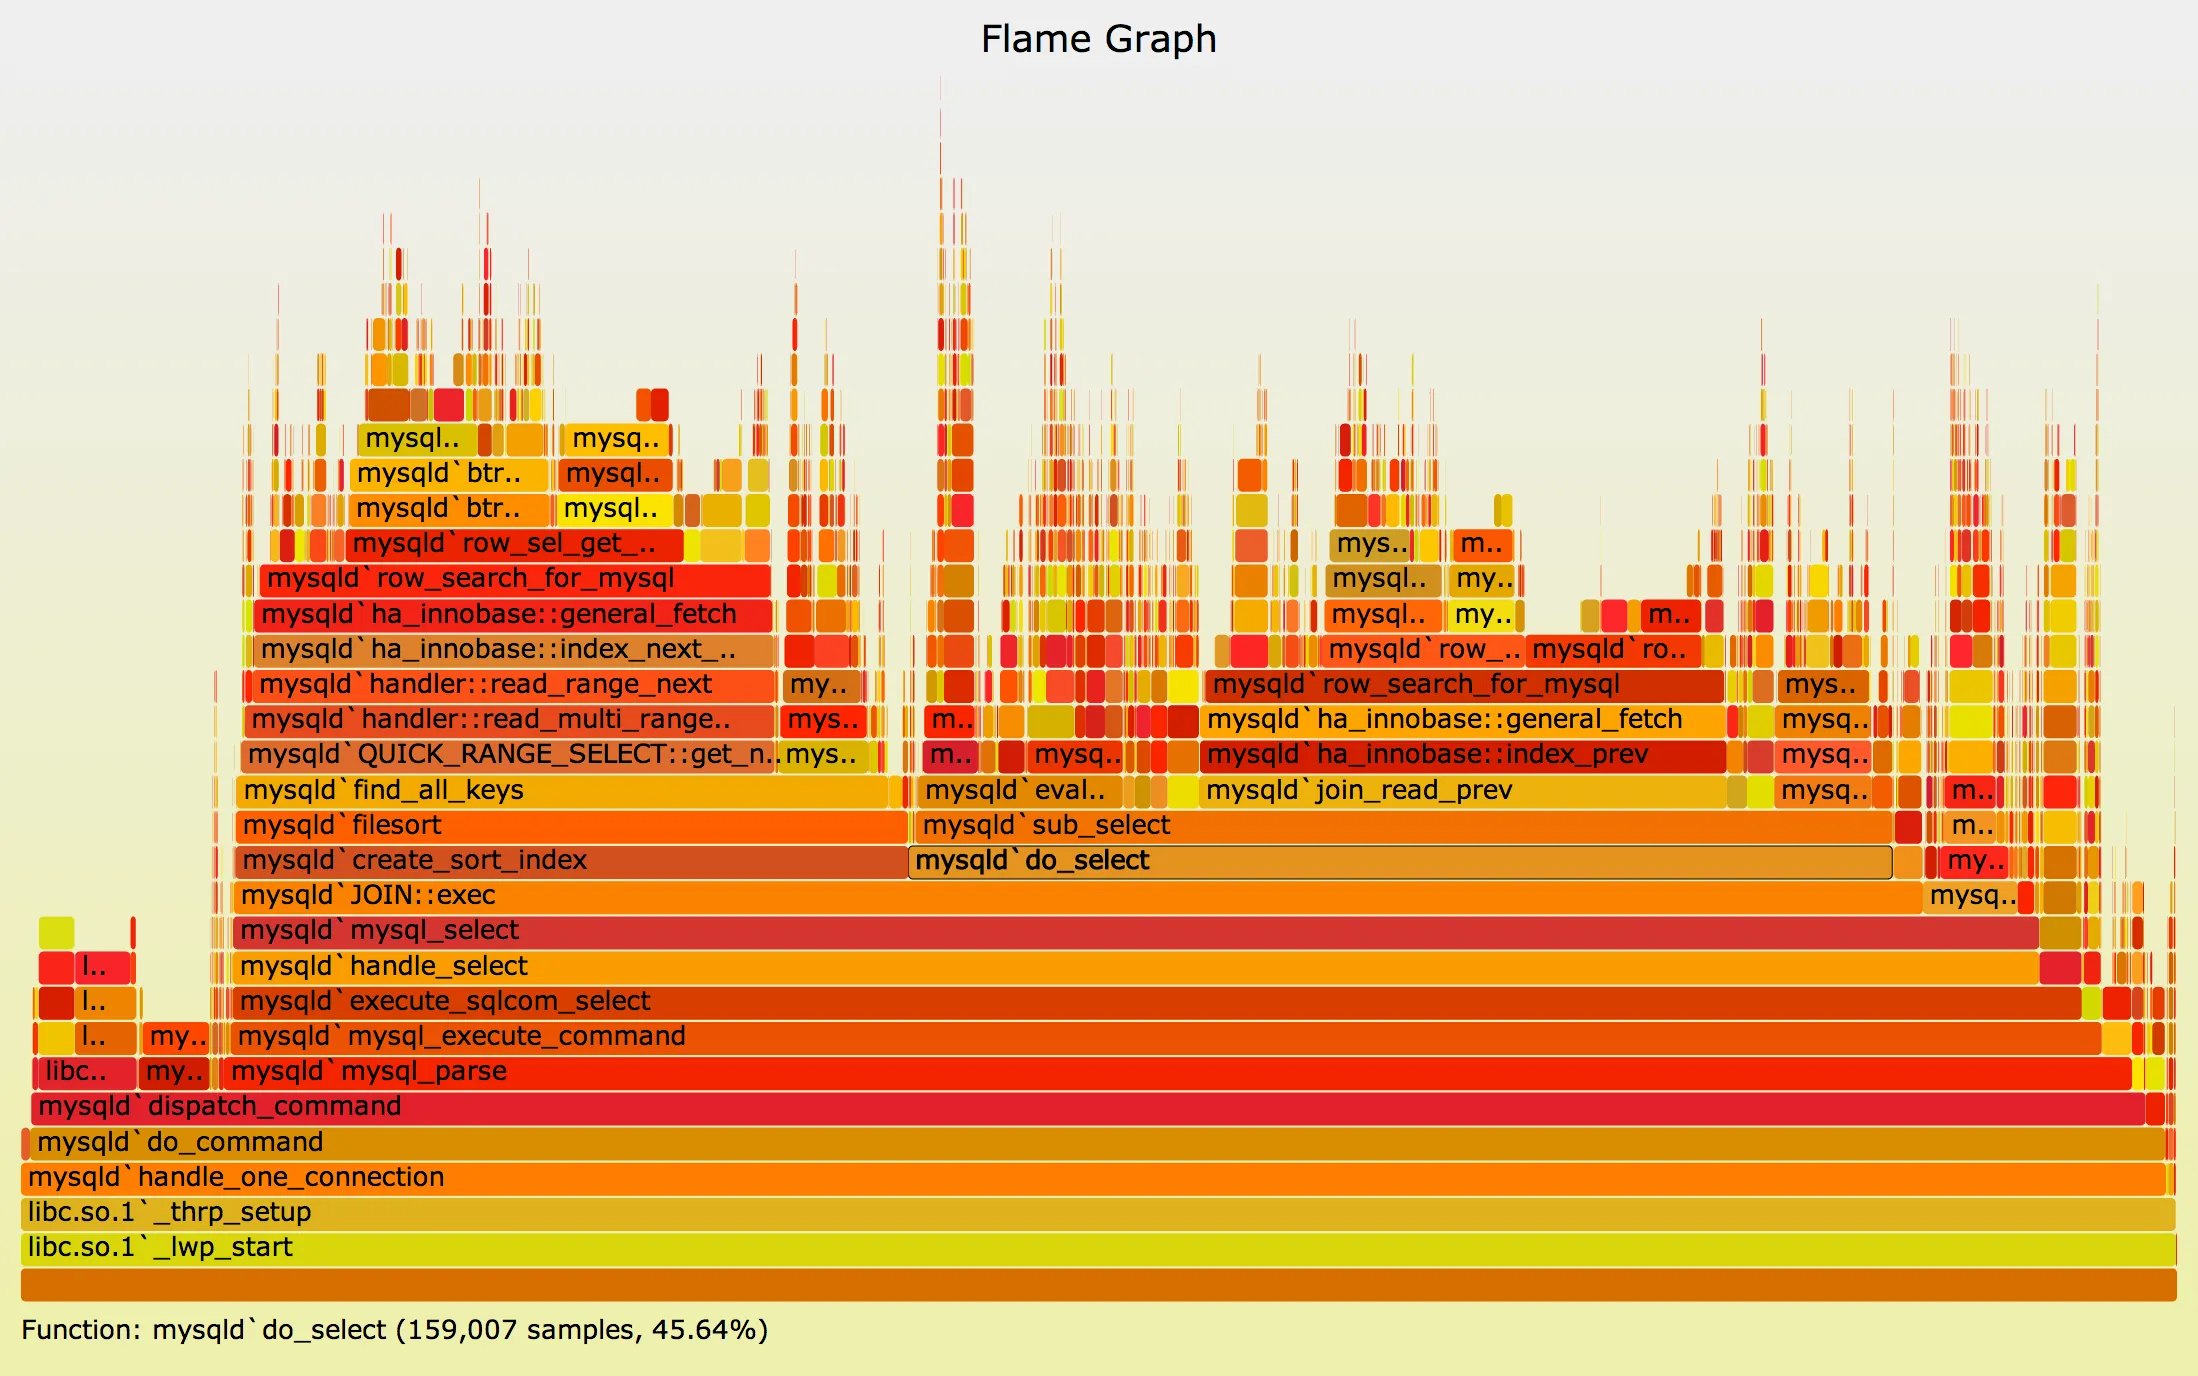
Statistical profilers
Some profilers operate by sampling. A sampling profiler probes the target program's call stack at regular intervals using operating system interrupts. Sampling profiles are typically less numerically accurate and specific, but allow the target program to run at near full speed. Ex: kernel code to handle the interrupts entails a minor loss of CPU cycles, diverted cache usage, and is unable to distinguish the various tasks occurring in uninterruptible kernel code.