MyObservability
Overview
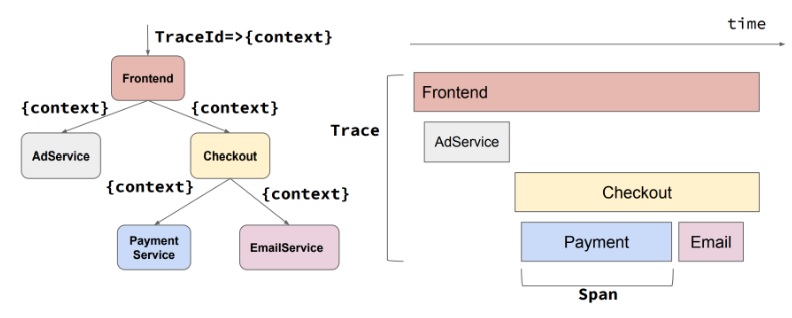
Distributed tracing aims to address these challenges by creating a trace, which is a representation of a single user request's journey through the various services and components. Each trace consists of a series of interconnected spans, where each span represents an individual operation or activity within a specific service or component. When a request enters a service, the trace context is propagated along with the request. This usually involves injecting trace headers into the request, allowing downstream services to participate in the same trace. As the request flows through the system, each service generates its own span and updates the trace context with information about its operation's duration, metadata, and any relevant context.
List of components
- - Traces: Traces represent single execution flows in your application or service
- - Spans: While traces define the global scope of an execution flow, spans represent the individual tasks performed within that scope.
- - Attributes and events: Attributes are a list of key-value pairs. Events denote particular points in time throughout your span. Ex http.status_code, http.url, net.transport etc
- - Context: It represents information that identifies a span within the trace and is transferred to child spans across process boundaries. like trace ID, span ID, trace state & trace flags.
- - Propagation: With context propagation, each service passes on the current state of its trace when it calls another (instrumented) service. With this information, the next service can build on top of the existing trace and continue with its own spans and telemetry information.
- - Baggage: Baggage is an interprocess communication mechanism that allows your services to exchange information across context propagation in a standardized key-value format.
Details
- - Tracer: A Tracer creates spans containing more information about what is happening for a given operation, such as a request in a service. Tracers are created from Tracer Providers.
- - Tracer Provider: In most applications, a Tracer Provider is initialized once and its lifecycle matches the application’s lifecycle. Tracer Provider initialization also includes Resource and Exporter initialization. Tracer provider is an artifact of the SDK and in charge of where and how the telemetry data gets moved out of the process.
- - Trace Exporter: Trace Exporters send traces to a consumer.
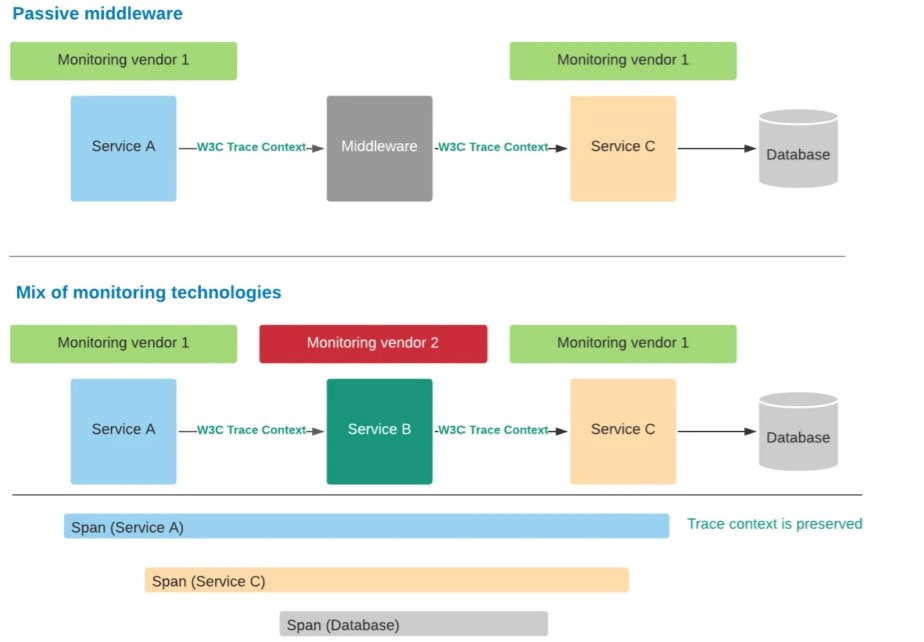
- - Trace Context: With Context Propagation, Spans can be correlated with each other and assembled into a trace, regardless of where Spans are generated.
- Context is an object that contains the information for the sending and receiving service to correlate one span with another and associate it with the trace overall. For example, if Service A calls Service B, then a span from Service A whose ID is in context will be used as the parent span for the next span created in Service B.
- Propagation is the mechanism that moves Context between services and processes. By doing so, it assembles a Distributed Trace. It serializes or deserializes Span Context and provides the relevant Trace information to be propagated from one service to another.
To start tracing, you’ll need to have an initialized TracerProvider that will let you create a Tracer.
Span
A trace includes one or more spans, which are the instances of a particular operation. A span has a parent span that it is linked to, unless it is the first span in the trace in which case its span parent ID is all zeros.
A span represents a unit of work or operation. Spans are the building blocks of Traces. In OpenTelemetry, they include the following information:
- - Name: The name of the span
- - Parent span ID: The ID of the parent span (empty for root spans)
- - Start and End Timestamps: The start and end times of the span
- - Span Context: The context of the span
- - Attributes: Key-value pairs associated with the span
- - Span Events: Time-stamped annotations of key moments in the span
- - Span Links: Links to other spans
- - Span Status: The status of the span
The way that we can add spans to an existing trace (or start a new one) is through the API module. Include OTel Module and create a span by making a call to the global tracer provider.
Context
Context is an object that contains the information for the sending and receiving service to correlate one span with another and associate it with the trace overall. For example, if Service A calls Service B, then a span from Service A whose ID is in context will be used as the parent span for the next span created in Service B.
Types: Span & Correlation context
- - Span Context: Data required for moving trace information across boundaries. It contains the following metadata:
- Trace ID
- Span ID
- Trace Flags
- Trace State
Correlation Context
Correlation Context: It carries user-defined properties, such as customer ID, address, host details, etc. It is not necessary, but we can choose to ignore the correlation context.
OpenTelemetry Propegation
Propagation is the mechanism that moves Context (Span & Correlation) between services and processes. By doing so, it assembles a Distributed Trace. It serializes or deserializes Span Context and provides the relevant Trace information to be propagated from one service to another.
OpenTelemetry Baggage
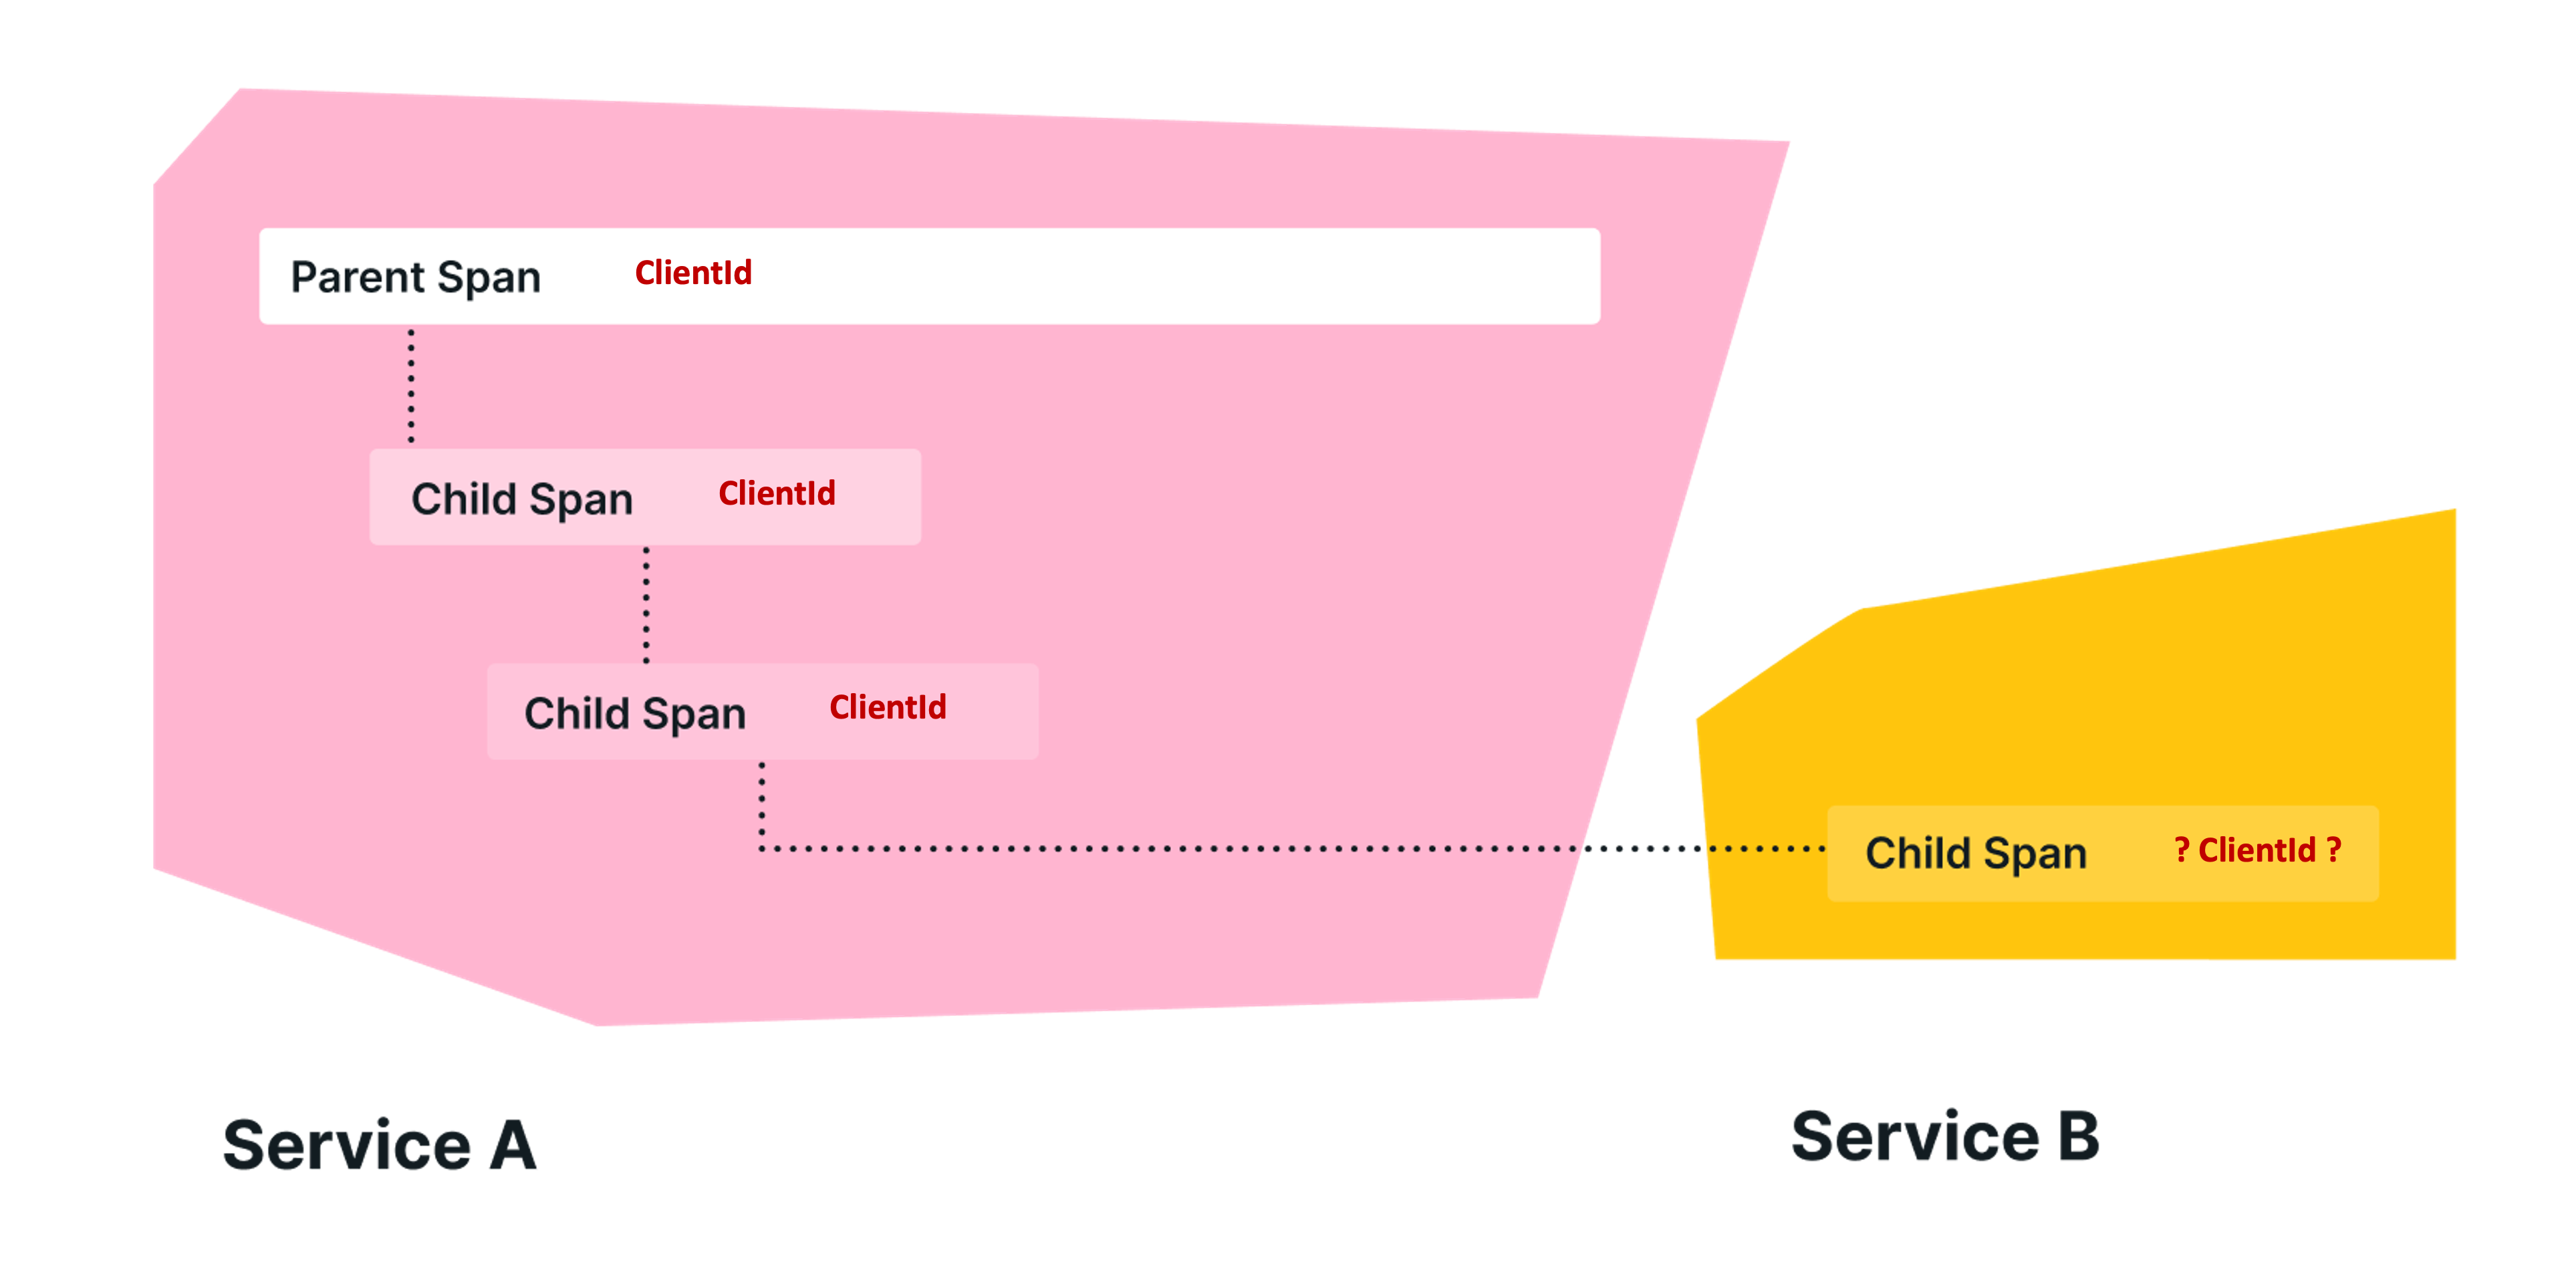
In OpenTelemetry, Baggage is contextual information that’s passed between spans. It’s a key-value store that resides alongside span context in a trace, making values available to any span created within that trace.
For example, imagine you want to have a CustomerId attribute on every span in your trace, which involves multiple services; however, CustomerId is only available in one specific service. To accomplish your goal, you can use OpenTelemetry Baggage to propagate this value across your system.