MyObservability
Synthetics Monitoring
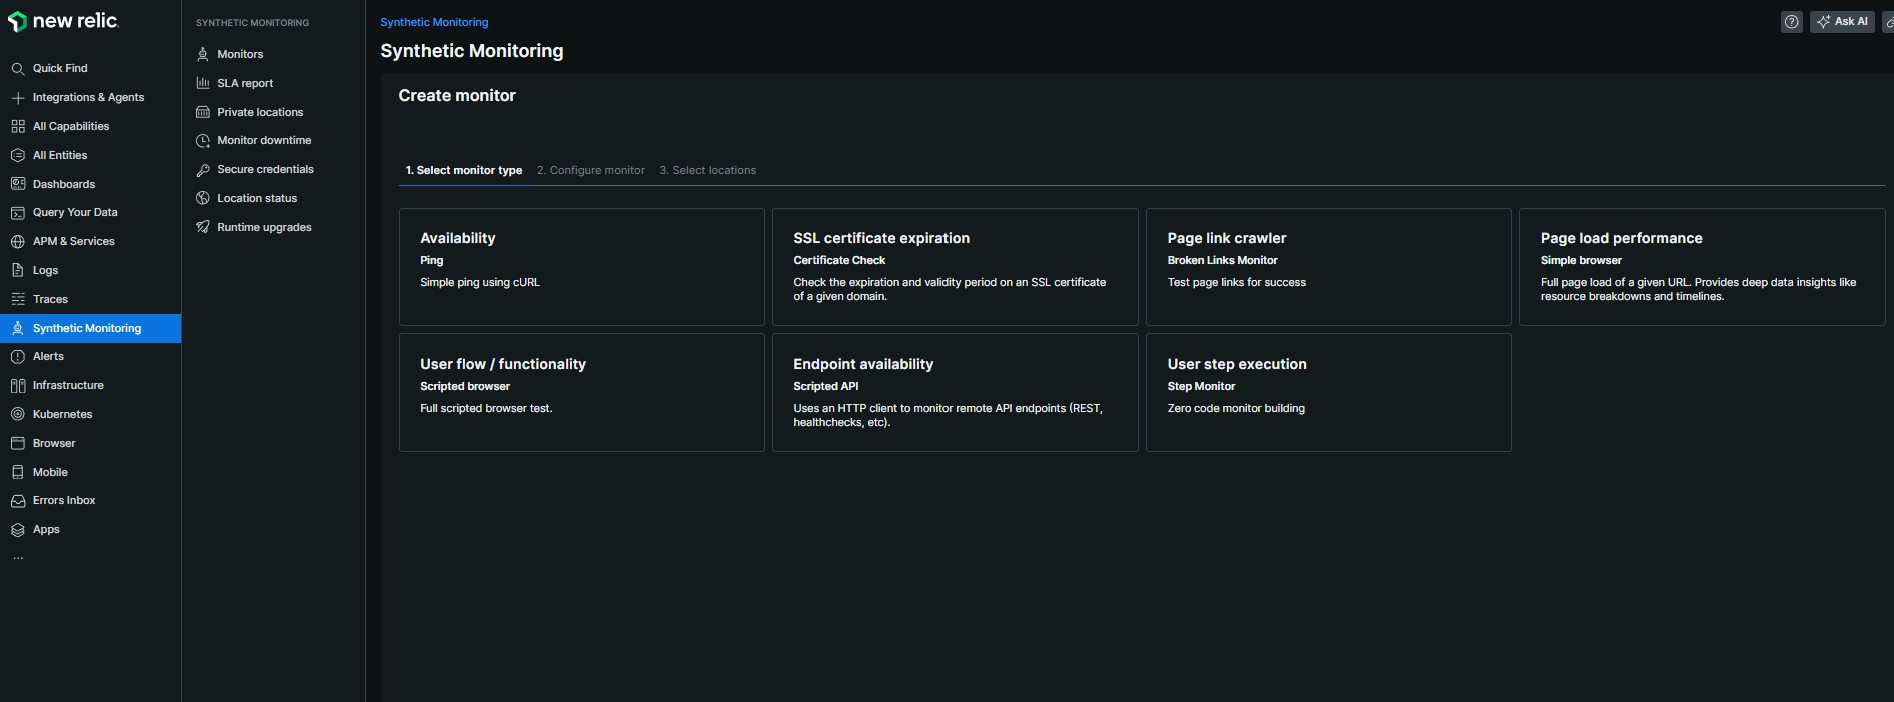
NewRelic Synthetics Monitoring Capabilities
- Availability (Ping) - Simple ping using cURL
- SSL certificate expiration (Certificate Check) - Check the expiration and validity 3. period on an SSL certificate of a given domain.
- Page link crawler (Broken Links Monitor) - Test page links for success
- Page load performance (Simple browser) - Full page load of a given URL. Provides deep data insights like resource breakdowns and timelines.
- User flow / functionality (Scripted browser) - Full scripted browser test.
- Endpoint availability (Scripted API) - Uses an HTTP client to monitor remote API endpoints (REST, healthchecks, etc).
- User step execution (Step Monitor) - Zero code monitor building
Synthetic Monitor Types
- Ping monitor’
- Simple Browser Monitor
- Scripted Browser Monitor
- API Monitor
Synthetic Monitoring Setup
- Set up synthetic monitoring is through the New Relic One dashboard
- Configure synthetic monitors using the New Relic Command Line Interface (CLI).
- New Relic provides a Terraform provider for automating synthetic monitor creation
- Programmatically set up synthetic monitors using the New Relic REST API.
- For complex workflows, you can create custom synthetic scripts using New Relic’s Scripted Browser or API Test.
- As part of your CI/CD pipelines by incorporating API calls or scripts into tools like Jenkins, GitHub Actions, or CircleCI.
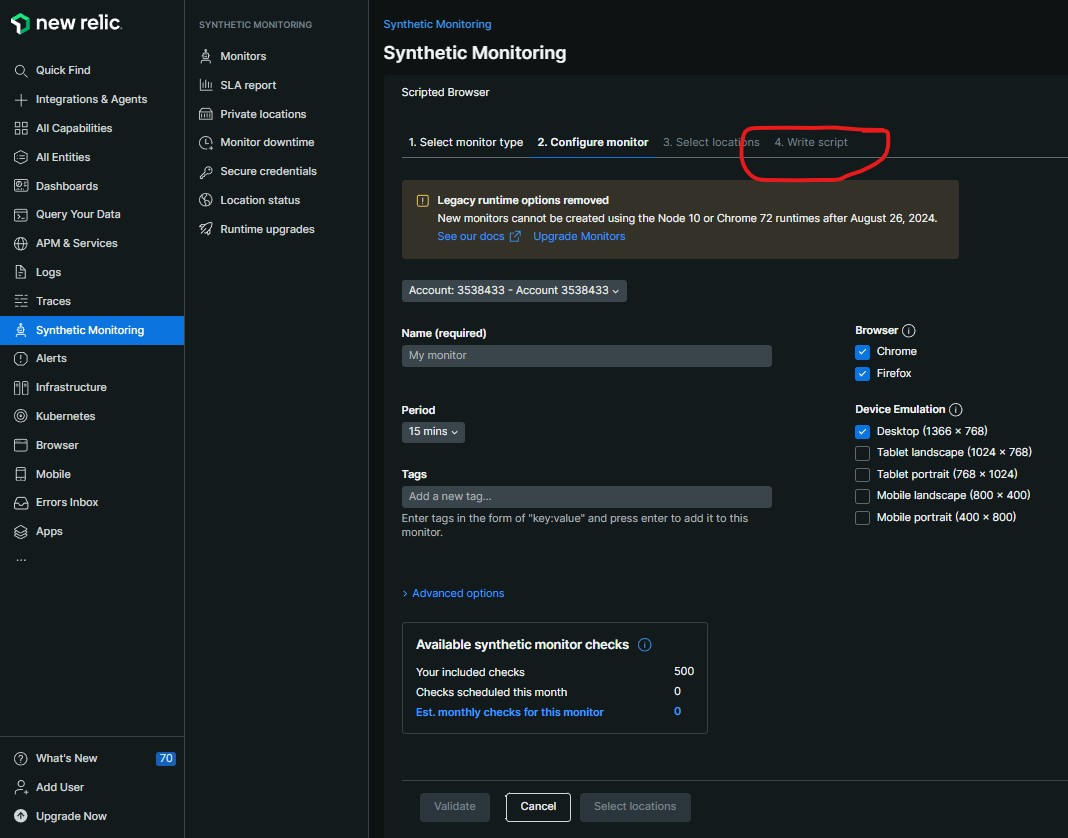
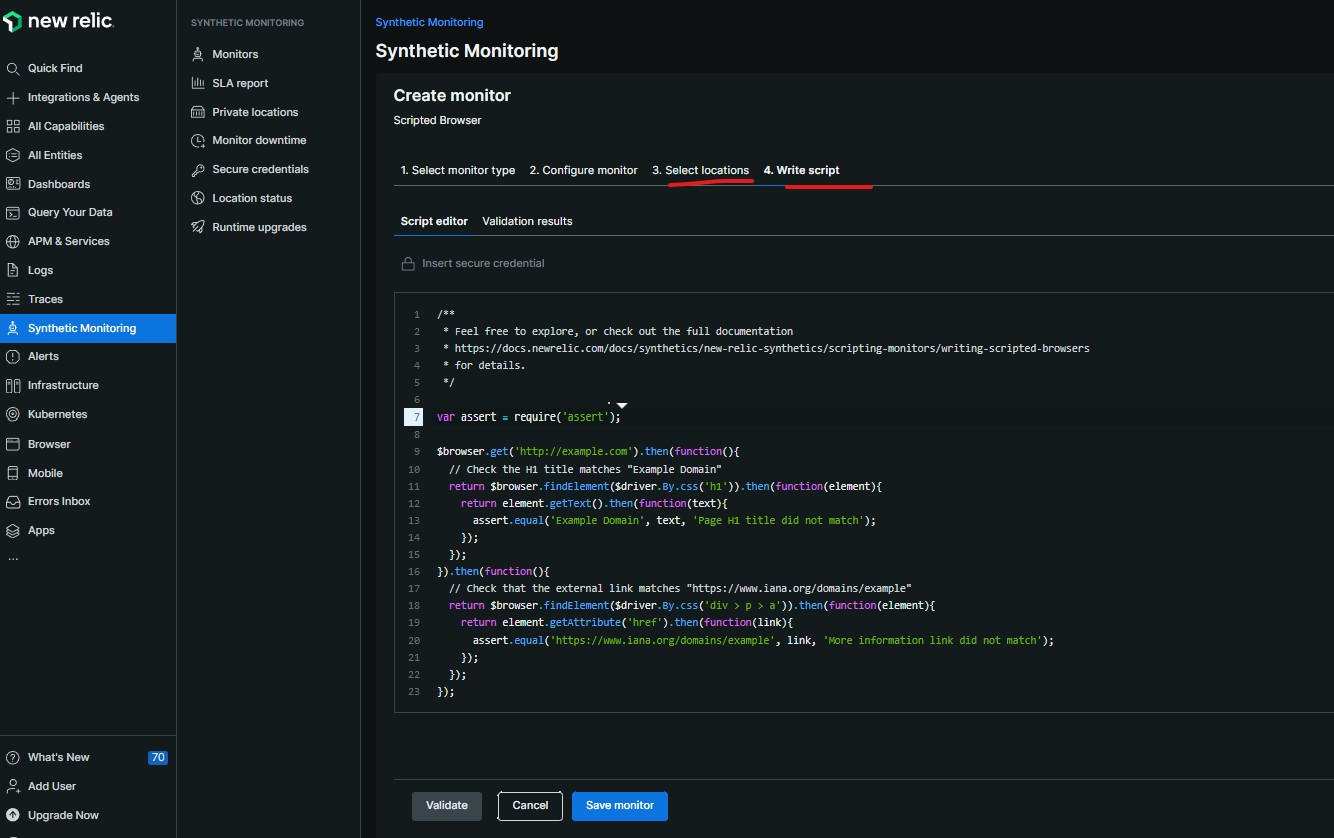
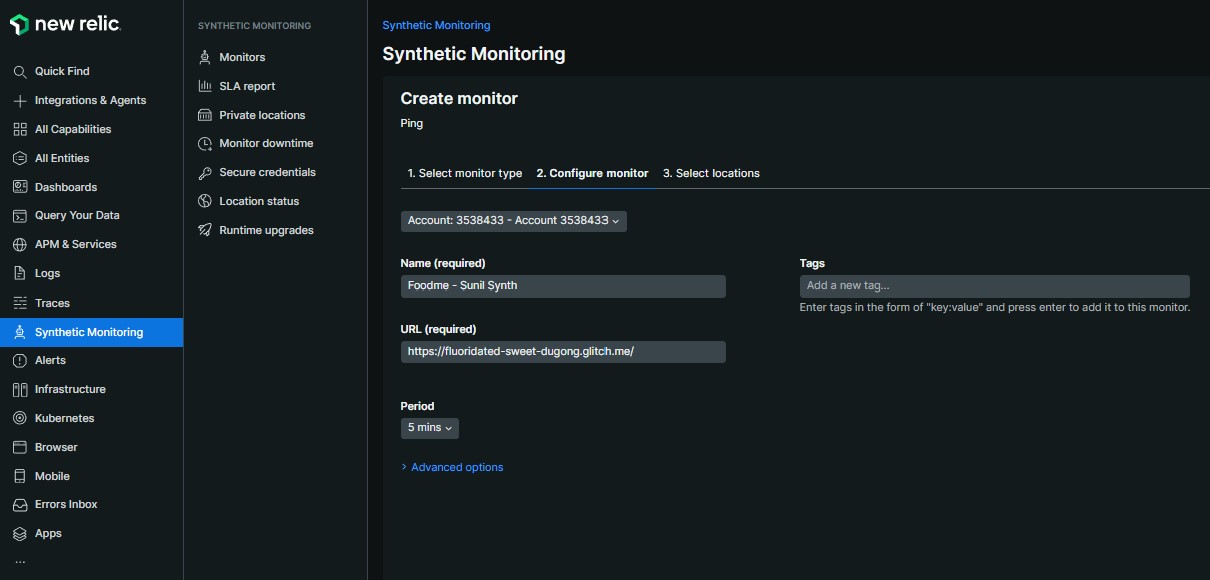
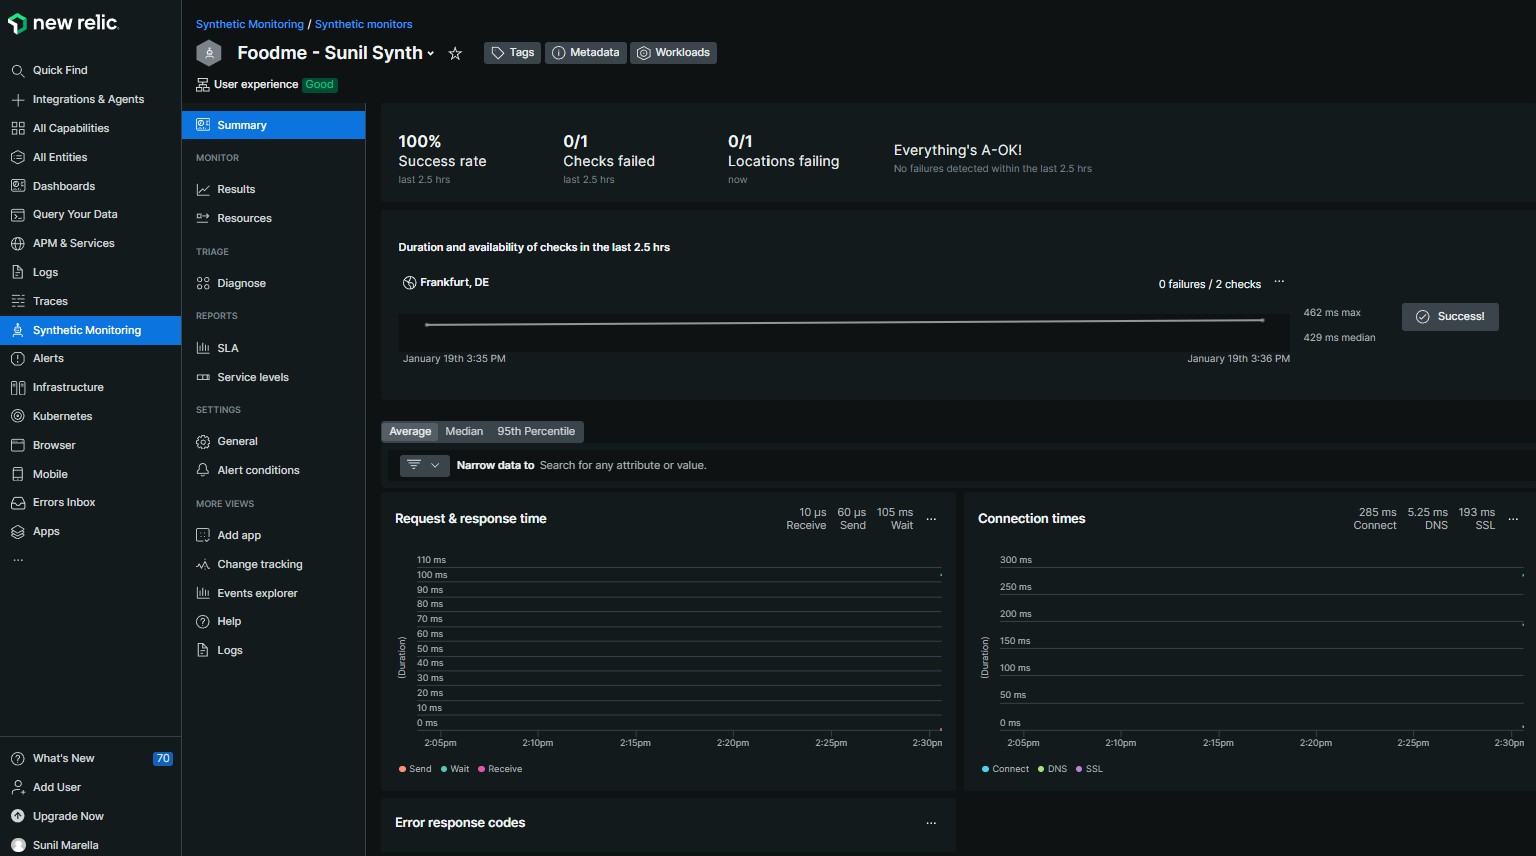
Configuring Synthetics
Ex: Availability
Ex: Use flow/functionality (Scripted)