MyObservability
🟦 Introduction
OpenTelemetry is open-source, vendor agnostic and works with multiple Observability platforms at the same time. Implementing tracing steps:
- Instrument your application
- Collect and process the data
- Store and visualize the data
🟩 OpenTelemtry Overview
The OpenTelemetry project aims to provide a vendor agnostic way to instrument and collect your data. It is a collection of APIs, SDKs, and tools. Use it to instrument, generate, collect, and export telemetry data (metrics, logs and traces) to help you analyze your software’s performance and behavior.
- Instrumentation
- Manual Instrumentation
- Automatic Instrumentation
- Instrumentation Libraries
- Components
- Collectors
- Propagators
- Sampling
- Protocol
- Extension
🟥 Instrumentation
The data from the application can be generated using either automatic or manual (or a mix) instrumentation.
To instrument your application with OpenTelemetry, go to the OpenTelemetry repository, and pick the language for your application and follow the instructions.
- Manual Instrumentation: Manual instrumentation is when you write specific code for your application.
- Auto Instrumentation: Using the auto-instrumentation can be a good first step as this is simple, easy, and doesn’t require many code changes.
- Instrumentation Libraries: Instrumentation libraries are pre-built or custom code components used to instrument applications.
🟥 Baggage
Baggage is contextual information that resides next to context. Baggage is a key-value store, which means it lets you propagate any data you like alongside context.
Ex: For example, imagine you have a clientId at the start of a request, but you’d like for that ID to be available on all spans in a trace, some metrics in another service, and some logs along the way. Because the trace may span multiple services, you need some way to propagate that data without copying the clientId across many places in your codebase.
🟥 Resources and Attributes
Enrich spans with Resources and Attributes. The purpose is to enrich observability data so it’s useful for querying, visualizing, and diagnosing systems.
- Resources are metadata about the application and environment like ServiceName.
- Attributes are metadata about a specific span, Metric or log like DB Query, user ID etc.
🟥 Context
Context is an object that contains the information for the sending and receiving service, or execution unit, to correlate one signal with another.
For example, if service A calls service B, then a span from service A whose ID is in context will be used as the parent span for the next span created in service B. The trace ID that is in context will be used for the next span created in service B as well, which means that the span is part of the same trace as the span from service A
OpenTelemetry SpanContext boundary could be in-process or a network. SDK automatically generates SpanContext for us.
🟥 Propagation
Propagation is the mechanism that moves context between services and processes. It serializes or deserializes the context object and provides the relevant information to be propagated from one service to another.
Propagation usually handled by instrumentation libraries. or you can use Propagators API.
🟥 Sampling
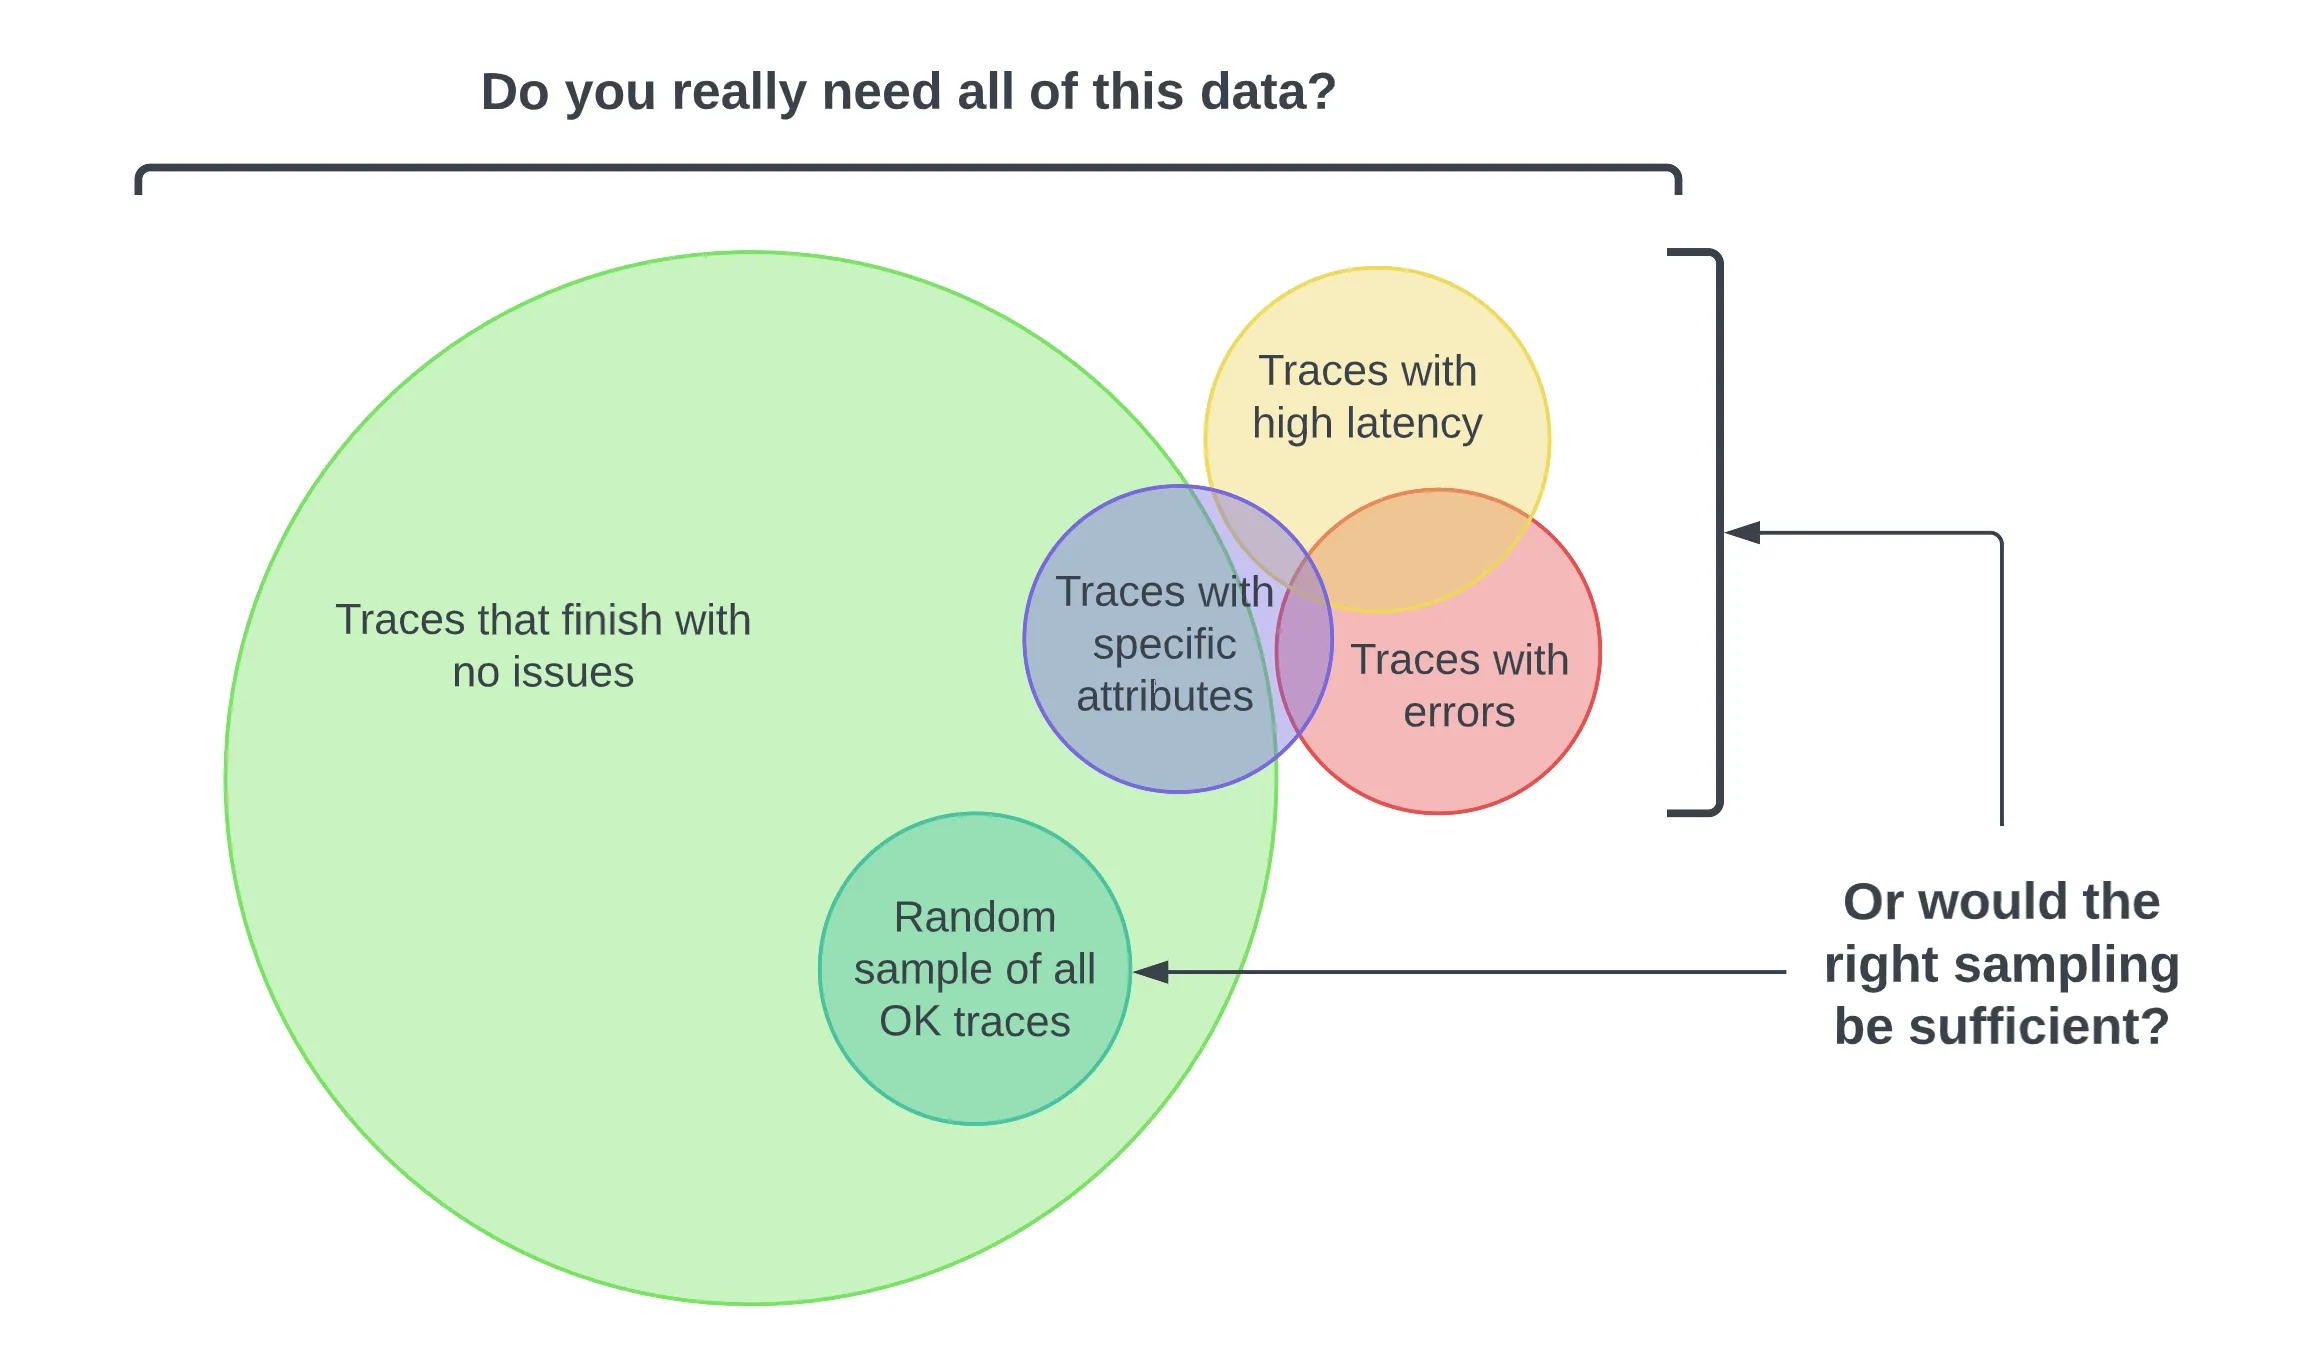
Sampling is a mechanism to control the noise and overhead by reducing the number of samples of traces collected and sent to the backend.
OpenTelemetry can perform sampling depending on the amount of traces/traffic you want to send. (ie. take only 10% of the traces).
🟥 Components
OpenTelemetry can be further divided into other logical components that comprise the typical OTel solution. They are
- APIs: In charge of gathering the telemetry and all the data that is part of it.
- SDKs: get this data out of the current observed process to another entity for analysis
- OTLP: Opentelemetry Protocol is telemetry data exchange protocol.
- Collector: is a vendor-agnostic proxy that can receive, process, and export telemetry data.
Because they are separate, they allow us to decouple what is observed (API) to how it is handled (SDK). </br>
Technical Components
API
- Tracing API: Provide interface that we use to add telemetry (Ex: traces) instrumentation to the application.
SDK
Language-specific implementation of the API. Configuration, data processing, and exporting concepts are also defined here.
With in SDK you will have
- Trace provider (Traces)
- Meter Provide (Metrics)
- Logger provider (Logs)
Trace provider
TracerProvider (SDK): It’s the factory that gives you Tracer instances. You configure it to control the tracing pipeline.
- Tracer: The Tracer is the main object your app uses to create and manage spans. Each tracer, Starts spans, Links to parent spans, Lets you manage attributes and events
- SpanProcessor: A middleware between the creation of a span and its export. You can add multiple span processors
- SimpleSpanProcessor (exports immediately).
- BatchSpanProcessor (exports in batches — better for production)
- Custom processors (e.g., for filtering, metrics enrichment)
- SpanExporter: This is the final destination handler — it sends your span data to a backend like: OpenTelemetry Collector Or / And to Grafana Tempo, Splunk Or File or console.
- Synchronous: Blocks program execution to forward spans as soon as they generate. Adds additional latency to transactions/requests.
- Asynchronous: (Via batchSpanProcessor), Maintain buffer for completed spans. A separate thread launches to export batches of span. Spans might be dropped if application crashes before span exported or buffer capacity met.
- Resource Detectores: Helps identify where the span is originated, what kind of resources is it running on.
- Sampling: Samples from large amount of spans.
🟥 Collectors
The collector’s entire job can be broken down into three different stages:
- Receive telemetry data
- Process telemetry data
- Export telemetry data
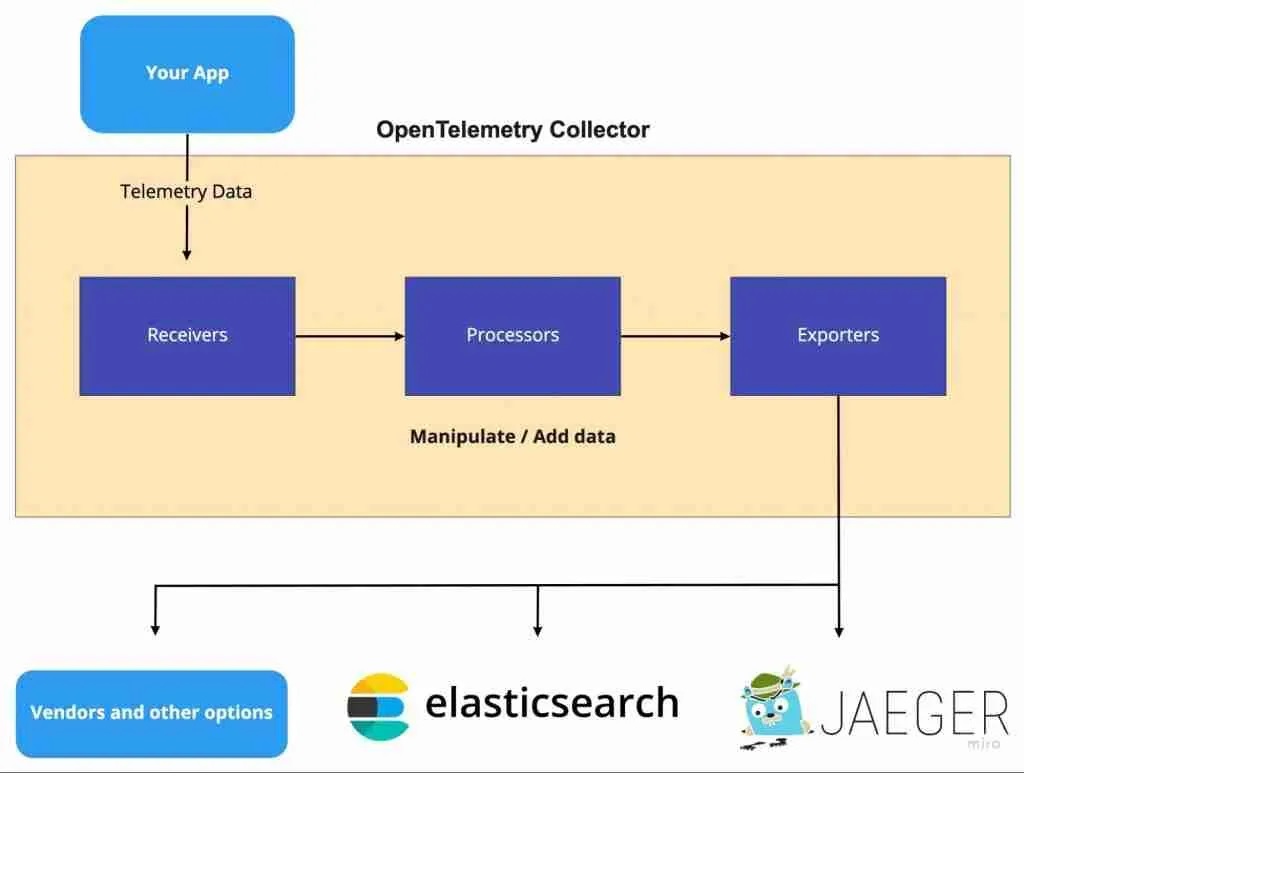
🟨 Receive telemetry data
How data gets into the collector (Push or pull based).
🟨 Process telemetry data
Once the data is received , the collector can process the data.
List of Processors
Ex: “batch” processor
The batch processor accepts spans, metrics, or logs and places them into batches. Batching helps better compress the data and reduce the number of outgoing connections required to transmit the data. This processor supports both size and time based batching.
Ex:
processors:
  batch:
Processors are enabled via pipelines within the service section.
service:
    traces:
      receivers: [opencensus, jaeger]
      processors: [batch]
      exporters: [opencensus, zipkin]
🟨 Export telemetry data
An exporter is a component of OpenTelemetry and is how data gets sent to different systems/back-ends. OpenTelemetry comes with a variety of exporters.
In the exporters section, you can add destinations.
🟥 Extensions
Extensions are available primarily for tasks that do not involve processing telemetry data. Examples of extensions include health monitoring, service discovery, and data forwarding. Extensions are optional.
Ex:
extensions:
  health_check:
  pprof:
  zpages:
  memory_ballast:
    size_mib: 512
🟩 OpenTelemetry Roadmap
Even though Telemetry is widely used, not all functionalities it support. OpenTelemetry has a road map to provide following features in near future.
- Logs
- Client Instrumentation (RUM)
- Code profiling
🟩 OpenTelemetry Architecture
OpenTelemetry architecture is designed to provide a standardized approach to collecting, transmitting, and processing telemetry data from applications and services.
✅ Next Chapter: Recommended Setup
✅ Main Page: Click Here