MyObservability
🟦 OpenTelemetry Specifications
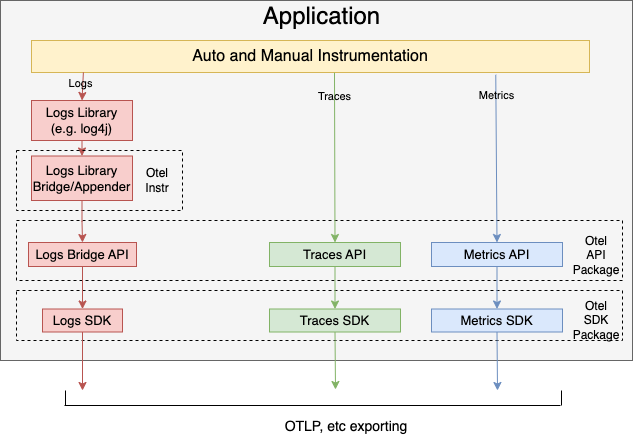
OpenTelemetry is developed on a signal (Tracing, Metric, baggage and Logging). Signals are built on top of context propagation, a shared mechanism for correlating data across distributed systems.
Each signal consists of four core components:
- APIs
- SDKs
- OpenTelemetry Protocol (OTLP)
- Collector
- API: Defines data types and operations for generating and correlating tracing, metrics, and logging data.
- SDK: Defines requirements for a language-specific implementation of the API. Configuration, data processing, and exporting concepts are also defined here.
- Data: Defines the OpenTelemetry Protocol (OTLP) and vendor-agnostic semantic conventions that a telemetry backend can provide support for.
🟩 API Specification
OpenTelemetry defines API specifications for different types of telemetry data (signals) to provide a unified way to collect and export observability data from applications.
API Specifications are
- Tracing API
- Metric API
- OpenTelemetry Logging
Tracing API
Tracing API consist of these main components
- TracerProvider: Entry point of the API. It provides access to Tracers
- Tracer: Responsible for creating span
- Span: API to trace an operation
- Context Propagation: Mechanisms to pass trace information (like trace IDs) between services.
Metric API
Tracing API consist of these main components.
- MeterProvider: Entry point of the API. It provides access to Meters.
- Meter: responsible for creating Instruments.
- Instrument: Responsible for reporting Measurements.
🟩 SDK Specification
- Tracing SDK
- Metric SDK
- Logs SDK
🟩 Semantic conventions
OpenTelemetry defines Semantic Conventions, sometimes called Semantic attributes, that specify common names for different kinds of operations and data.
Semantic conventions are available for traces, metrics, logs, profiles and resources:
Ref:
- Trace semantic conventions
- Metric semantic conventions
- Log semantic conventions
- Profiles semantic conventions
- Resource semantic conventions
🟩 OpenTelemetry Collector
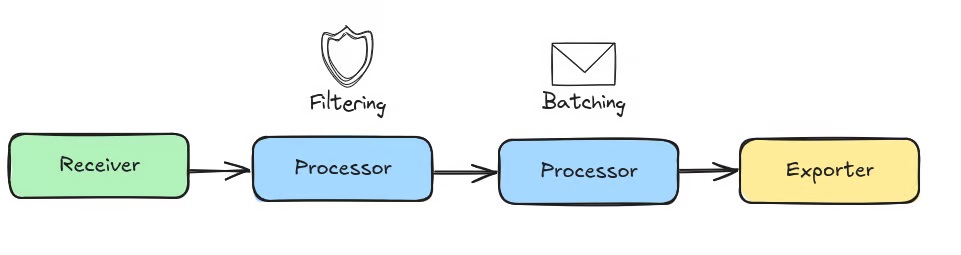
The data from your instrumented application can be sent to an OpenTelemetry collector. The collector is a component of OpenTelemetry that receives data (spans, metrics, logs etc) process (pre-processes data), and exports the data (sends it off to a backend that you want to talk to). The structure of any Collector configuration file consists of four classes of pipeline components that access telemetry data:
- Receivers
- Processors
- Exporters
- Connectors
Additional Configuration
- Extensions
After each pipeline component is configured you must enable it using the pipelines within the service section of the configuration file.
🟩 Extensions
Extensions are available primarily for tasks that do not involve processing telemetry data. Examples of extensions include health monitoring, service discovery, and data forwarding. Extensions are optional.
✅ Next Chapter: Instrumentation
✅ Main Page: Click Here