MyObservability
Service Analyser
The Service Analyzer enables you to see the health of your IT environment at a glance.
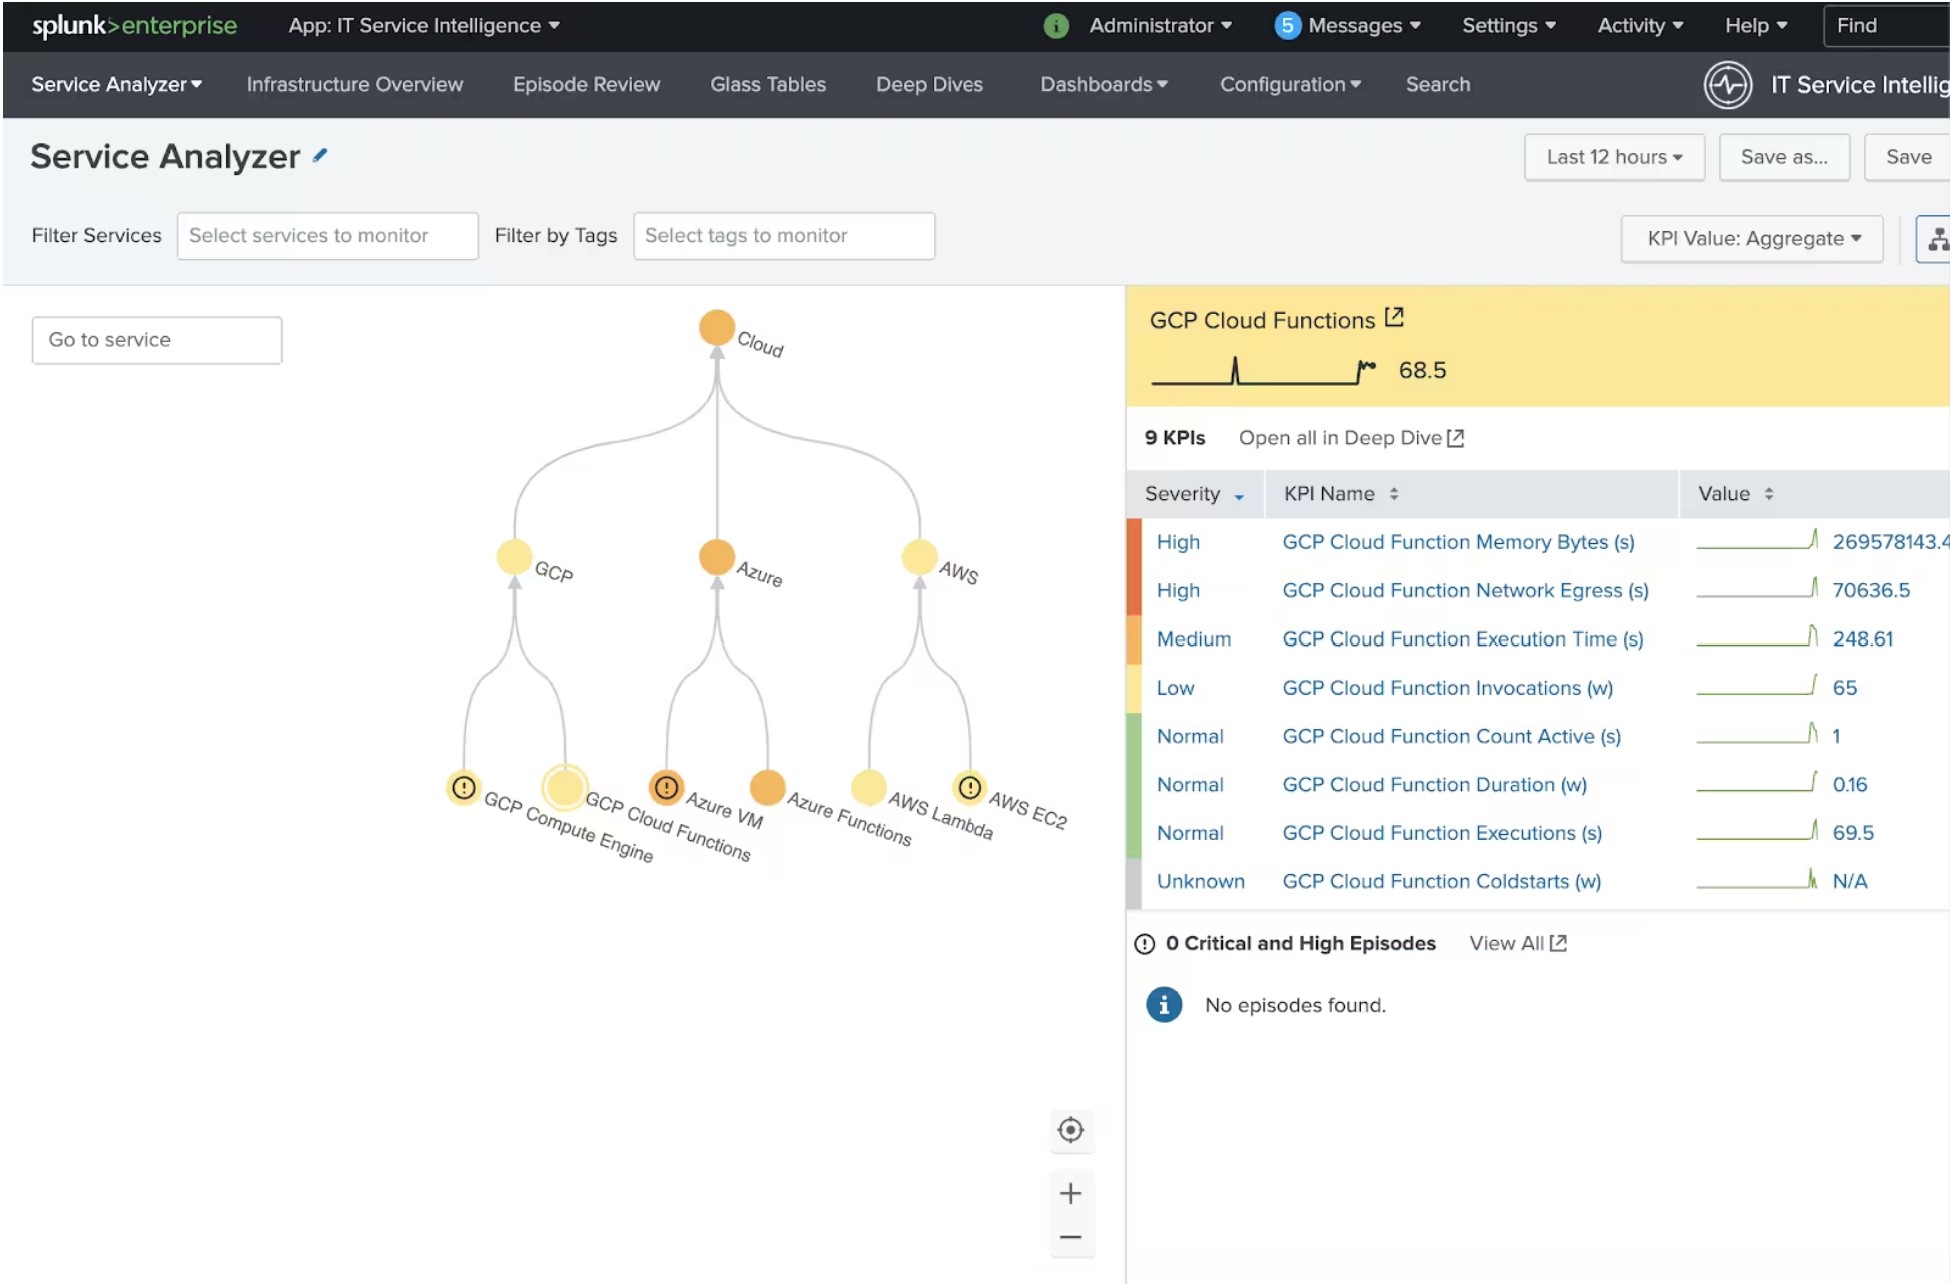
- The Service Analyzer provides an overview of ITSI service health scores and KPI search results that are currently trending at the highest severity levels.
- Automatically refresh the Service Analyzer. itsi_service_analyzer.conf file at $SPLUNK_HOME/etc/apps/SA-ITOA/local
- Filter the services and KPIs in your environment using the Filter Services, Filter KPIs, and
Filter by Tags boxes.
- Filter by Services
- Filter by KPIs
- Filter by Tags
Monitor KPI’s
- Click on any of the service tiles, will open KPI for respective services.
Grey KPI tiles indicate one of the following conditions:
- The KPI search has returned no data matching the search criteria. The sparkline is flat in this case.
- The KPI is associated with a disabled service (when the Show disabled service(s) check box is checked).
- The KPI is associated with a service in maintenance mode
Next Chapter: KPIs