MyObservability
Anomaly detection
IT Service Intelligence (ITSI) anomaly detection uses machine learning algorithms to model KPI behavior and generate alerts when a KPI deviates from an expected pattern. If the KPI diverges from the normal pattern, ITSI creates a notable event in Episode Review.
ITSI provides two anomaly detection algorithms that learn KPI patterns continuously in real time, and detect when a KPI departs from its own historical behavior.
Anomaly detection algorithms
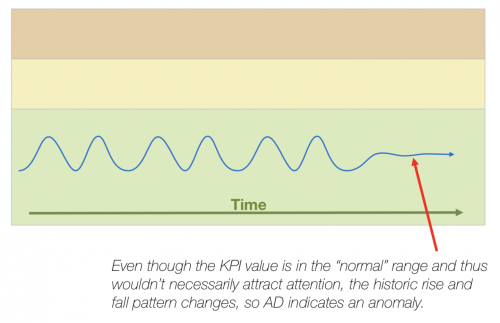
- Trending algorithm: Identifies anomalies based on the trend of the time series data. It looks for deviations from the expected trend or pattern of the data, rather than comparing values to a fixed threshold or baseline.
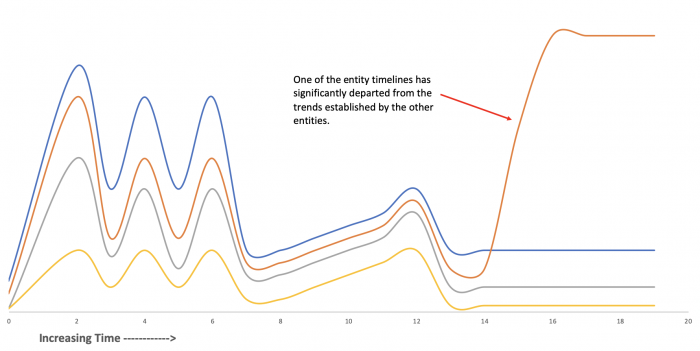
- Entity cohesion algorithm: Entity cohesion analysis detects anomalous patterns in multiple time series simultaneously. The group of entities the algorithm monitors is assumed to have similar, or “cohesive”, behavior and patterns.
Note:
- Anomaly detection requires Java 8 - 11 to be installed on all search heads running ITSI.
- It can take up to 24 hours for anomaly detection to begin generating events. You can then open an event in a deep dive to perform root cause analysis.
Investigate anomalous events in a deep dive
You can drill down to a deep dive from any anomalous notable event. This lets you view the event over a default 10 minute time range, and perform root cause analysis in the context of other service KPIs
Note:
- The Entity Cohesion algorithm supports a maximum of 30 entities per KPI. Recommended not to exceed 30. You can lower the maximum number of entities. $SPLUNK_HOME/etc/apps/SA-ITSI-MetricAD/local/
- Increase anomaly detection memory requirements. By default, anomaly detection reserves 1GB of memory, which is enough for up to 1000 KPIs for trending analysis or up to 1000 metrics for cohesive analysis. To support more than this, increase the Heap memory size in SA-ITSI-MetricAD/local/command.conf on your search heads. Trending anomaly detection requires about 600MB per 1000 KPIs.