MyObservability
Get data into Splunk Observability Cloud
Observability Cloud to achieve full-stack observability of all your data sources
Below high-level overview of your options for getting data from each layer of your stack into the Splunk Observability Cloud product best suited to provide insights about your system.
- Infrastructure
- Integrate with Cloud services
- Configure servers and clusters
- Configure 3rd party server applications
- Application Monitoring (APM)
- Instrument custom-built applications
- Instrument serverless function
- Configure app and function instrumentations to send custom data
- Real User Monitoring (RUM)
- Instrument user interfaces
- API
- Use the API to send custom data
You can send data into Splunk Observability Cloud from a number of sources. You can configure integrations to collect metrics, logs, and spans from your infrastructure and services
- OTel Collector to connect to cloud services such as AWS, Azure. And also collect telemetry data from linux & windows hosts and services such as kubernetes
- Client libraries specific to languages Business related metrics from application & services.
- Integrations such as connecting to Cloud services.
Note: AWS PrivateLink lets you secure your traffic from your AWS environment to your Observability Cloud environment without exposing the traffic to the Internet. For many customers this will also reduce latency and network expenses.
- API Token (User token) - Retrieve data, use programmatic APIs.
- RUM Token - Send RUM data from a web page.
- Ingest Token (Org token) - Send streaming metrics, traces and other data for ingestion.
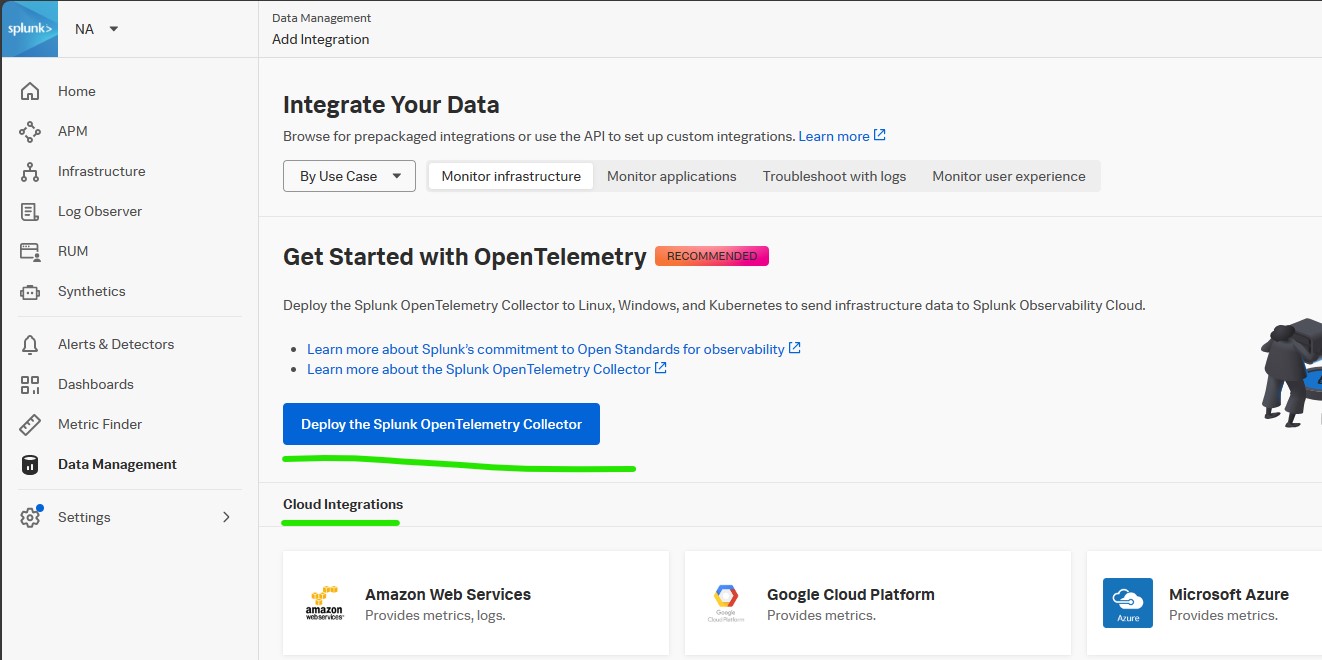
Get data in - Overview
- Integrate with cloud services to send metrics and logs
- Guided setup (AWS, Azure, GCP)
- Using API (AWS, Azure, GCP)
- Using Terraform (AWS, Azure, GCP)
- Install the OpenTelemetry Collector to send server and cluster data
- Use wizard to install (Windows, Linux, Kubernetes cluster)
- Manual installation (Windows, Linux, Kubernetes cluster)
- Configure third-party server applications to send metrics, logs, and traces
- After you’ve completed step 2. Install the OpenTelemetry Collector to send server and cluster data and installed the Splunk Distribution of OpenTelemetry Collector on your servers (hosts) or in your clusters, configure the Collector’s native receivers or any of these third-party applications, such as Apache, Cassandra, Hadoop, Kafka, and NGINX, to monitor your systems.
- Instrument back-end services and applications to send traces, logs, and metrics
- Instrument Java applications
- Instrument Python applications
- Instrument Node.js applications
- Instrument .NET applications
- Instrument Go applications
- Instrument Ruby applications
- Instrument PHP applications
- Instrument serverless functions to send traces and metrics
- Use client libraries (Same as step 7)
- Instrument user interfaces to send user sessions
- Instrument browser-based web applications for Splunk RUM.
- Instrument iOS applications for Splunk RUM.
- Instrument Android applications for Splunk RUM.
- Configure applications and serverless functions to send custom data
- Client libraries for Go
- Client libraries for Java
- Splunk distribution of OpenTelemetry Java
- Client libraries for Java
- Client libraries for node.js
- Client libraries for Python
- Client libraries for Ruby
- Use the Splunk Observability Cloud API to send custom data
- A third-party tool that provides an API/webhook integration only.
- An application written in a language we don’t provide a library for.
Authorization Tokens
All access to Splunk Observability Cloud is secured. Only API calls that present a valid authorization token are permitted. Access can be restricted or segmented by providing different authorization tokens to different teams or products.
Data Sources:
- Cloud Services - AWS, GCP & Azure
- Infrastructure - Amazon ECS EC2, AWS Fargate, Kubernetes, Linux, Windows, Splunk OTel Collector.
- Application & Services - Go, Java, Node.js, Python, Ruby
- Spans & Traces - .Net, Go, Java, Node.js
Installing OpenTelemetry Agent
Ways of installing OpenTelemetry Agent
- Installer script
- Ansible
- Puppet
- Chef
- Salt
- Splunk Add-on (Via Universal forwarder) - Steps
Next Page: Splunk Infrastructure Monitoring
Main Page: Click Here