MyObservability
Get Data Into Splunk - OTel
You need to understand Data Flow in the OpenTelemetry Collector
Data Flow
Pipelines: Central concepts of OpenTelemetry Collector (3 types).
- Metric Pipelines
- Trace Pipelines
- Log Pipelines
Components
A Pipeline is made of components. There are three types of components:
- Receivers: Determine how you’ll get data into the Collector.
- Processors: Once data in the pipeline, Configure which operations you’ll perform on data before it’s exported. For example, filtering, manipulates or extends the data
- Exporters: Set up where to send data to. It can be one or more backends or destinations.
Additional
- Extensions: Extend the capabilities of the Collector.
- Connectors: Send telemetry data between different collector pipelines.
Splunk Collector Components - list
Example:
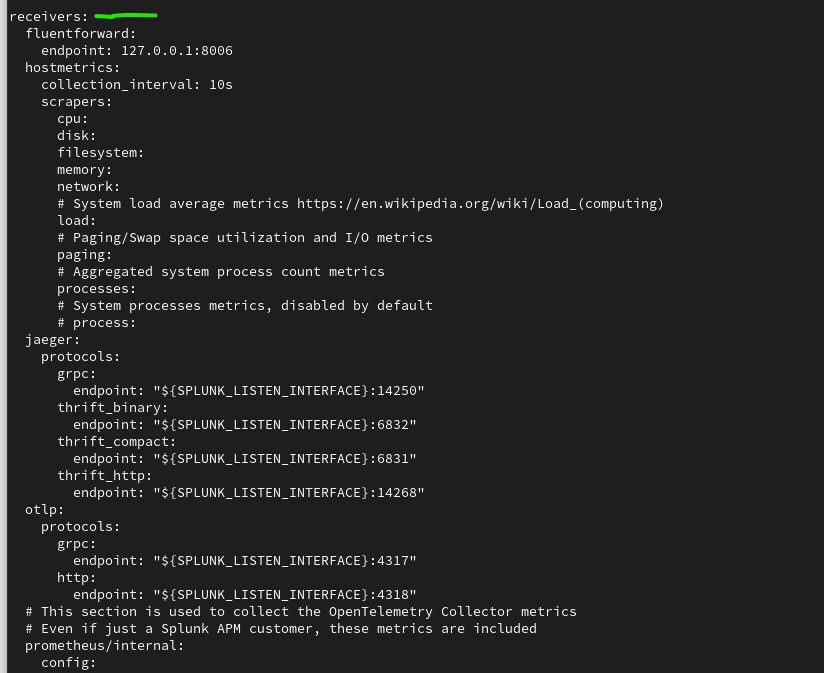
receivers:                       \\ gather data from various sources
  hostmetrics:                   \\ Collects host-level metrics, such as CPU, memory, and disk usage, at a specified interval.
    collection_interval: 60s     \\ interval between metric collections
    scrapers:                    \\ Defines the specific metrics to collect
      cpu:
      load:
      memory:
      disk:
      filesystem:
      network:
  otlp:                          \\ The OpenTelemetry Protoco receiver gathers metrics, traces, and logs sent in OTLP format.
    protocols:                   \\ data transmission protocols
      grpc:
      http:
processors:                      \\ Processors are components that modify or enhance data after it’s received and before it’s sent to an exporter.
  batch:
    timeout: 5s
    send_batch_size: 1024
  memory_limiter:
    limit_mib: 500
    spike_limit_mib: 200
  resource:                      \\ Adds or modifies resource attributes (metadata) that are associated with all collected data.
    attributes:
      - key: environment
        action: insert            \\ Insert, Update, upsert, delete, hash & extract
        value: production
      - key: service.name
        value: my-application
exporters:                        \\ Exporters send processed data to a specified backend or observability platform, such as Splunk.
  splunk_hec:
    token: "<your-splunk-hec-token>"
    endpoint: "https://ingest.<your-splunk-cloud-instance>.splunkcloud.com:8088"
    source: "otel-collector"
    sourcetype: "_json"
    index: "main"
service:                          \\ The service block is where the previously configured components (extensions, receivers, processors, exporters) are enabled within the pipelines.
  pipelines:                      \\ Each pipeline is a distinct data processing path within the collector
    metrics:
      receivers: [hostmetrics, otlp]
      processors: [batch, memory_limiter, resource]
      exporters: [splunk_hec]
    traces:
      receivers: [otlp]
      processors: [batch, memory_limiter, resource]
      exporters: [splunk_hec]
Install & Configure the OpenTelemetry Steps
- Install the OpenTelemetry Collector to send server and cluster data (For Infra only)
- Deploy Splunk Distribution of the OTel Collector
- (Optional) Configure third-party server applications to send metrics, logs, and traces
- Configure the Collector’s native receivers or any of these third-party applications, such as Apache, Cassandra, Hadoop, Kafka, and NGINX, to monitor your systems
- Instrument back-end services and applications to send traces, logs, and metrics (For Infra & APM)
- Edit the Configuration File – insert processor into pipeline
- Restart the OTel Collector
- Verify that the new dimension is being sent
Step-1: Install the OpenTelemetry Collector to send server and cluster data
Install the Splunk Distribution of OpenTelemetry Collector using the method that best suits your environment:
- Use a wizard to install
- Manually install
For Linux/Windows
- Data Management -> Add Integration -> Deploy the Splunk OpenTelemetry Collector
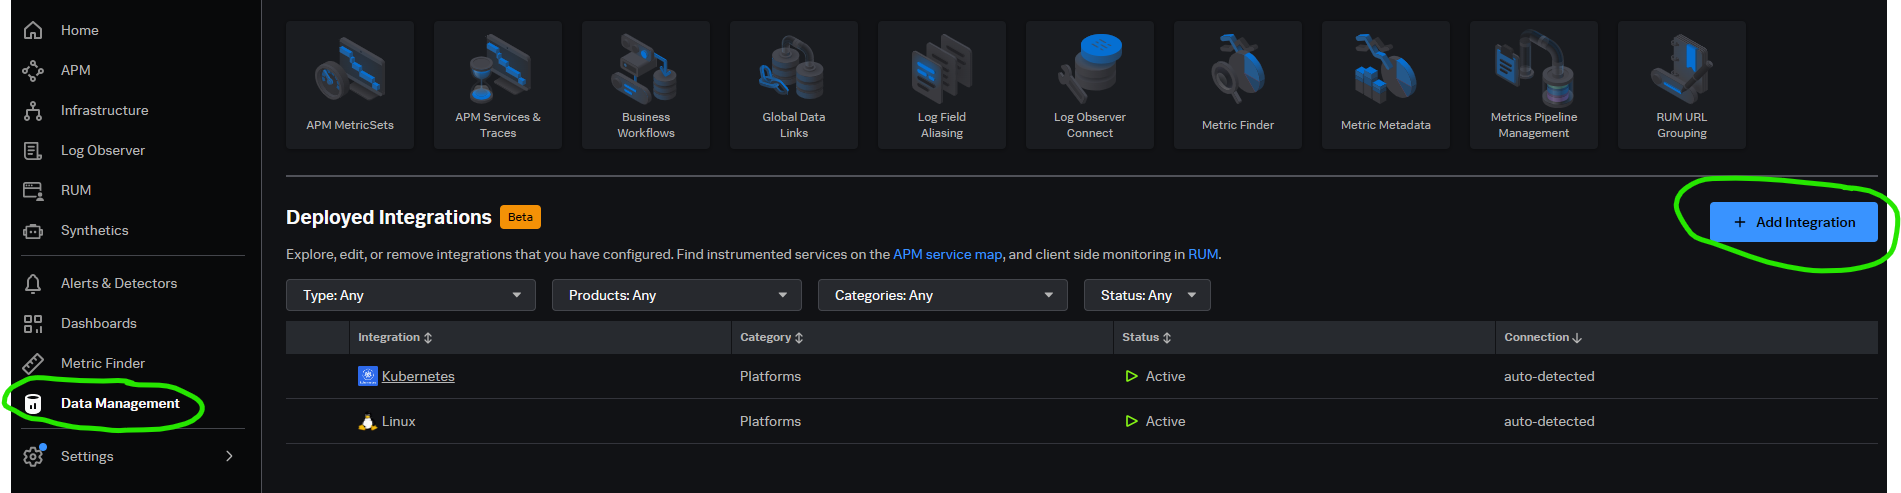
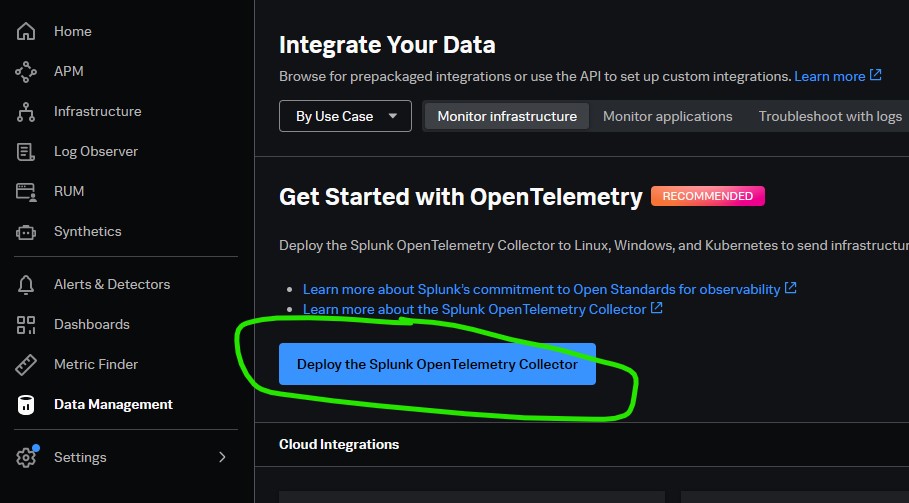
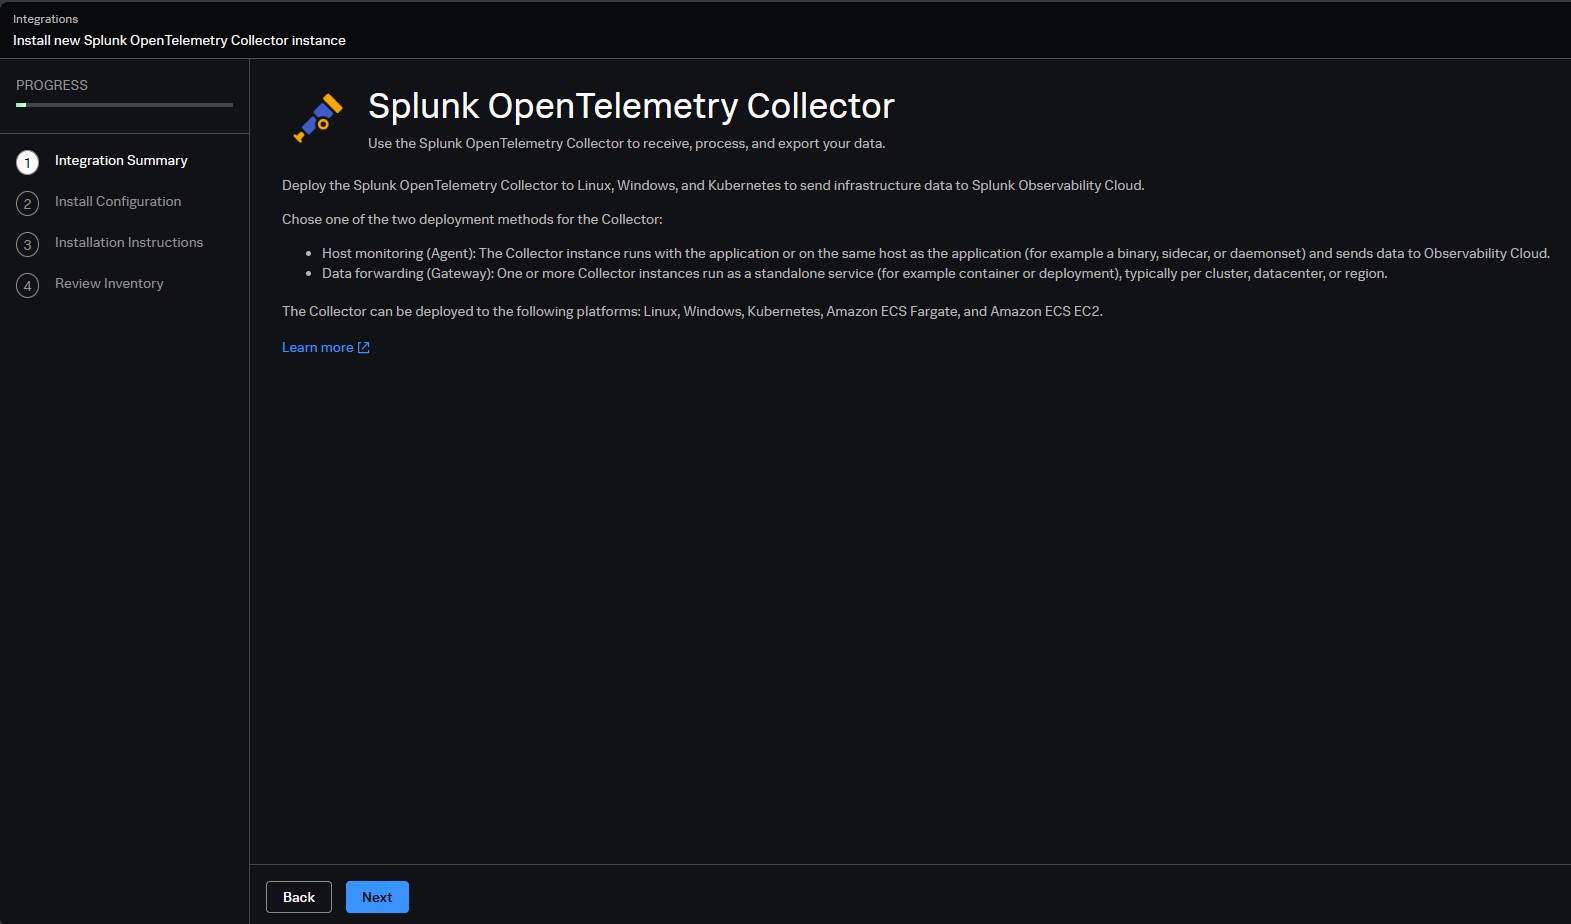
- Click “Next”
- Select Platform
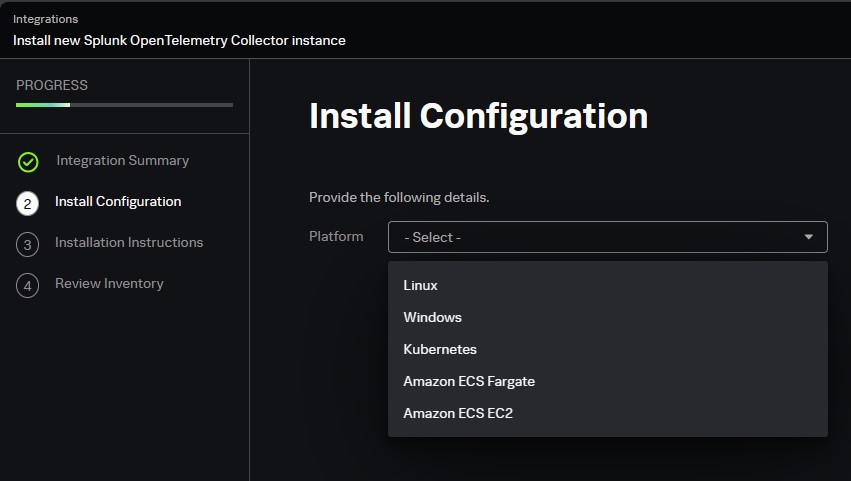
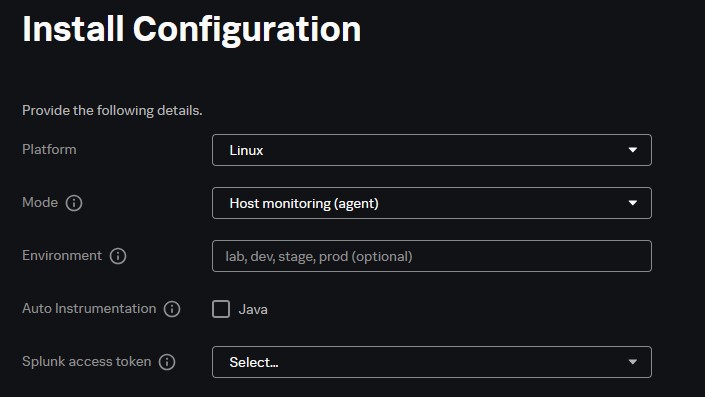
- Install Configuration - Automatically populates depend on platform.
Linux:
Kubernetes:
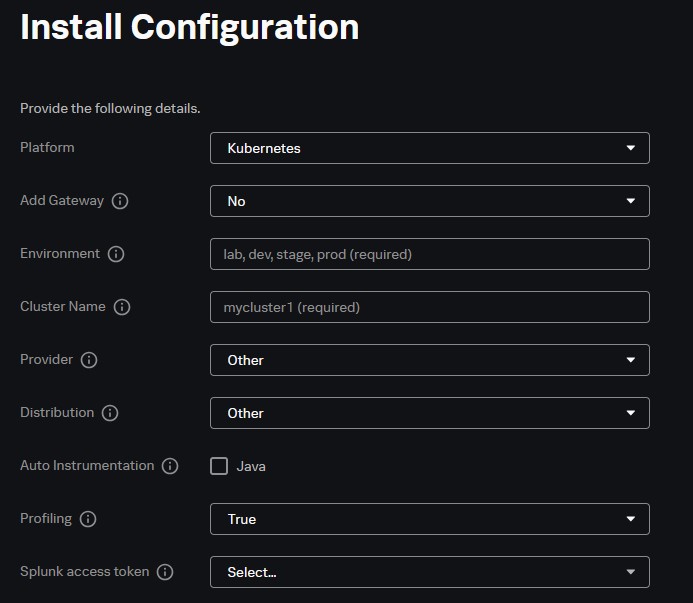
Provide all necessary details.
- Follow Installation Instructions and select the technology (Script/Ansible/puppet/Chef/salt) according to your requirement.

- Check that data is coming into Splunk Observability Cloud.
Step-2: (Optional) Configure third-party server applications to send metrics, logs, and traces
Configure the Collector’s native receivers or any of these third-party applications, such as Apache, Cassandra, Hadoop, Kafka, and NGINX, to monitor your systems
Step-3: Customizing the Agent Configuration File
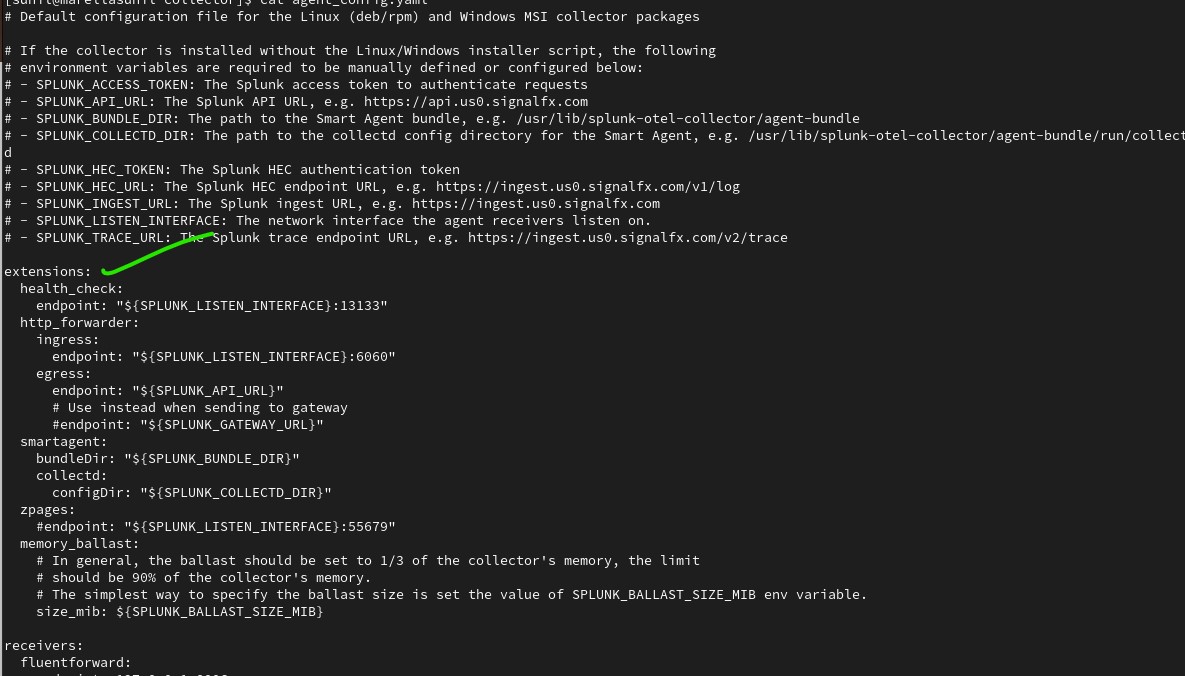
- /etc/otel/collector/agent_config.yaml: The default configuration file for the Splunk OpenTelemetry Collector.
- /etc/otel/collector/splunk-otel-collector.conf: The environment file with the required variables/values for the Splunk OpenTelemetry Collector service based on the specified parameters.
Steps to add a component to a pipeline in the OpenTelemetry Collector
- First, you must create a block to define the component, and set any configurable options. Defining a component does not enable it – but it makes it available for you to use in a pipeline.
- To enable a defined component, place it in a pipeline. You can re-use the same defined component in multiple pipelines. You can also define the same component more than once, with different configurations.
Example 1:
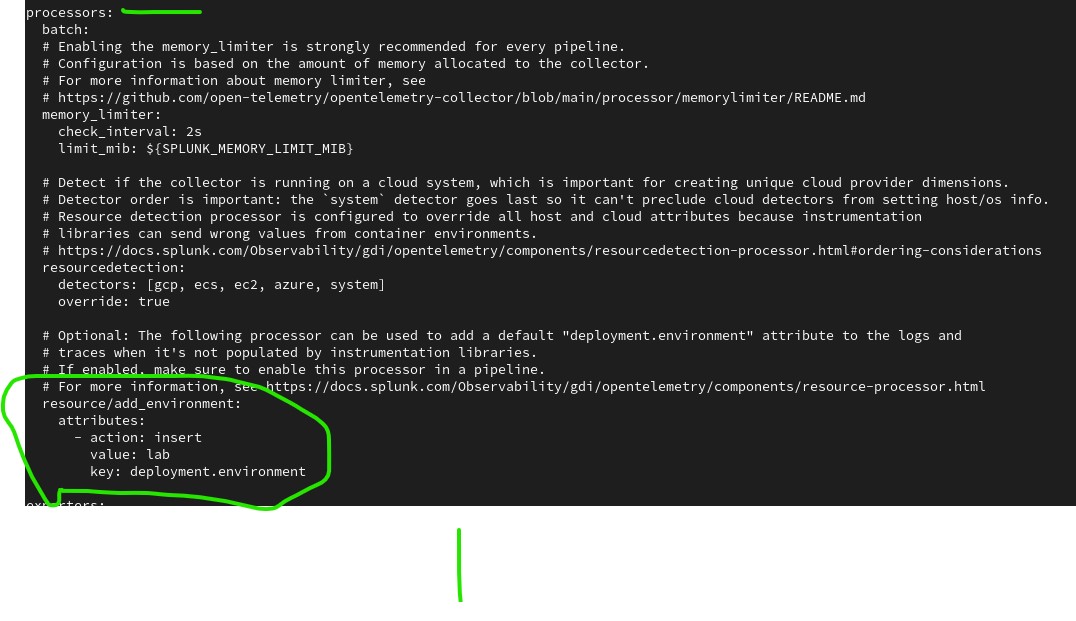
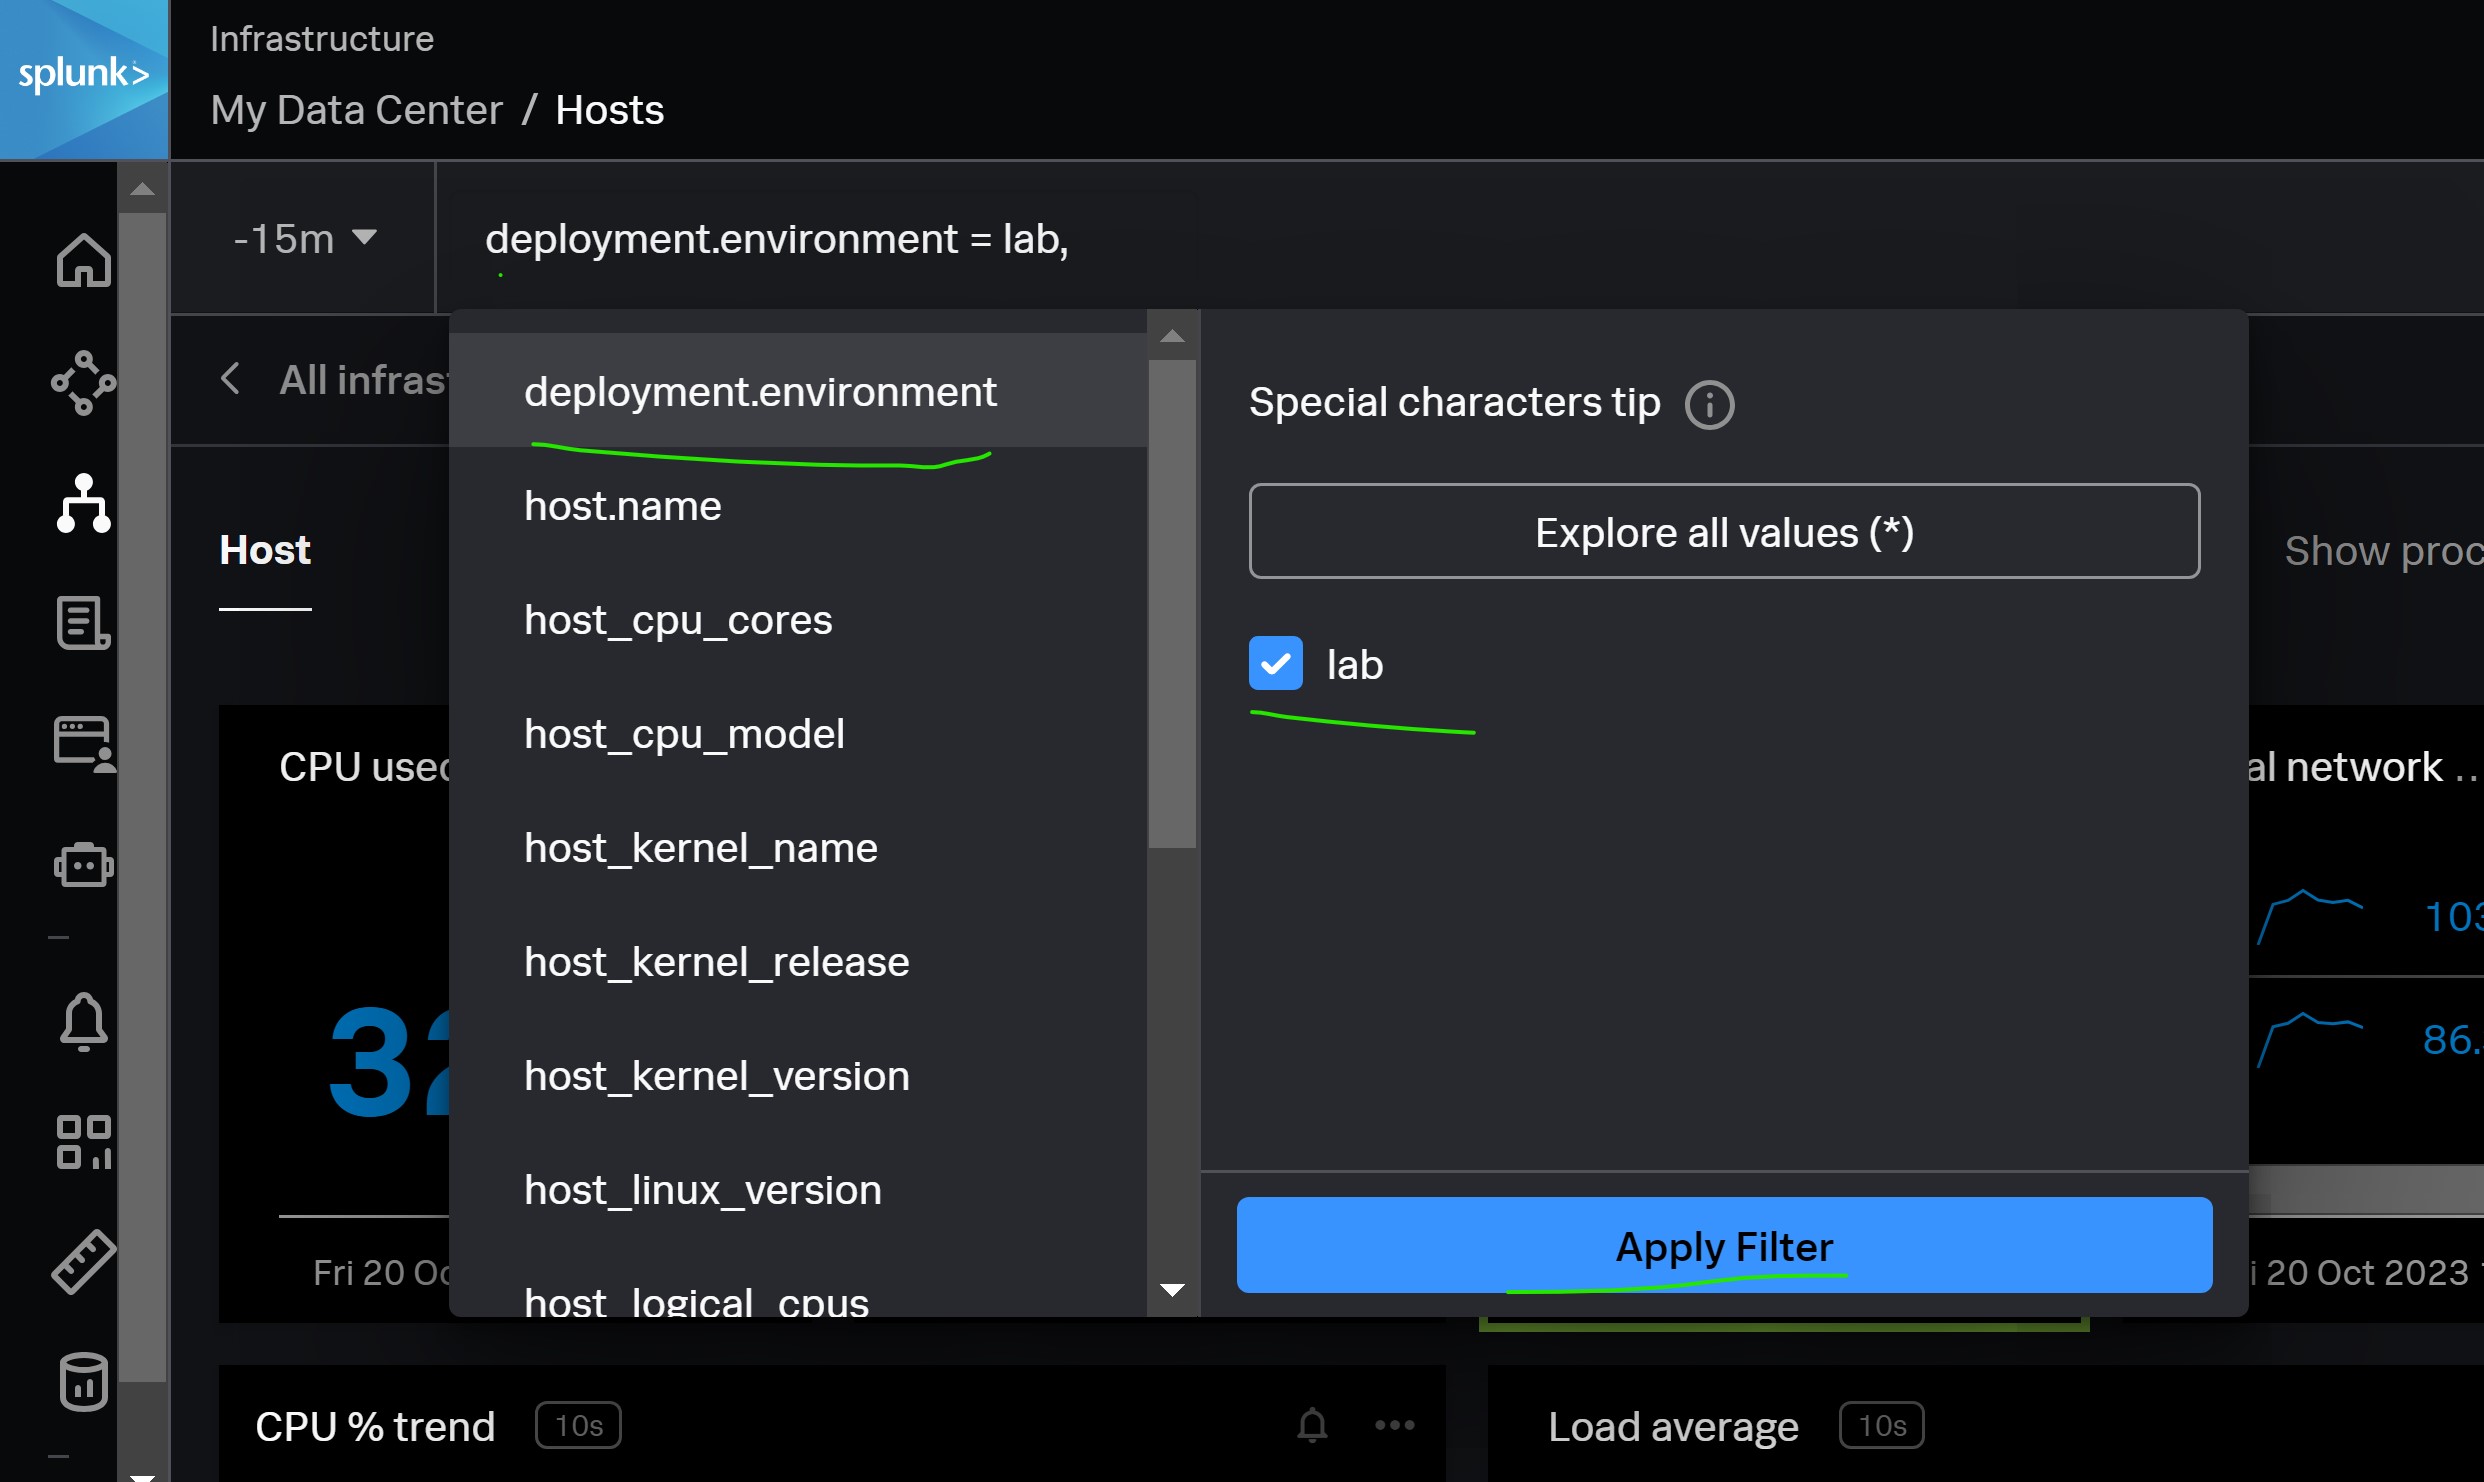
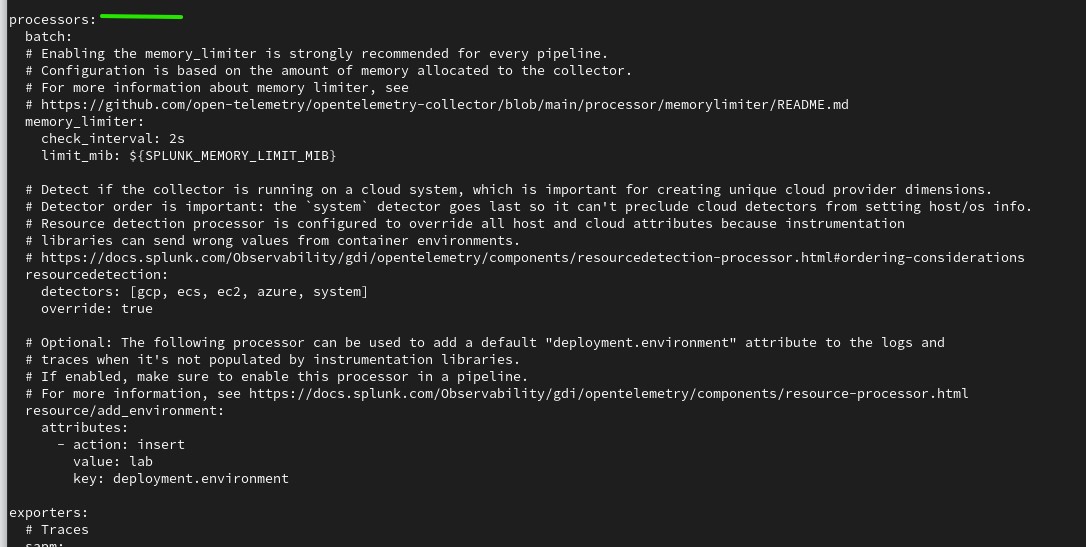
- Add a new processor of type resource with the label add_environment.
- The processor must be under the processors block
- Give the new processor a label: resource/add_environment
- Configure the processor to add a new dimension as follows:
- action: insert
- key: deployment.environment
- value: < use your name>
Note that this will be under attributes for the processor.
Task 2: Edit the Configuration File – insert processor into pipeline
- Add the processor into the list of processors in the default (unlabeled) metrics pipeline (service > pipeline > metrics > processors).
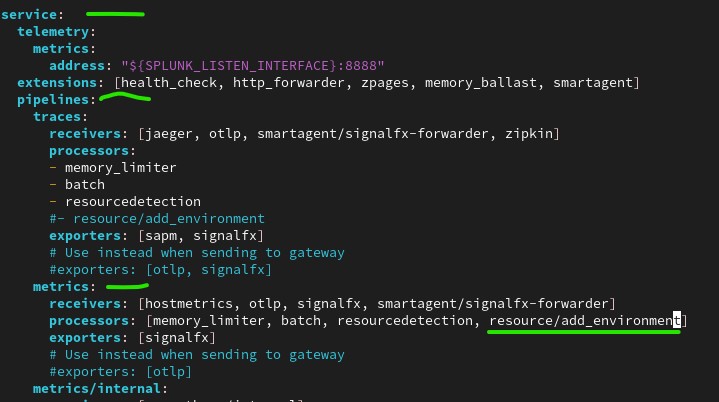
- Save the file.
Example 2:
- To mask sensitive data:
processors:
  resources/mask_username:
    attributes:
      - action: hash
        key: username
- Add processor components to pipeline
service:
   pipeline:
      metrics:
         receivers:
         processors:
         - resources/mask_username  # Add processor to pipeline.
         exporters:
- Restart collector.
Step-4: Restarting Splunk OTel Collector
sudo systemctl restart splunk-otel-collector
Step-5: Verify that the new dimension is being sent
Troubleshooting
Troubleshooting Common Issues
- Supported operating system/platform
- mistakenly setup Agent Vs Gateway mode
- Process status systemctl status splunk-otel-collector
- Install errors Insufficient permissions, out of system resources, network connections (firewall)
-
Network connectivity - If the agent process is running, check that you can connect to Splunk Observability Cloud servers. You must be able to send data to the ingest API.
curl -o - -I https://ingest.<realm>.signalfx.com/v2/datapointThe curl command will check that the endpoint is reachable, but it does not check that your account is properly configured
- Agent startup logs - system journal for log messages
journalctl -t otelcol -r
Nore options:
Uninstalling the agent
sudo sh /tmp/splunk-otel-collector.sh --uninstall
Customizing the Agent Configuration File
Pipeline Direct the Data Flow
- Receiver: Get data into the Collector from multiple sources.
- Processor: Perform operations on data before it’s exported. For example, filtering. Once in the pipeline, processor components filters, manipulates or extends the data.
- Memory Limiter: Prevent out of memory situation on the collector. It restricts the data processed so that the collector process stays within its memory limitations.
- Batch Processor: It accepts trace spans, metrics or logs places them to batches. Batching helps better compress the data and reduce the number of outgoing connections required to transmit the data.
- Resource Detection: It enhance telemetry data with labels that describe the underlying host machine.
- Exporter: Send data to one or more backends or destinations (Ex: Splunk Observability Cloud).
- Extensions: Extend the capabilities of the Collector.
Configuration files
/etc/otel/collector/agent_config.yml
Pipelines are defined in the service block of the configuration file. The code above defines a metrics pipeline.
- Extension block
- Receivers block
- Processors block
- Exporter block
- Service block
Extension block
Extend the capabilities of the Collector
Receivers block
Processors block
Exporter block
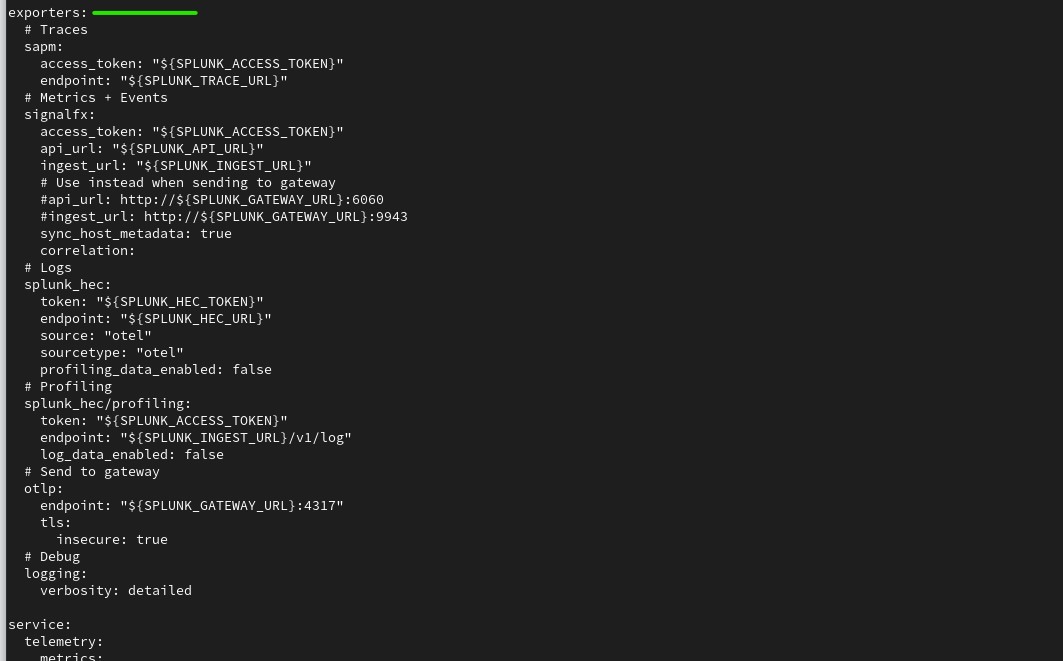
Service block
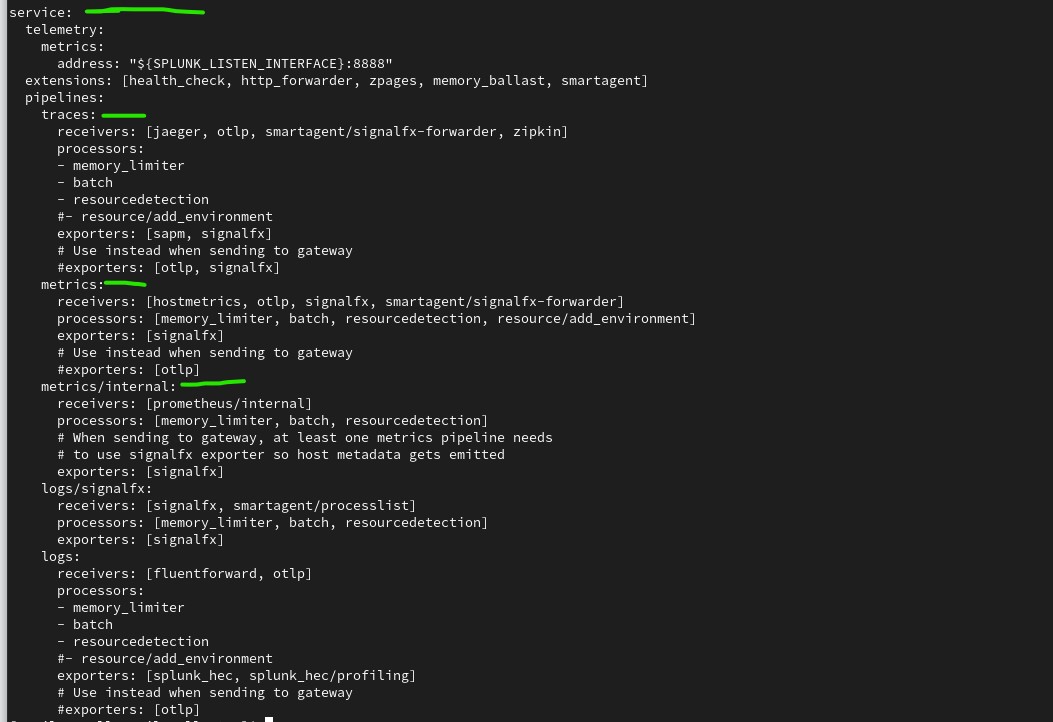
Service block contains diffferent pipelines
- traces: Pipeline for “traces”. This is forwarding pipeline
- metrics: Pipeline to handle metrics.
- metrics/internal: Pipeline to handle internal metrics.
- logs: This is forwarding pipeline
- logs/signalfx:
/etc/otel/collector/splunk-otel-collector.conf
It contains environment variables of our installations.
AlwaysOn Profiling
About Profiling/ AlwaysOn profiling refer doc.