MyObservability
Data types in Splunk Observability Cloud
Metrics - Is a measurement about a data source (host, application) that varies over time.
- Metric and their metadata are stored in data point, which are then collected in metric time series.
- Metadata includes dimensions, custom properties, tags, and attributes.
- Observability Cloud also produces its own org metrics (ingest, App usage, integration, resource) to help you understand how it’s performing. Reference
- Ingest metrics: Measure the data you’re sending to Infrastructure Monitoring.
- App usage metrics: Measure your use of application features, such as the number of dashboards in your organization.
- Integration metrics: Measure your use of cloud services integrated with your organization.
- Resource metrics: Measure your use of resources that you can specify limits for, such as the number of custom metric time series (MTS) you’ve created.
Events - Context added to metric data. Events are very basic. You can’t apply analytic functions to events, but you can plot them based on their metadata.
- Ex : Events are created whenever a detector triggers an alert. A second event is created when the alert clears, is manually resolved, or is stopped due to the detector being edited or deleted.
Traces and spans - A collection of operations, known as spans, that represent a unique transaction an application handles.
Logs - Automatic, time-stamped record of a relevant event or activity. Log ingestion is configured for each feature.
Metrics, data points, and metric time series
In Splunk Observability Cloud, metric data consists of a numerical measurement called a metric, the metric type, and one or more dimensions. Each piece of data in this form is a data point.
A metric time series (MTS)
MTS contains all the data points that have the same metric name, metric type, and set of dimensions. Observability Cloud automatically creates MTS from incoming data points.
Ex:
Data point 1
name - cpu.utilisation
type - gauge
value - 85
Dimensions:
hostname - server1
location - Tokyo
timestamp - 124534534534544
Data point 2
name - cpu.utilisation
type - gauge
value - 75
Dimensions:
hostname - server1
location - Tokyo
timestamp - 124534534534544
Data points
A data point contains a metric name and value, the type of the metric, and the dimensions of the metric.
Ex: { “gauge” [ {“metric”: “cpu.utilisation”, “dimensions”: { “host”: “host-abc”, “location”: “Tokyo” }, “value”: 85} ] }
Metrics
A metric is a measurable number that varies over time.
Metric type
There are three types of metrics:
- Gauge metrics: Represent data that has a specific value at each point in time. Gauge metrics can increase or decrease. (Rollup: Average)
- Ex: CPU utilization, memory usage, and time spent processing a request.
- Counter metrics: Represent a count of occurrences in a time interval. Counter metrics can only increase during the time interval. (Rollup: sum)
- Sum of values for data points in each interval.
- Ex: Number of requests handled, emails sent, and errors encountered.
- Cumulative counter metrics: Represent a running count of occurrences, and measure the change in the value of the metric from the previous data point. (Rollup: Delta).
- Delta between the values of first point and that of last point in each interval.
- Ex: Number of successful jobs, number of logged-in users
Rollups A statistical function (count, max, min, sum, latest & lag) applied to all data points in a Metric Time Series over a period of time and are applied at the time of ingest.
Metric categories
There are about 20 metric categories in Splunk Observability Cloud. Metric category, especially metrics categorized as custom, can impact billing.
Metric resolution
By default, metrics are processed by Observability Cloud at the coarser of their native resolution, or at 10-second resolution.
Optionally, metrics can be ingested at a higher resolution of 1 second. High-resolution metrics enable exceptionally fine-grained and low-latency visibility and alerting for your infrastructure, applications, and business performance.
- To process a metric at high resolution, set the dimension sf_hires to 1 in any MTS.
Retention
Retention period is officially managed in days since the length of each month is different.
- 1secs - 8 days(Standard plan), 96days (Enterprise /custom plan)
- 10secs, 1min, 5min, 1hr - 416 days/13 months (Standard plan, Enterprise /custom plan)
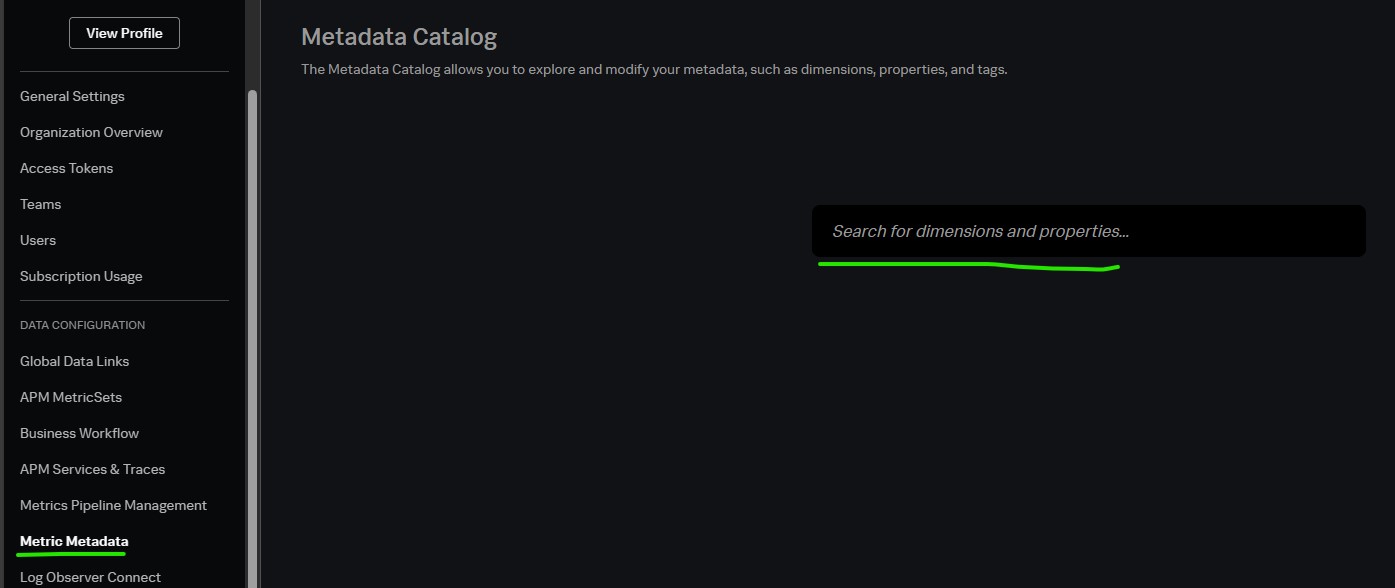
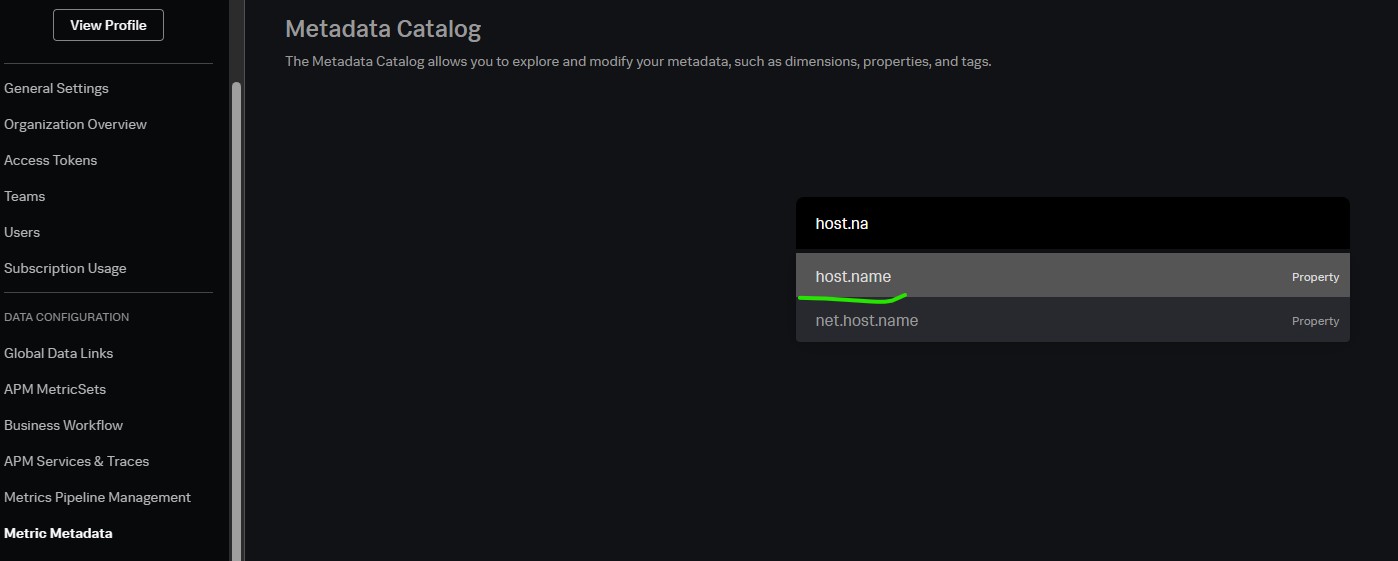
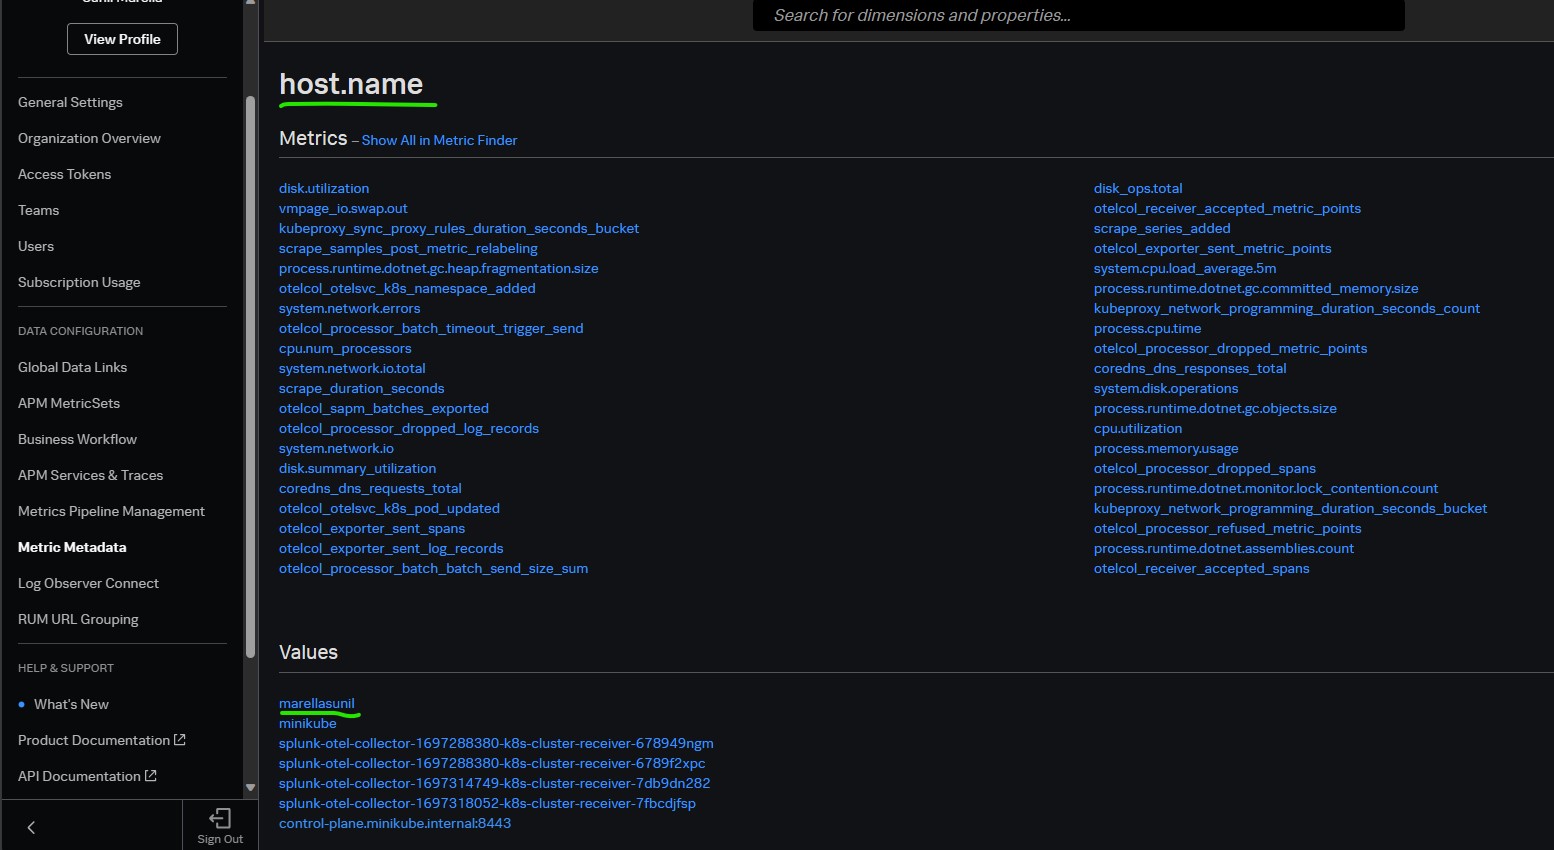
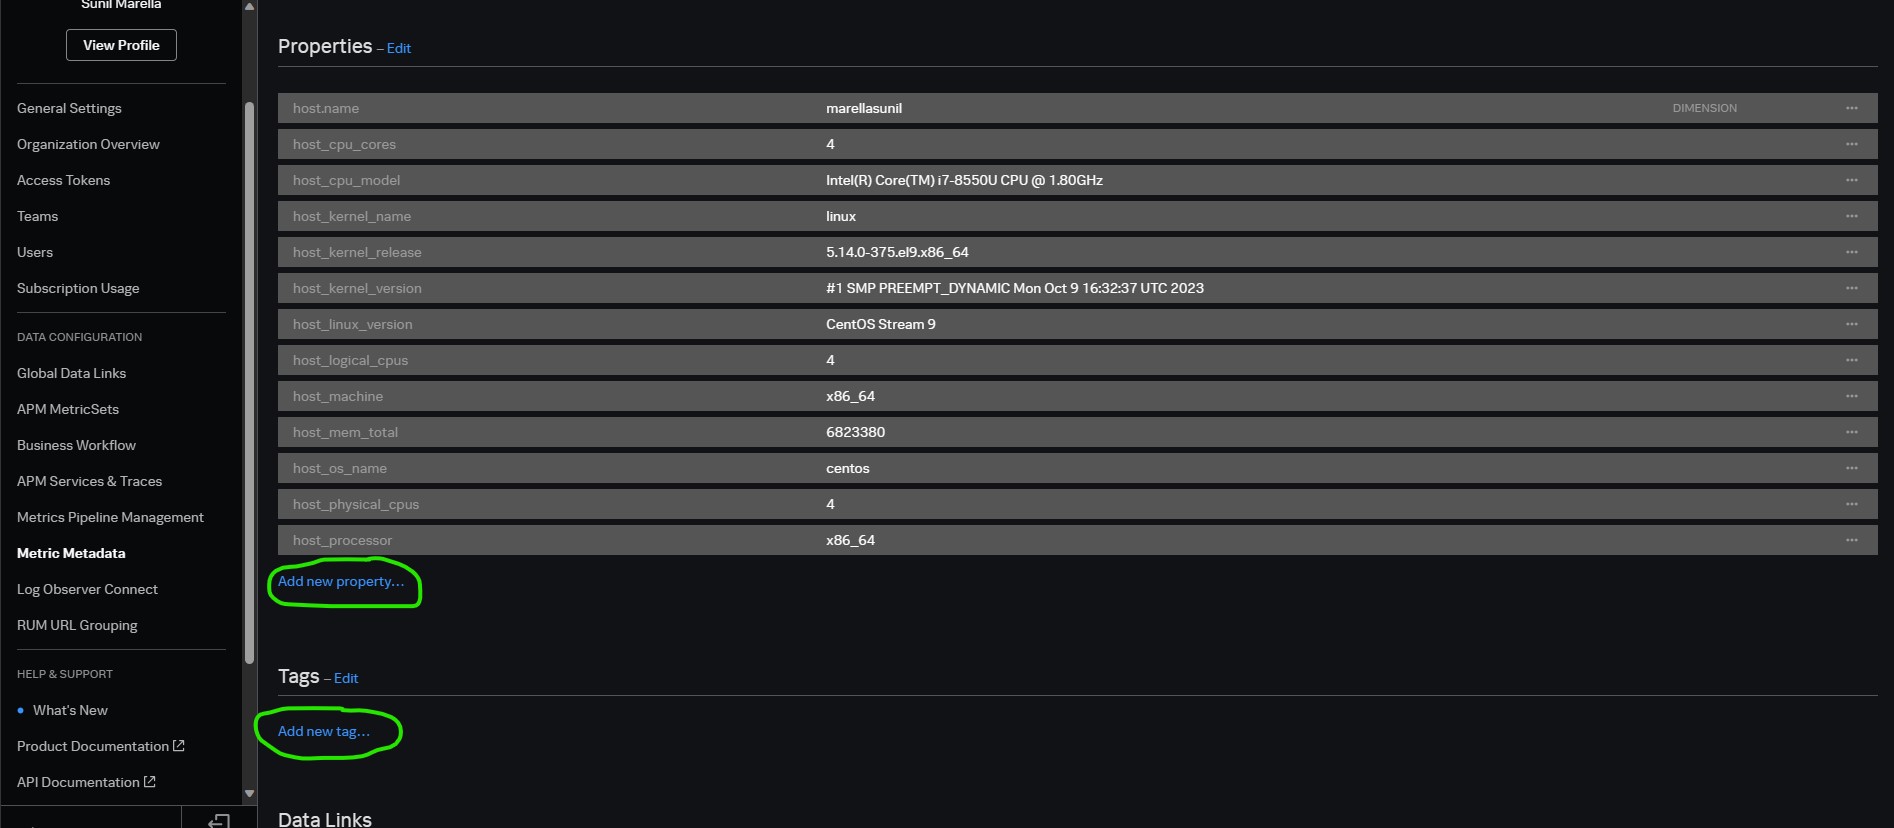
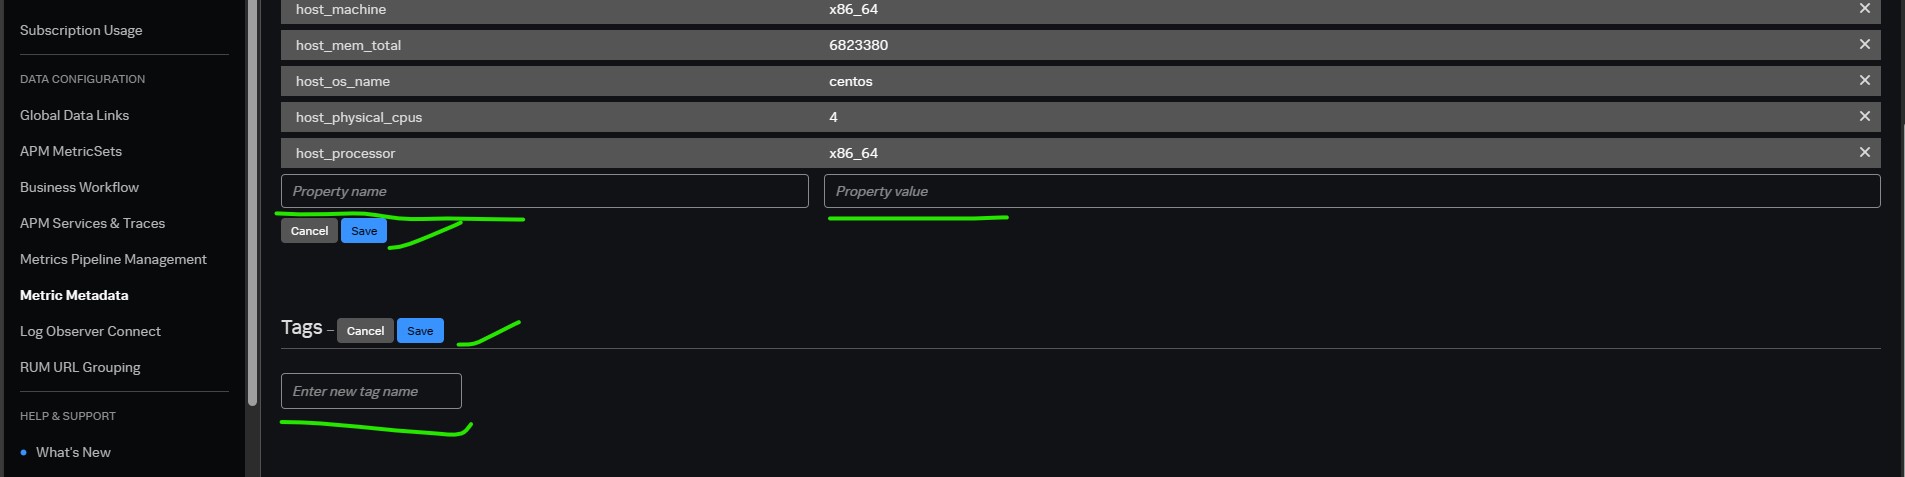
Metric metadata
Metrics can have associated metadata such as dimensions, custom properties, or tags.
- Dimensions: (Infra merics) Sent in with metric time series (MTS) at the time of ingest to add context to metrics. If you change dimension name, a new MTS is created (Broken History).
- Ex: HTTP Method - Get, post, put. Or endpoint - /api/v1/health
- Its a key value pair and can be used to filter or group by.
- Custom properties: (Infra merics) Applied to metric dimensions after ingest to add context to the metrics.
- Ex: aws_intstance_id = xxxx,, ServerName = Splunk-server, OperatingSystem = windows.
- Its a key value pair and can be used to filter or group by.
- Tags: (Infra merics): Labels or keywords applied to metric dimensions and custom properties after ingest to help you categorize them. You can use tags to filter MTSes in charts and detectors using sf_tags.
- Ex: “Error Type” (Database error, Network error etc).
- Its a keyword and can be used to filter.
- Attributes or span tags: (APM, Collector merics, span) Annotation to carry information about the operation being tracked.
- Attributes in OpenTelemetry
- Attributes in Splunk APM: Splunk APM collects incoming spans into traces and analyzes them to give you full fidelity access to your application data. ex: unique_id = bc4t6t8ic5t1tc47t6b46t.
- Attributes in Splunk RUM
Note:
- Properties & tags, Add them once the data is already in Splunk Observability Cloud, If you change properties and tags, it does not result in a new MTS
- Names can not start with _ or sf_ or reserved ters like azure_ etc
- Max 128 charecters.
Creating properties/tags