MyObservability
Splunk Infrastructure Monitoring
Splunk Infrastructure Monitoring provides a simple and comprehensive platform to monitor and troubleshoot your infrastructure and applications. Leverage metrics from any source, at scale and in real-time to detect issues across a spectrum of deployments.
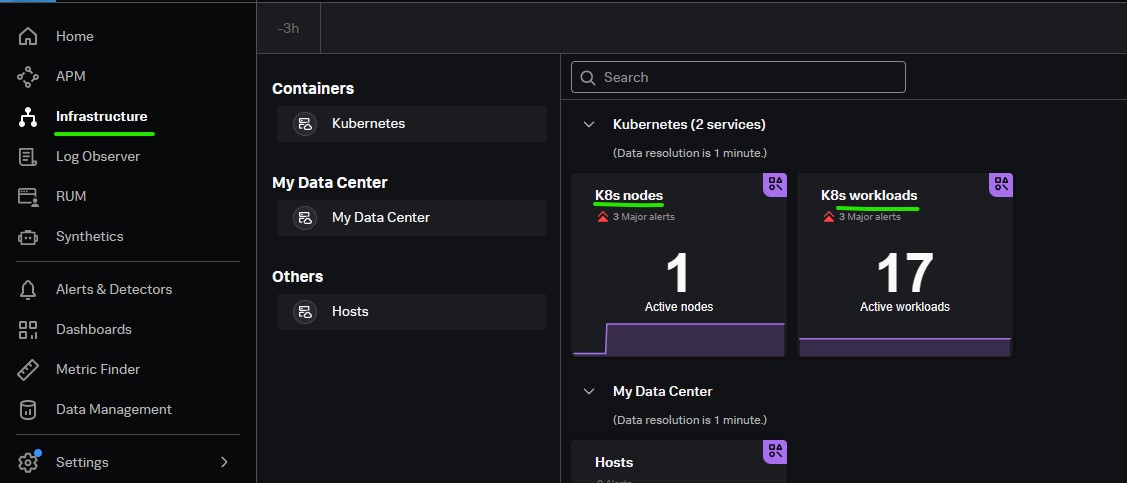
Infrastructure Monitoring Landing Page
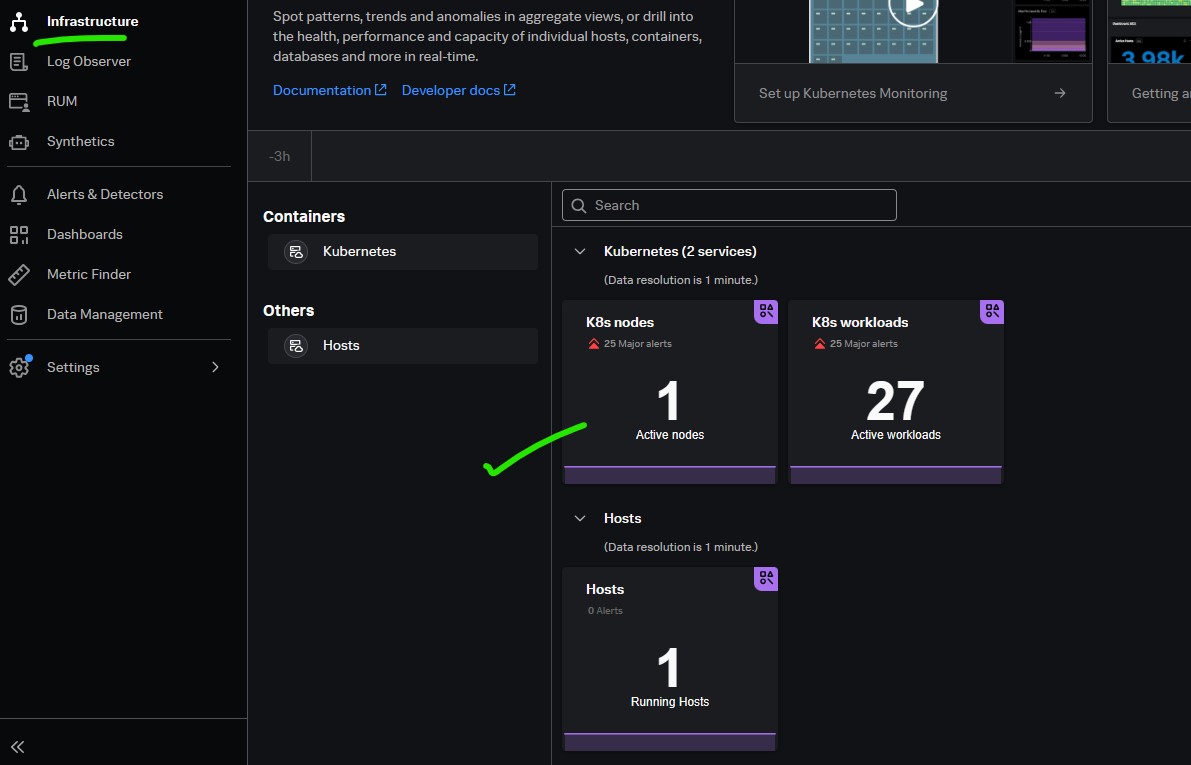
The cards on the landing page correspond to the services you integrate with Splunk Observability Cloud. Click a card to see the navigator for the corresponding service.
Click on the card to see holistic view.
View all your hosts at a glance or drill down to a particular host. 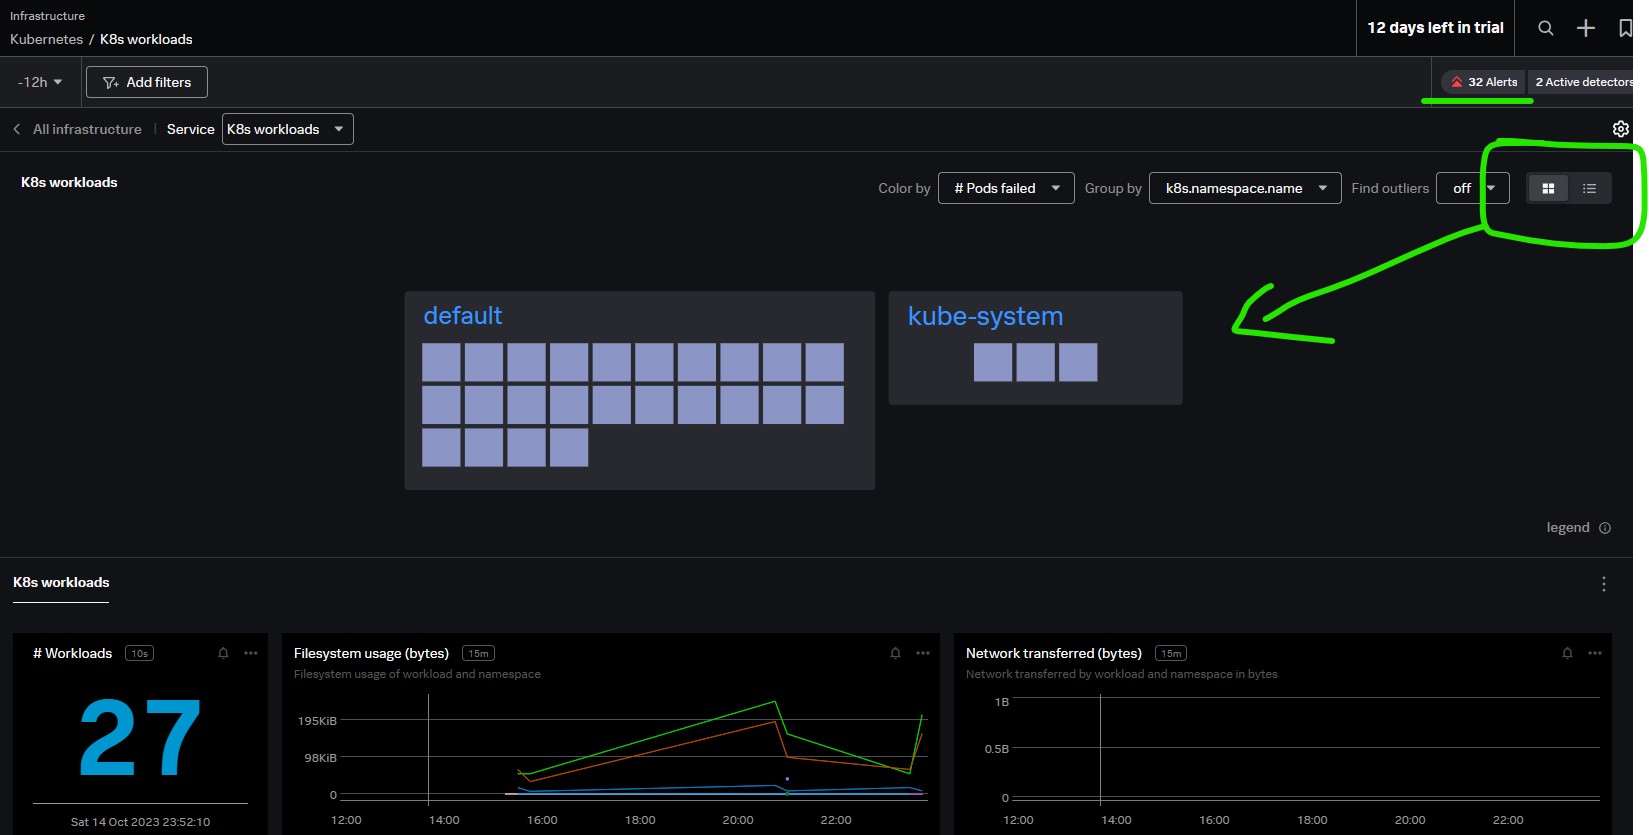
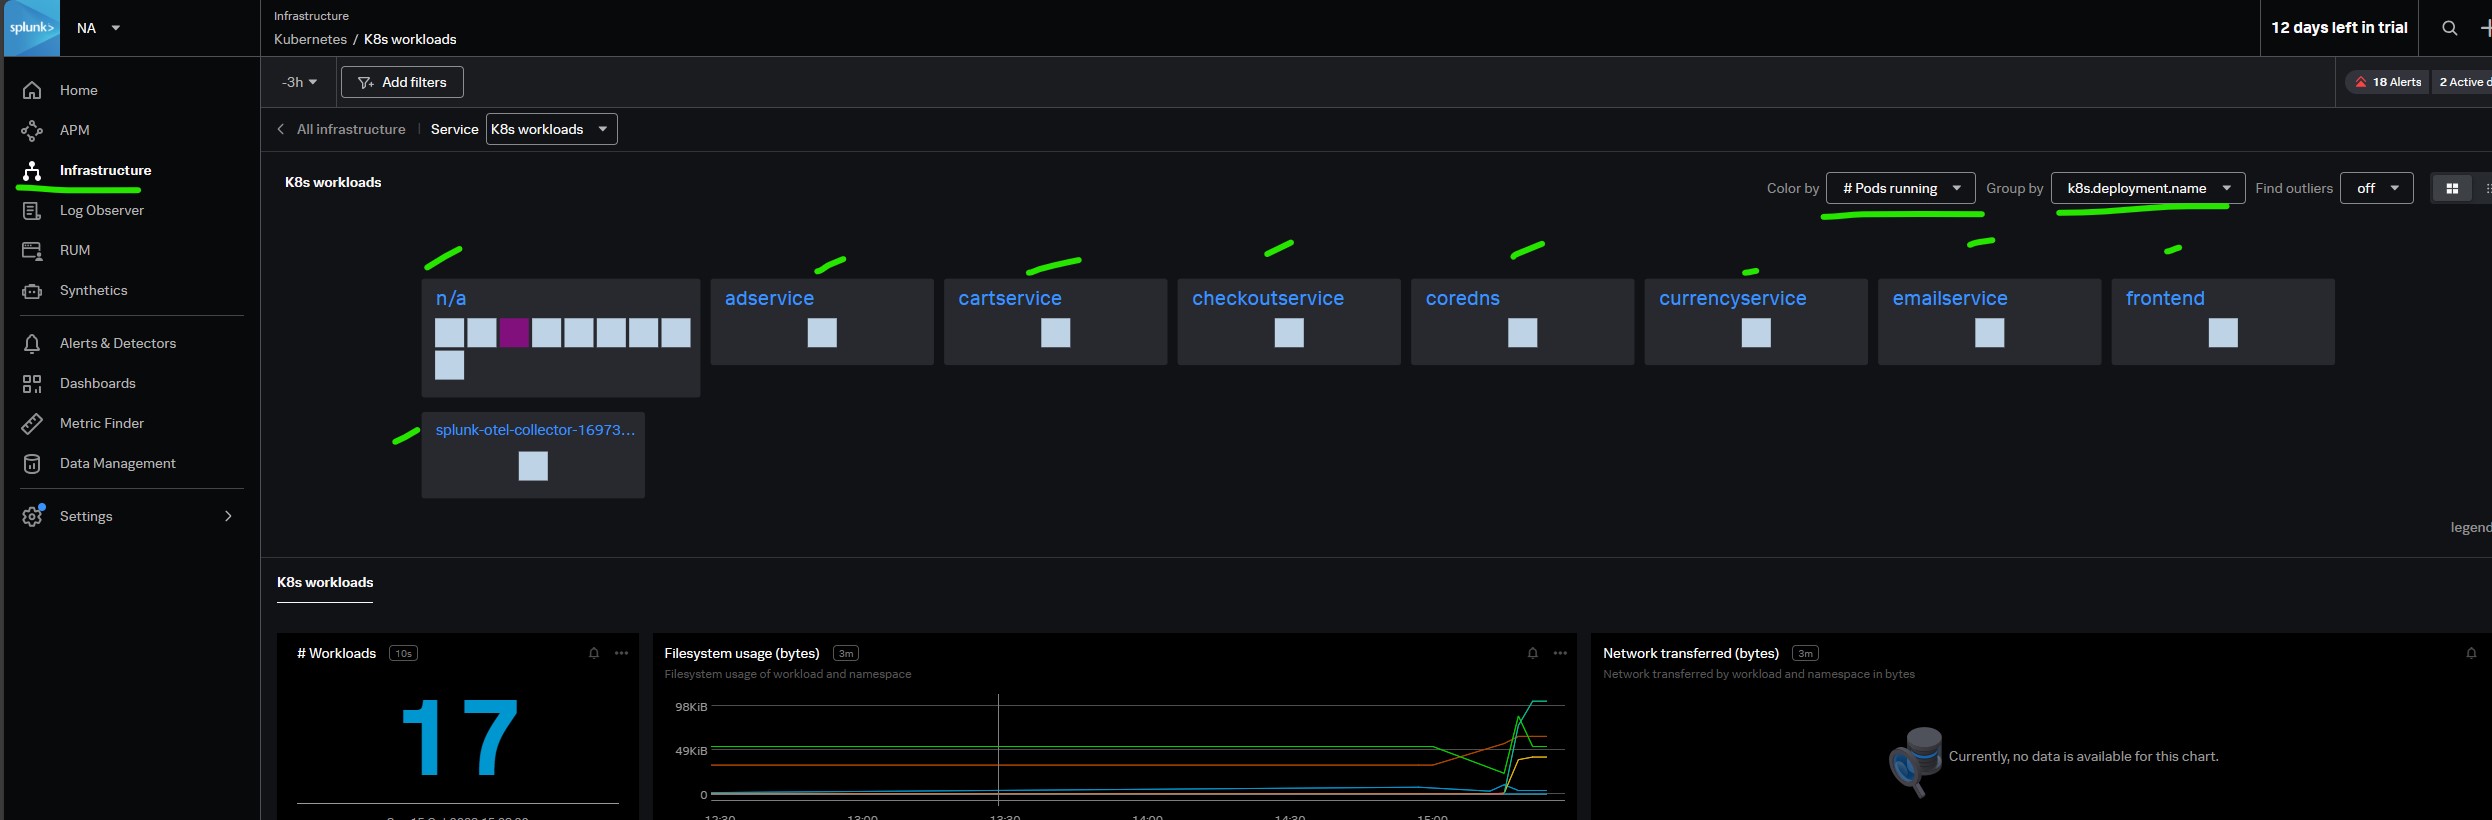
View all your pods based on services (Ex)
You also see any active alerts and detectors for this host. The details panel also gives you more information about the host.

Components of a Data Point
Live Stream Data: Splunk Observability cloud recieves a continuse live stream of datapoints representing metrics from your system and/or applications.
Data Point: A datapoint is a single measurement of a metric at a particular instant in time. It contains
- Metric Type -
- Metric Name - value being sent like cpu.idle, memory.used
- Dimensions - metadata sent in with the data to identify the source of the datapoint and other contextual information. like host:”hostabc01”, datacentre:”dc1” etc
- Value - actual measurement from system as a number.
- Timestamp - Milli seconds since epoch.
Metric Names and Values You can use almost any string for a metric name. The metric name should be descriptive of what the metric measures and include information such as description, units, and/or category.
- Metric description - A brief description, ex: calculate the ninety-ninth percentile of latency (latency.p99)
- Measurement Units - A measuring units (latency.p99.ms)
- Measurement Category - A particular place or area that is relevant to the metric (latency.p99.ms.sensor)
Type of Metrics There are three types of metrics: Gauges, Counters, and Cumulative Counters. The metric type indicates to Splunk IM how the data should be interpreted.
{
    "gauge":                              # Metric Type
        [{"metric:"cpu.idle",             # Metric Name
        "dimensions":                     # Dimensions - host, datacentre etc
            {"host":"hostabc01",
            datacentre:"dc1"},
        "value":249                       # Value
        "timestamp" : 1122234r3453554}]   # Time stamp
        }
Splunk IM has three different types of metadata:
Dimensions: Dimensions are attributes or characteristics that help you categorize and filter metric data. They allow you to group related metric data points together based on shared attributes. Example: Consider a metric for tracking request latency in a web application. You might have dimensions like “HTTP Method” (GET, POST, PUT), “Endpoint” (API endpoint URL), and “Status Code” (200 OK, 404 Not Found). Each data point in the metric is associated with specific values for these dimensions. For example, you can have data points for “GET /api/resource” with a “Status Code” dimension value of “200 OK.”
Properties: Properties are additional metadata associated with a metric that provides descriptive information about the metric itself. They are often used for documentation and to provide context for the metric. Example: For a metric that tracks server CPU utilization, properties might include information about the server, such as “Server Name” (e.g., “WebServer-01”), “Datacenter” (e.g., “US-East”), and “Operating System” (e.g., “Linux”). These properties help users understand which server the metric data is associated with.
Tags: Tags are labels or key-value pairs that can be attached to metric data to add arbitrary metadata or annotations. They are typically used for custom metadata that isn’t covered by dimensions or properties. Example: You have a metric for tracking errors in a distributed application. You can tag specific data points with tags like “Error Type” (e.g., “Database Error,” “Network Error”) and “Severity” (e.g., “Critical,” “Warning”). These tags allow you to quickly filter and query for specific types of errors.
Metric Time Series: A metric time series is a sequence of data points collected over time for a specific metric. Each data point includes the metric value, timestamp, and associated metadata. Example: Suppose you have a metric called “Memory Usage” that tracks the memory consumption of a set of servers. Each metric time series for “Memory Usage” includes data points with values like memory utilization percentage, timestamps (e.g., every 1 minute), and metadata such as the server name and datacenter.
How to use Metadata
- Filtering
- Grouping
Kubernetes Monitoring
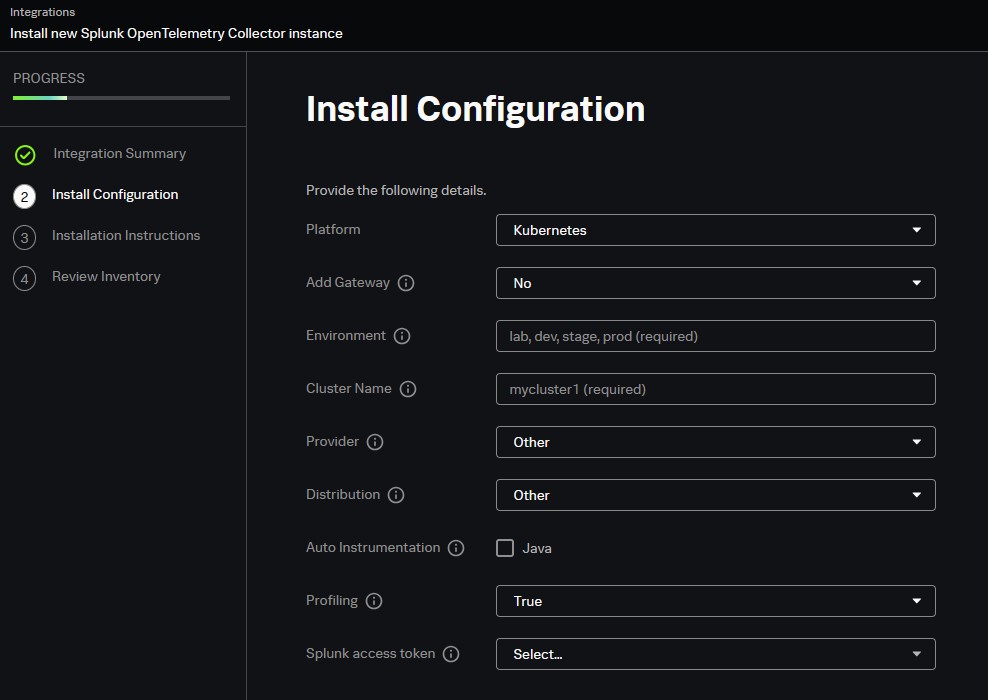
Splunk Observability Cloud uses the Splunk Distribution of OpenTelemetry Collector for Kubernetes to provide robust infrastructure monitoring capabilities. Deploy the Collector to gather telemetry for Splunk Infrastructure Monitoring, Splunk APM, or Splunk Log Observer.
The Collector is deployed using a Helm chart for the Splunk Distribution of OpenTelemetry Collector for Kubernetes.
There are two Kubernetes navigators,
- Kubernetes nodes: Provides a hierarchical view of your Kubernetes infrastructure.
- Kubernetes workloads: Provides a view of Kubernetes workloads across all your infrastructure.
Kubernetes nodes navigator
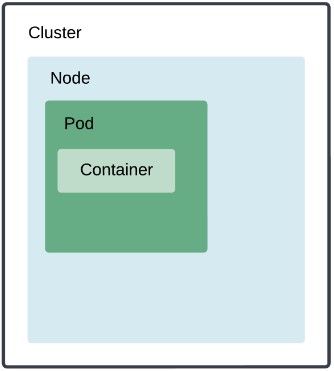
Each Kubernetes service consists of the following elements:
- Container: A lightweight package containing everything needed to run applications.
- Pod: A group of one or more containers, with shared storage and network resources, and a specification for how to run the containers.
- Node: A physical or a virtual machine that hosts pods and the necessary resources to run pods.
- Cluster: A group of nodes for running containerized applications.
Kubernetes nodes
- Containers are colored by status: Ready, Not Ready, and Unknown
- Pods are colored by phase: Running, Pending, Succeeded, Failed, and Unknown
- Nodes are colored by condition: Node Ready, Memory Pressure, PID Pressure, Disk Pressure, Network Unavailable, and Out of Disk
Kubernetes workloads
A workload is an application running on Kubernetes. Your workload might be a single component or several that work together, but it always runs inside a set of pods on Kubernetes.
Apart from monitoring your Kubernetes infrastructure, you can also track services and hosts where Kubernetes is running in the navigator sidebar for both the Kubernetes nodes and workloads navigators.
Analyzer
The Analyzer accessed through the K8s analyzer tab helps you troubleshoot Kubernetes problems at scale by highlighting Kubernetes objects that are in a bad state, such as nodes that are not ready. Then, the Analyzer produces theories about what those objects might have in common, such as that all of the objects are running the same workload or all objects are located in the same AWS region.
The Analyzer uses AI-driven insights to examine patterns that nodes, pods, or containers could have in common. Trouble indicators are:
- pods that are in pending status
- pods that are in failed status
- pods with unknown condition
- containers with high restart counts
- nodes not ready
- nodes with unknown condition
- nodes experiencing high CPU
- nodes experiencing high memory
Next Page: Splunk APM
Main Page: Click Here