MyObservability
Application Performance Monitoring
Splunk APM monitors cloud-native, microservices-based applications by collecting traces. A trace is a collection of actions (known as spans) that occur to complete a transaction. Splunk APM collects and analyzes every span and trace that is generated by the instrumentation.
Splunk APM helps with visualizing and understanding complex distributed environments that are critical to business functions, productivity and customer experience. It provides capabilities to reduce MTTR via unmatched levels of visualization and troubleshooting features.
To set up Splunk APM and begin analyzing application availability and performance, follow these steps:
- Send traces to Splunk APM
- Learn what you can do with Splunk APM
- Customize your Splunk APM experience
Send traces to Splunk APM
Steps involved:
- Collect application data with an OpenTelemetry Collector
- Collect Kubernetes data
- Collect Linux host data
- Collect Windows host data
- Instrument your applications
- Verify successful data ingestion
Collect application data with an OpenTelemetry Collector
As a first step to collecting data from your application, you should deploy the OTel Collector. This tool allows you to export spans and traces from Kubernetes, Linux, and Windows hosts and containers to Splunk Observability Cloud.
-
To deploy the Splunk Distribution of OpenTelemetry Collector on a host, select Navigation menu > Data Management and search for the host type you’re using. Then follow the steps in the setup wizard.
- Collect Kubernetes data
- Collect Linux host data
- Collect Windows host data
Instrument your applications and services to get spans into Splunk APM
Use the autoinstrumentation libraries provided by Splunk Observability Cloud to instrument services in supported programming languages. To get the highest level of support, send spans from your applications to the OpenTelemetry Collector you deployed in the previous step.
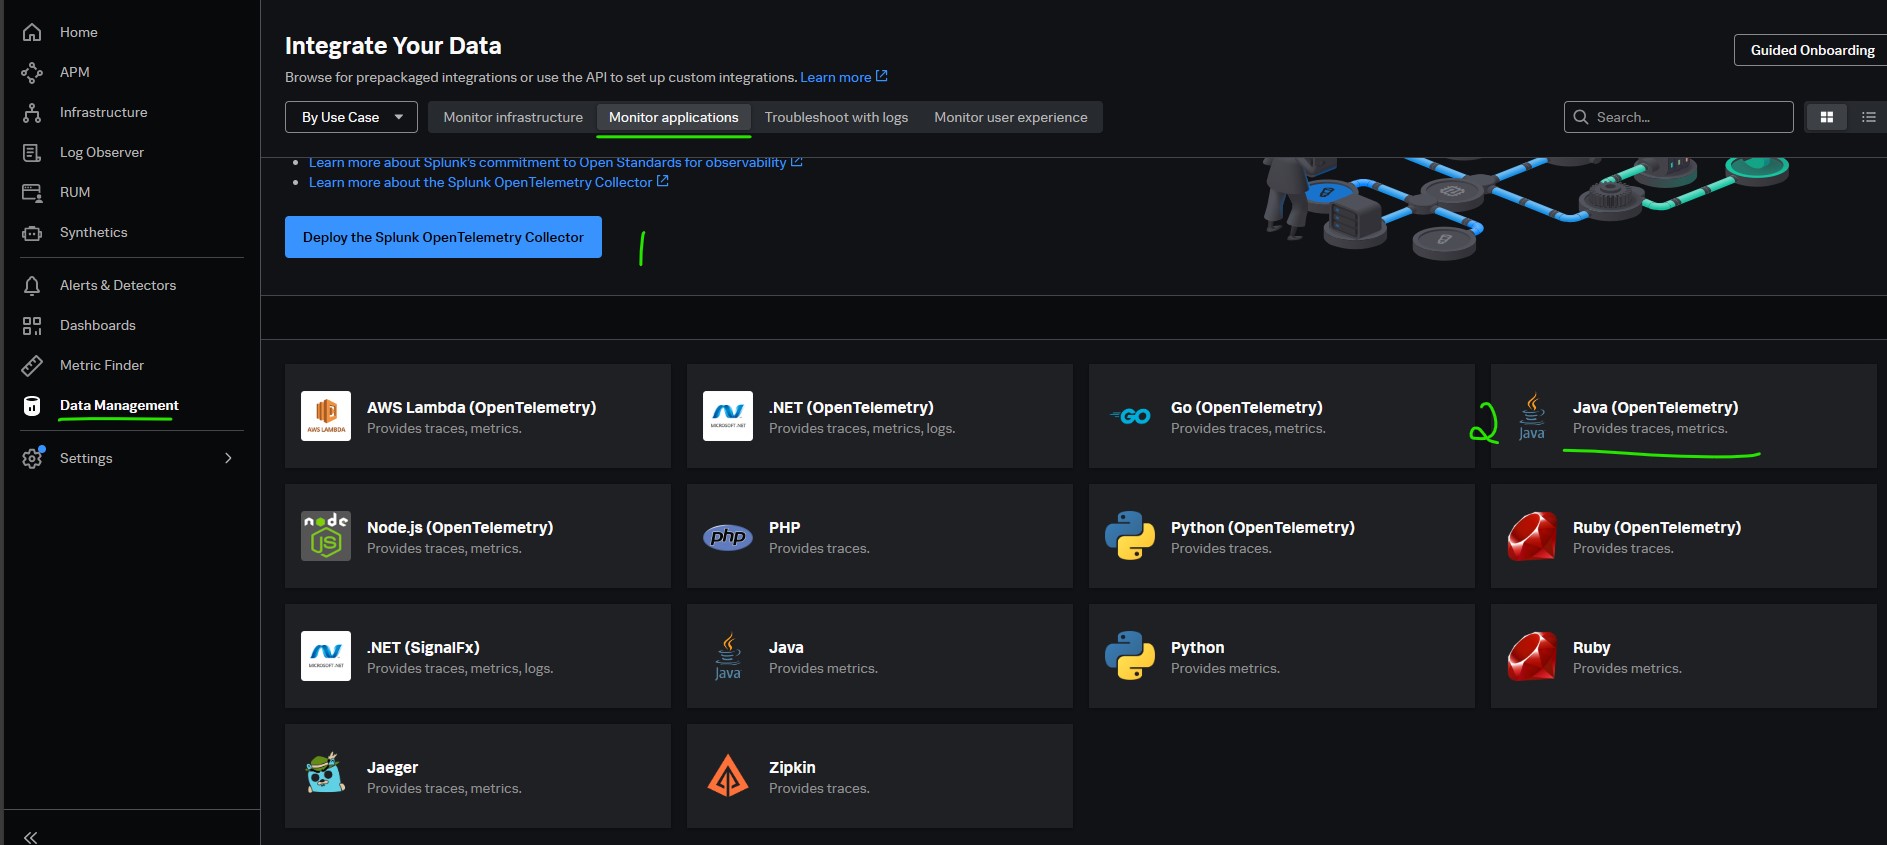
How you specify the OpenTelemetry Collector endpoint depends on the language you are instrumenting. To collect spans and traces from a service, select Navigation menu > Data setup and search for an instrumentation library for the service you want to instrument.
You can instrument following technologies:
- Java (provide traces, metrics)
- .Net (provide traces, logs, metrics)
- Go (provide traces, metrics)
- Node.JS (provide traces, metrics)
- Python (provide metrics)
- Ruby (provide traces)
- PHP (provide traces)
- Jaeger (provide traces, metrics)
- Zipkin (provide traces)
- AWS Lambda (provide traces, metrics)
Refer: Send traces to Splunk APM Ex: Instrumenting Java applications
- Generate customized instructions using the guided setup
Verify successful data ingestion
After you have instrumented your applications, select Observability > APM and check that you can see your application data in the dashboard
Learn what you can do with Splunk APM
- Assess the health of your applications with the APM landing page
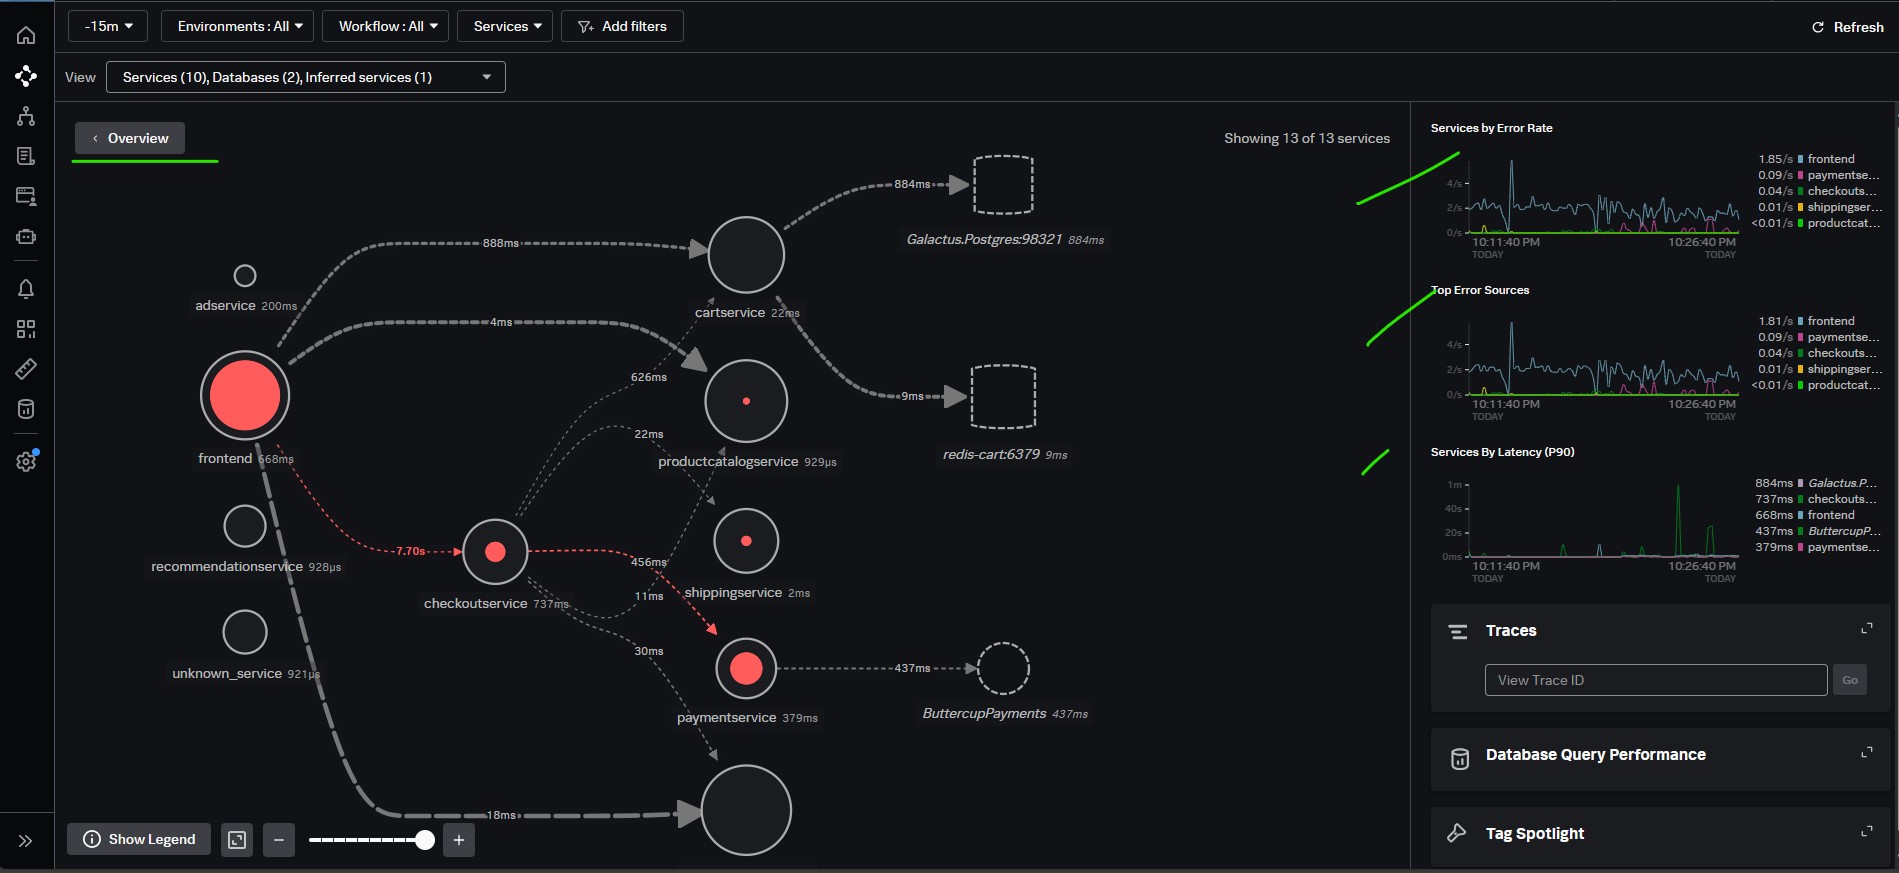
- View dependencies among your applications in the Explore view
- Examine the latency of a specific trace in Trace Analyzer
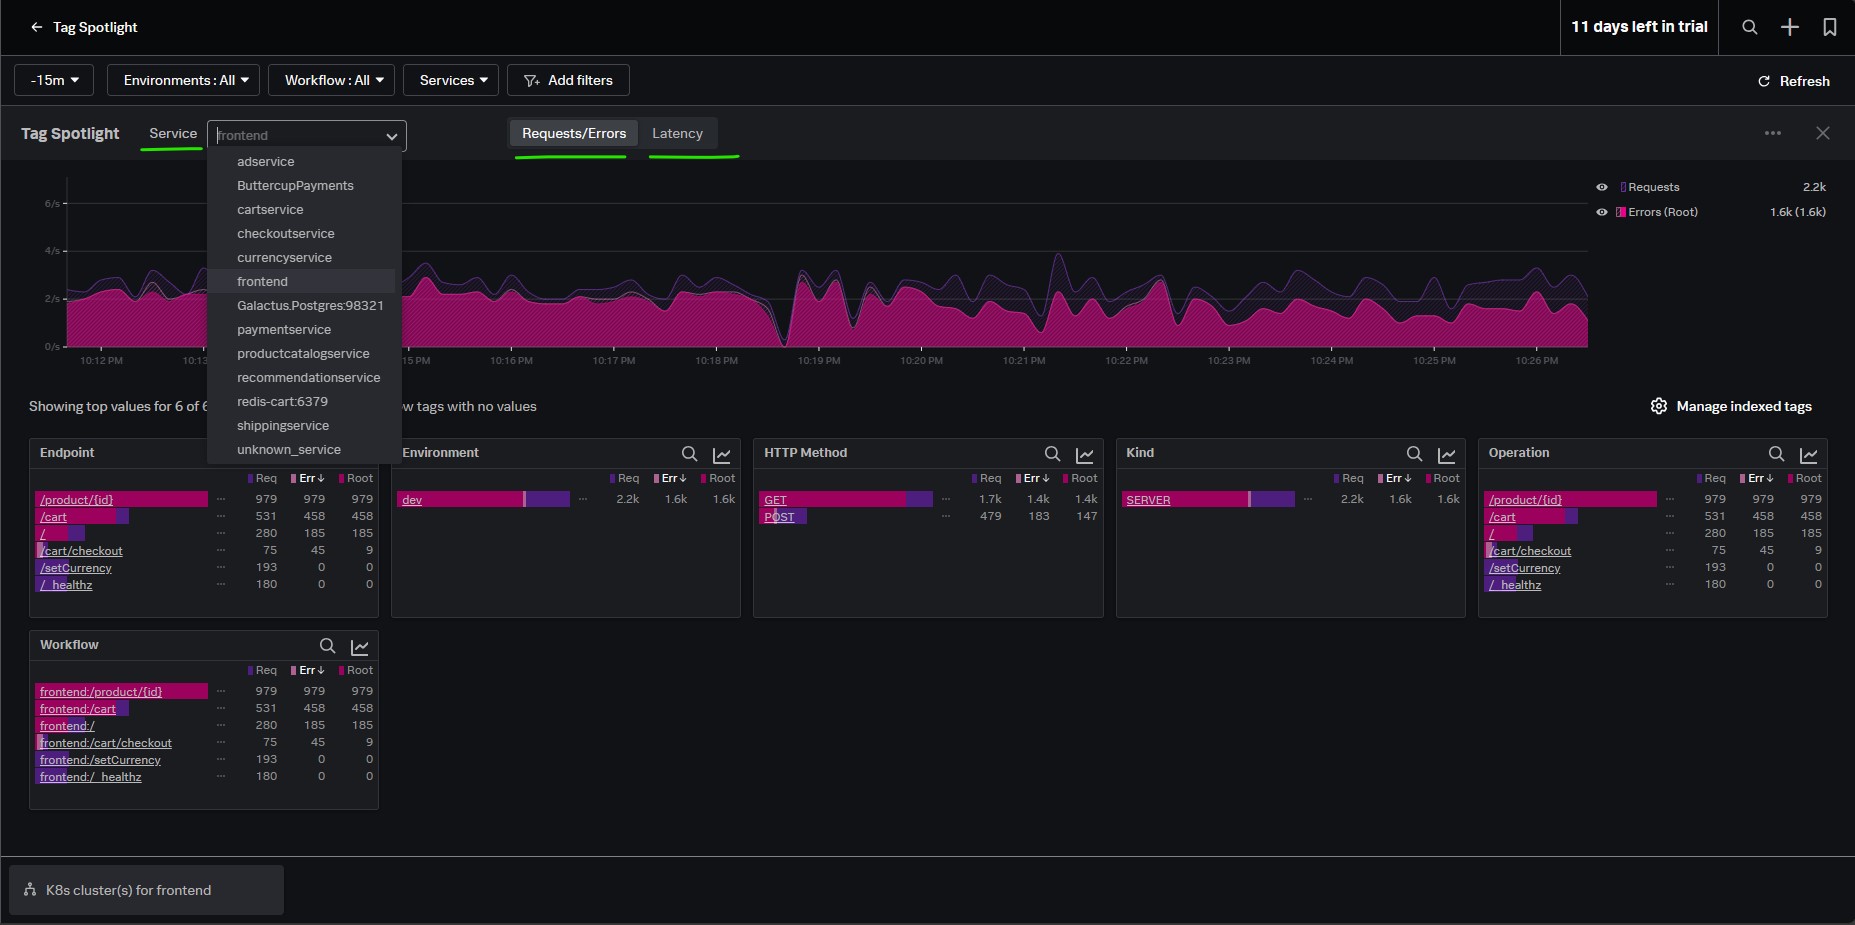
- Get a top-down view of your services in Tag Spotlight
Assess the health of your applications with the APM landing page
- Navigation menu > APM
To view the real time snapshot of Services & Business Workflows at a glance.
Splunk APM homepage
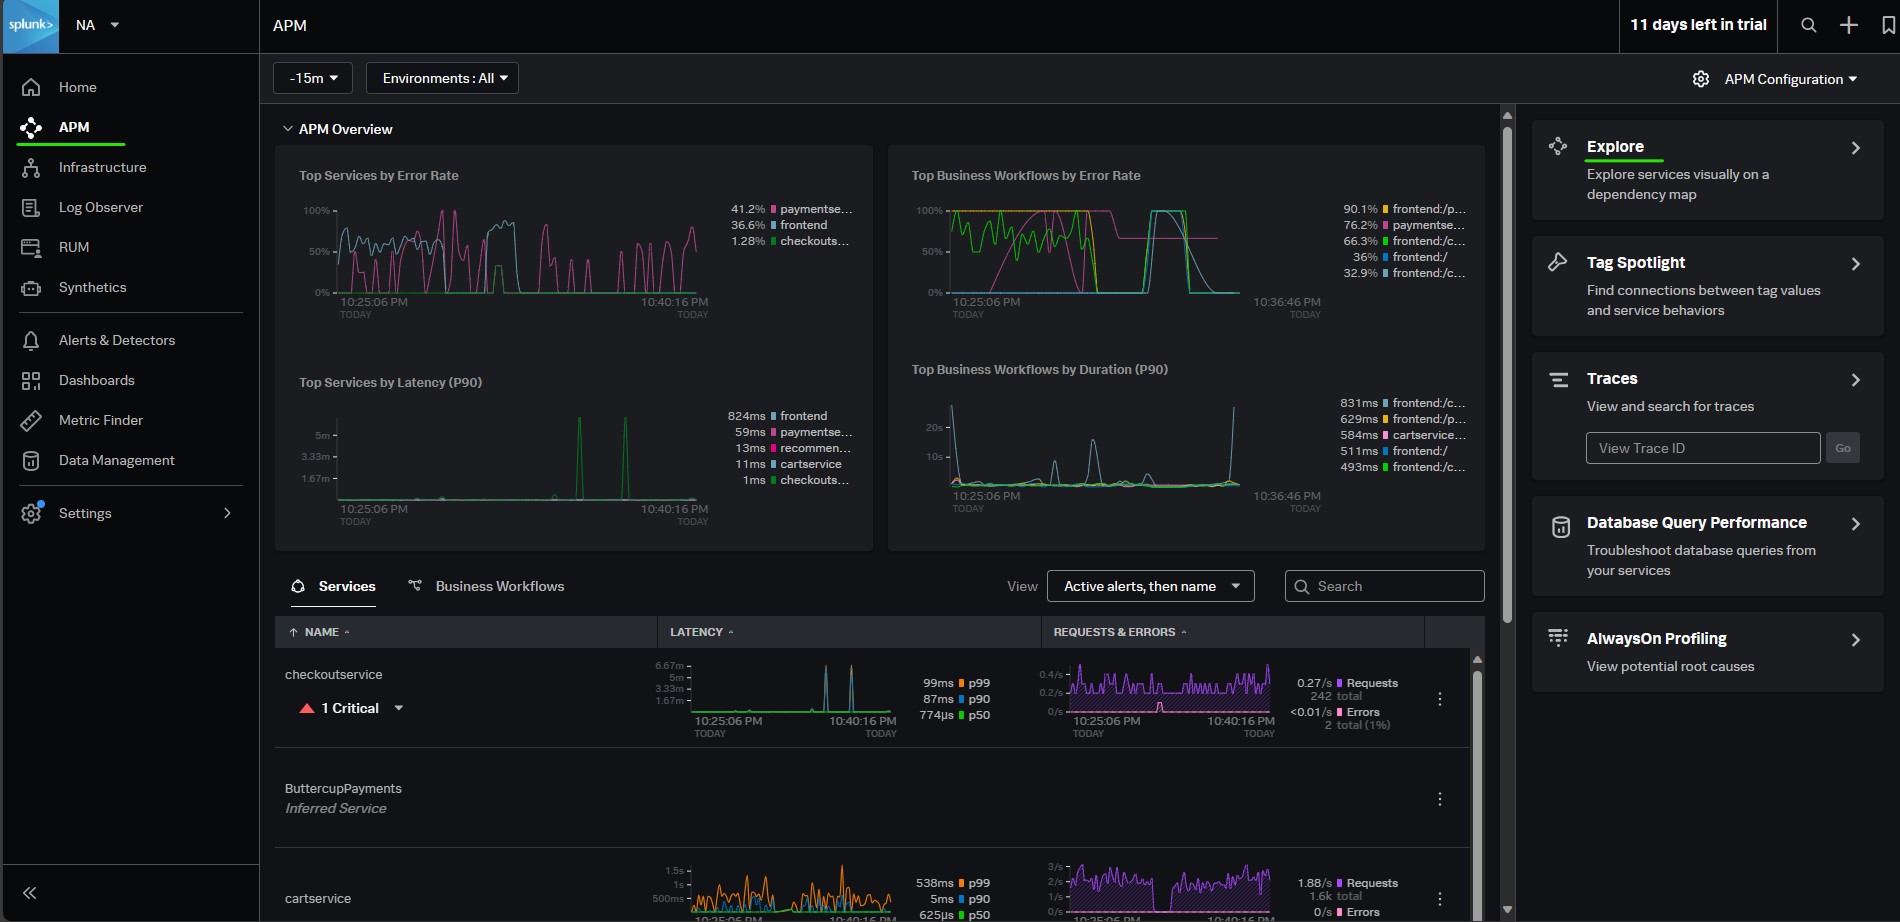
Explore (Review the Service Map): Explore services visually on a dependency map. The Service Map is a visual representation of your various services and their dependencies. Splunk APM automatically discovers your instrumented services and their interactions to present dynamic and real-time service maps of your application’s architecture. Use the service map to make more sense of your complex network of services and quickly identify where issues may be occurring, in a visual way.
Review Tag Spotlight : Use Tag Spotlight to analyze the performance of your services to discover trends that contribute to high latency or error rates with indexed span tags. You can break down every indexed span tag for a particular service to view metrics for it. When you select specific span tag values or a specific time range, you can view representative traces to learn more about an outlying incident.
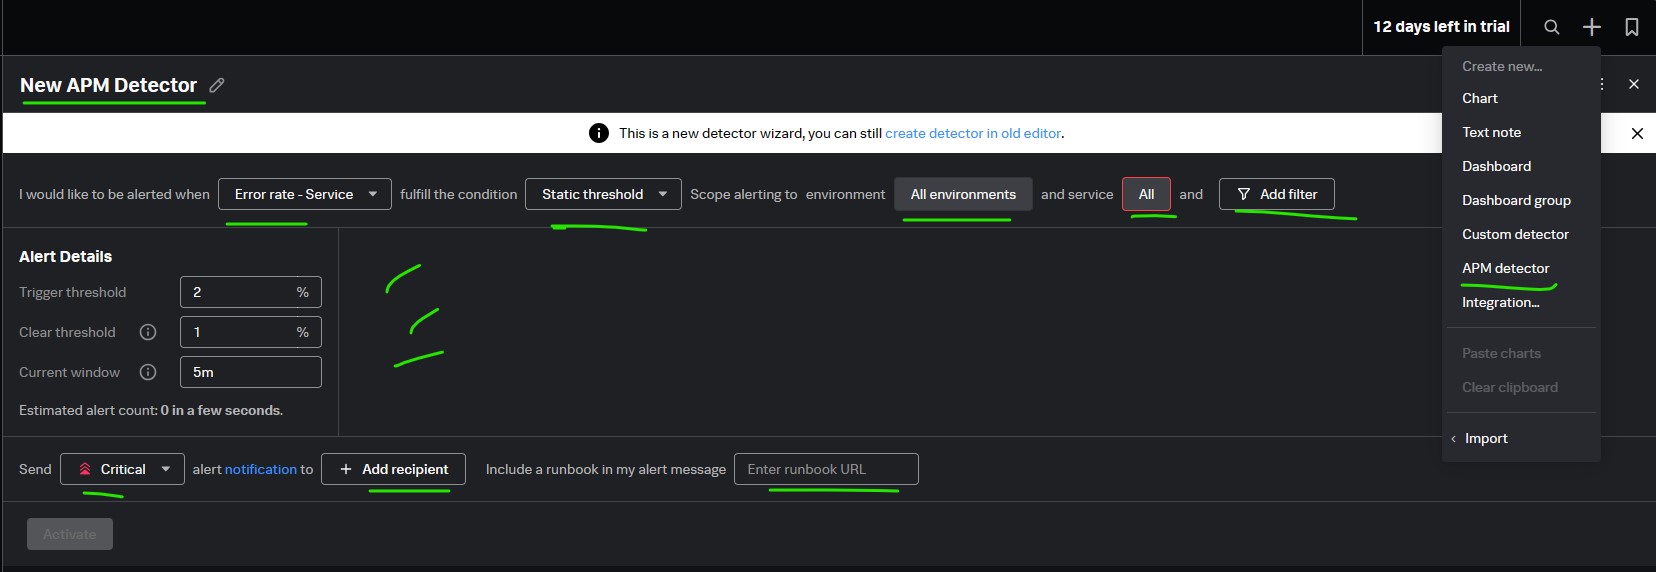
Creating APM Detector:
You can dynamically monitor error rate and latency in the services you are tracing with Splunk APM as well as Business Workflow
Additional Configurations
configuring and optimizing in order to get the most out of Splunk APM.
- Indexing span tags
- Establishing business workflows
Indexing span tags
Drill down into service performance with span tags. Span tags provide additional context about operations that spans represent. Default span tags include things like the environment, endpoint, operation, Service and HTTP method associated with a span. Using these tags, you can analyze requests, errors, and latency for spans that contain specific span tags. This context lets you understand service performance at a glance and helps you discover the root cause of issues faster.
Index span tags to analyze services in the following ways:
- Break down service performance by indexed tags in the Troubleshooting Service Map.
- View charts of service performance metrics by indexed span tags in Tag Spotlight.
- Track multiple traces for a specific activity with Business Workflows.
Consider which span tags are worth creating MetricSets for.
There are two ways to add span tags:
- Instrument your application to create span tags: How you instrument code to create span tags depends on your code’s language. See resources for the language you are instrumenting.
- Add span tags with an OpenTelemetry Collector: Include span tags in settings for the batch processor in your OpenTelemetry Collector configuration YAML file.
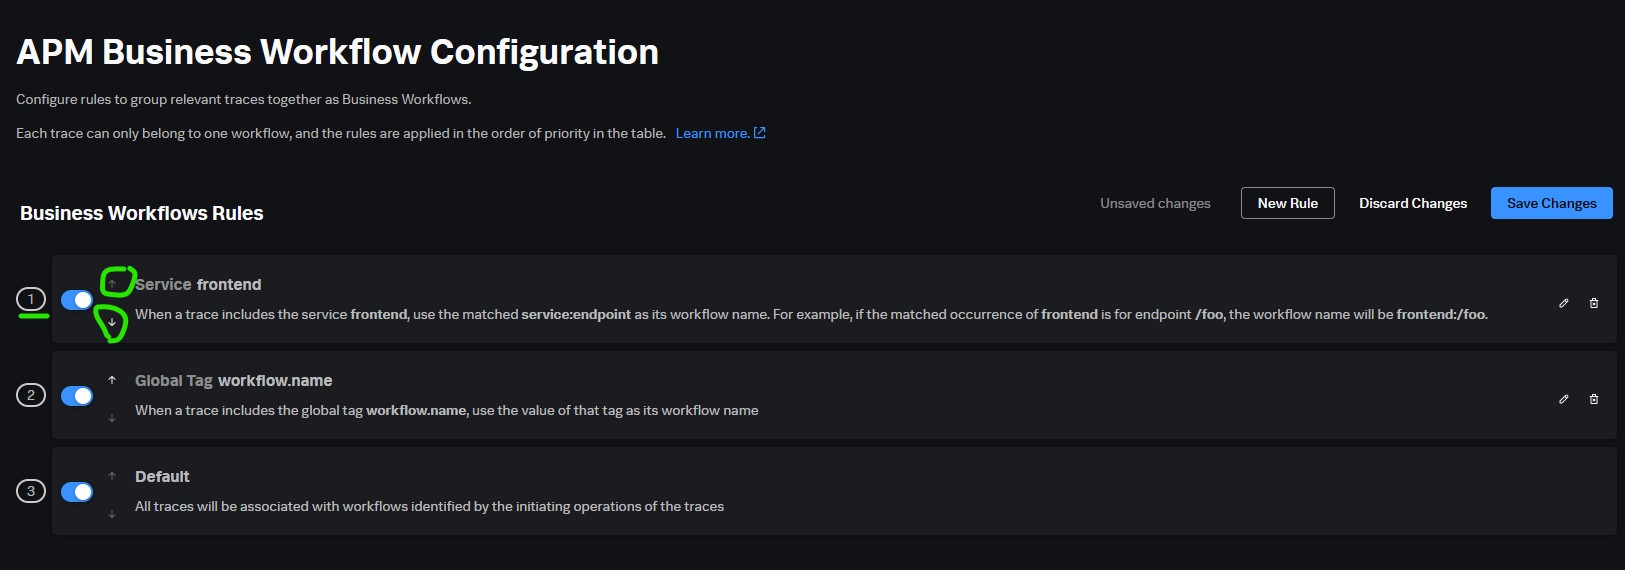
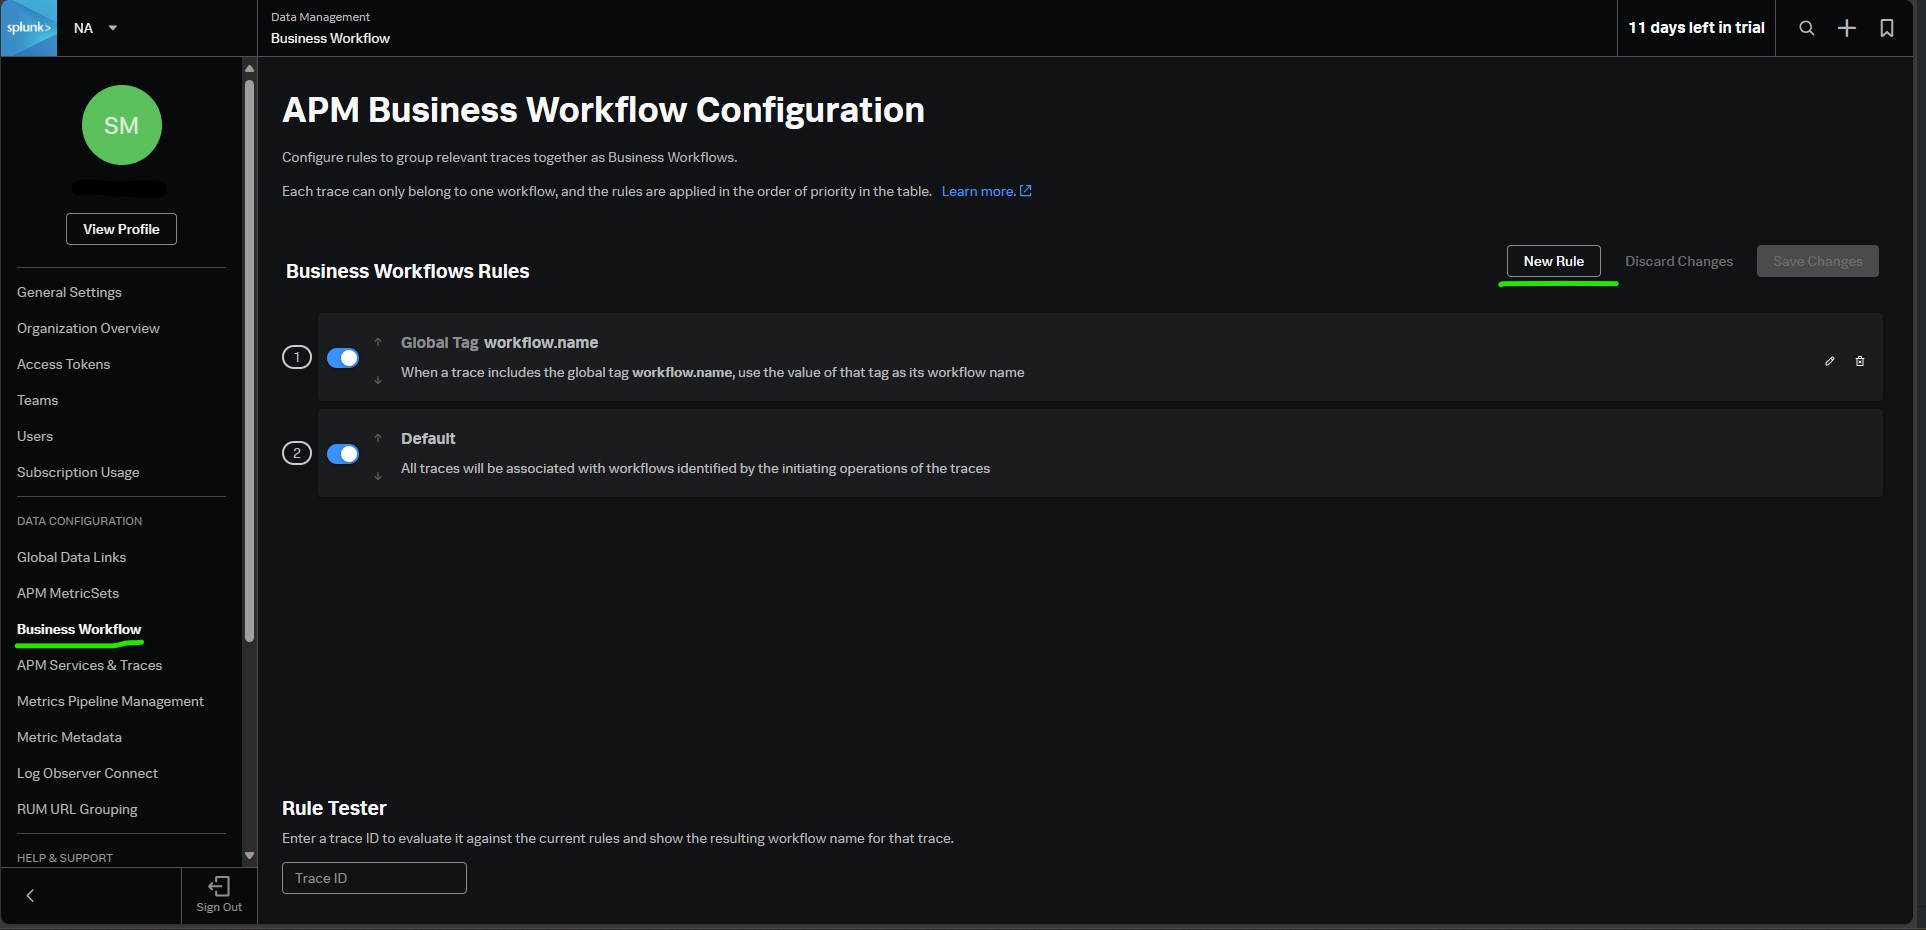
Establishing business workflows
A business workflow is the start-to-finish journey of the collection of traces associated with a given activity or transaction. Each trace consists of multiple spans, and each span has identifying tags.
You can create rules that correlate traces from a specific service or from multiple services that include the same global span tag. You must be an administrator to configure business workflow rules.
Select a rule type:
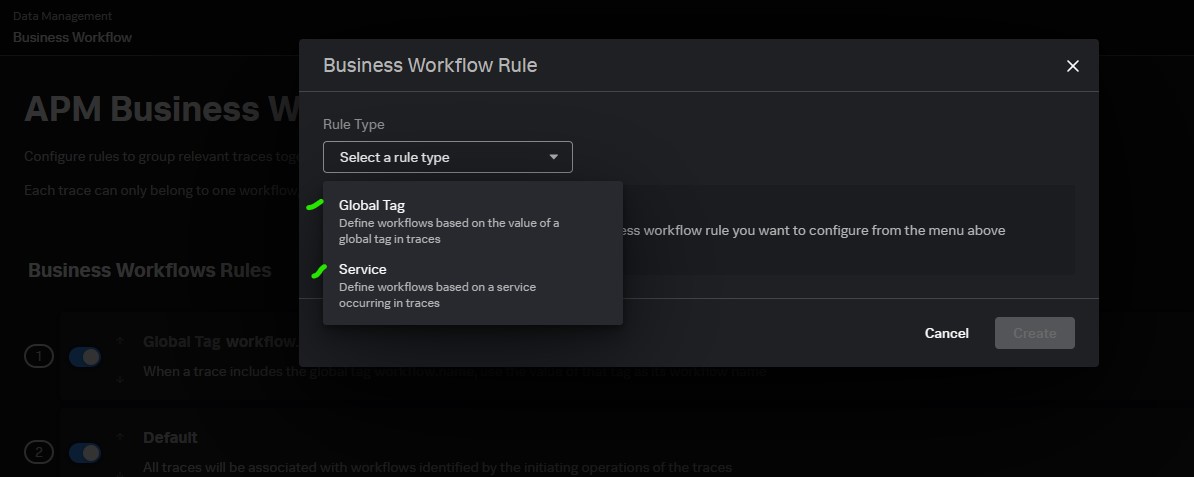
- Global Tag. Define workflows based on the value of a global tag in spans associated with a trace. This correlates traces that contain spans with the global tag.
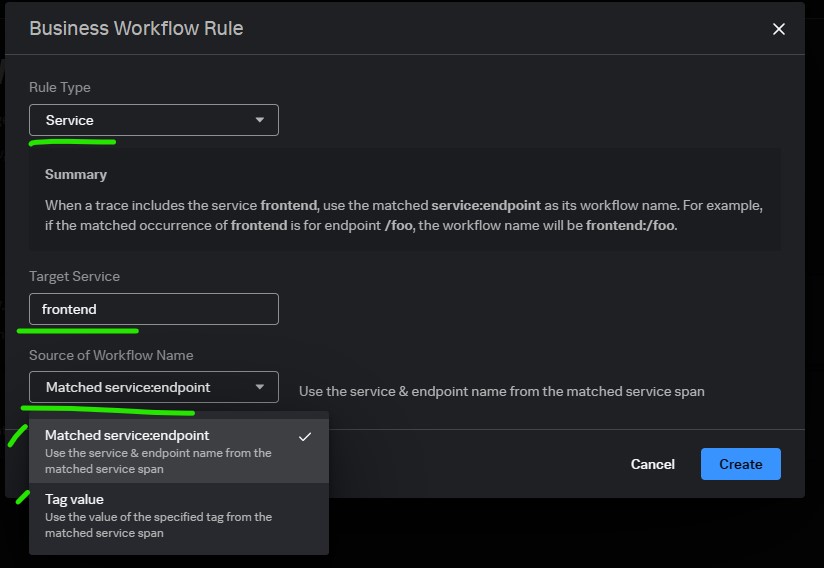
- Service. Define workflows based on traces that include a service you specify. When a trace matches the rule, you also see a specified tag value or endpoint associated with the trace for the service.
Select a Target Global Tag or Target Service according to the Rule Type you selected.
- Target Global Tag prompts you to select an indexed global tag. When you select a tag, the rule correlates all traces with the global tag. The rule name is based on the global tag you select.
- Target Service prompts you to select a service and specify the Source of Workflow Name, which is extra metadata to view about the workflow. You can select to correlate traces for a service by an endpoint for the initiating span or a span tag value
Priority: