MyObservability
Dashboarding
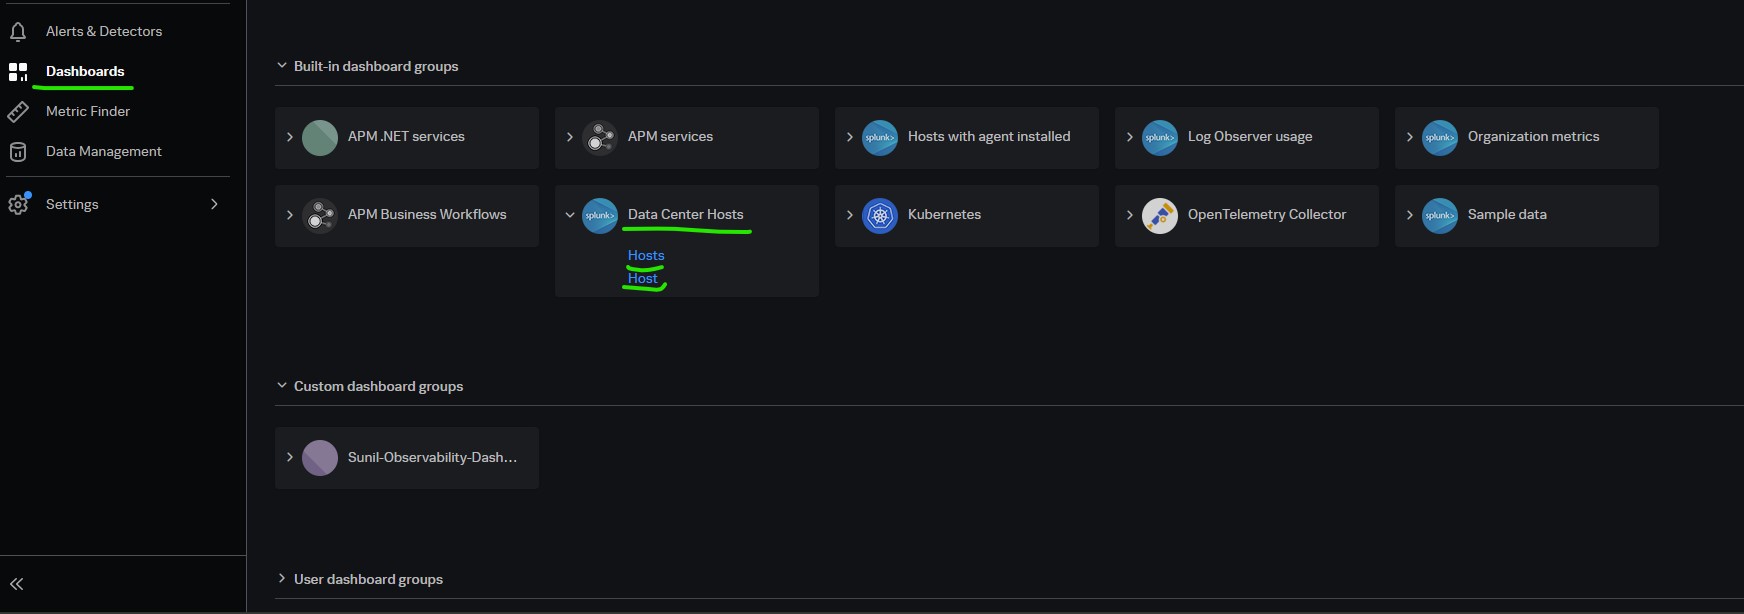
Dashboard Groups:
- A dashboard group is a collection of dashboards.
- A dashboard contains charts.
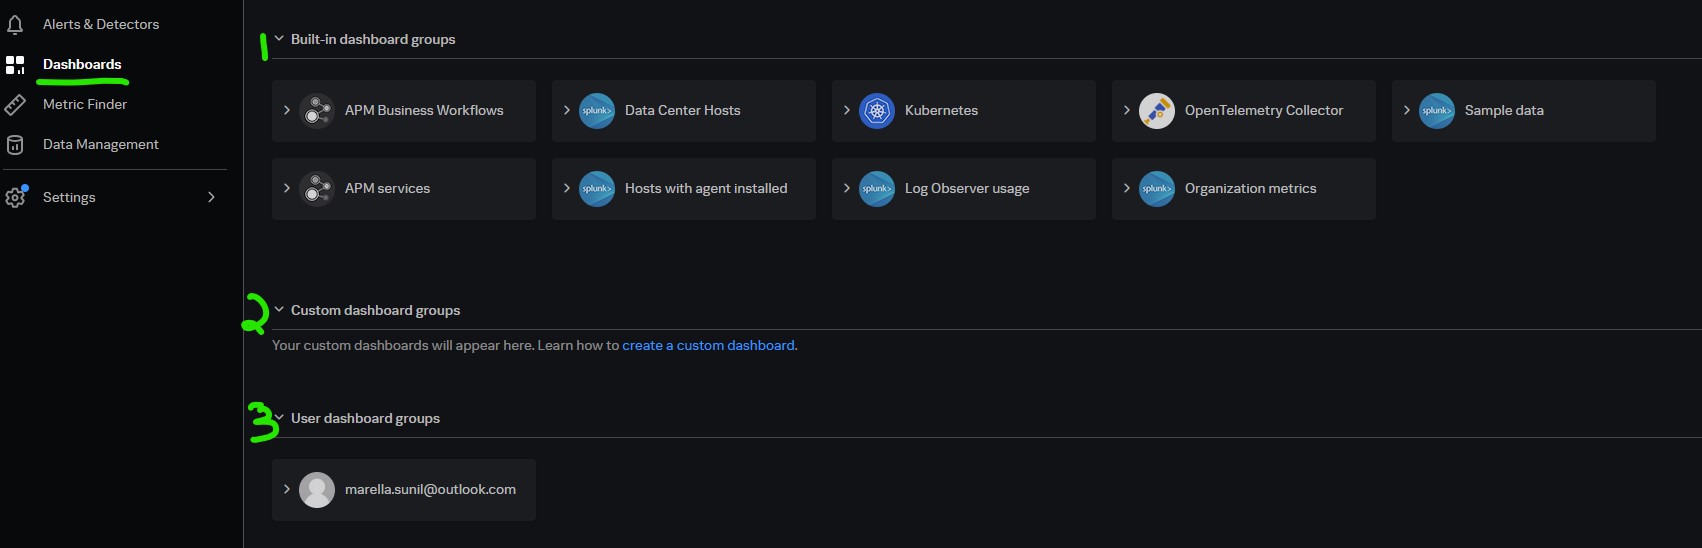
- Dashboard groups can be accessed under Dashboards.
You can use Dashboard groups to monitor perticular area of your infrastructure, based on teams requriement, Group KPIs or summary dashboard for executives, business related metrics for PO’s etc..
There are three categories of dashboard groups:
- Built-in: Built-in dashboard groups are pre-built dashboards based on integrations that have been set up
- Custom: Dashboard groups created by a user
- User: User dashboard groups are automatically created for each user that is added to the org and contain a blank dashboard. You can add charts to this dashboard and add dashboards to your user dashboard group. Use this dashboard group for learning and testing purposes.
Creating a Dashboard Group
- From the create menu
- When saving a dashboard
- Importing a dashboard group
Dashboard Group Permissions
- Everyonbe can read & write.
- Restricted write access - You can add multiple users with write access.
- Restricted read and write access - Select team/user and choose read, write, read & write access.
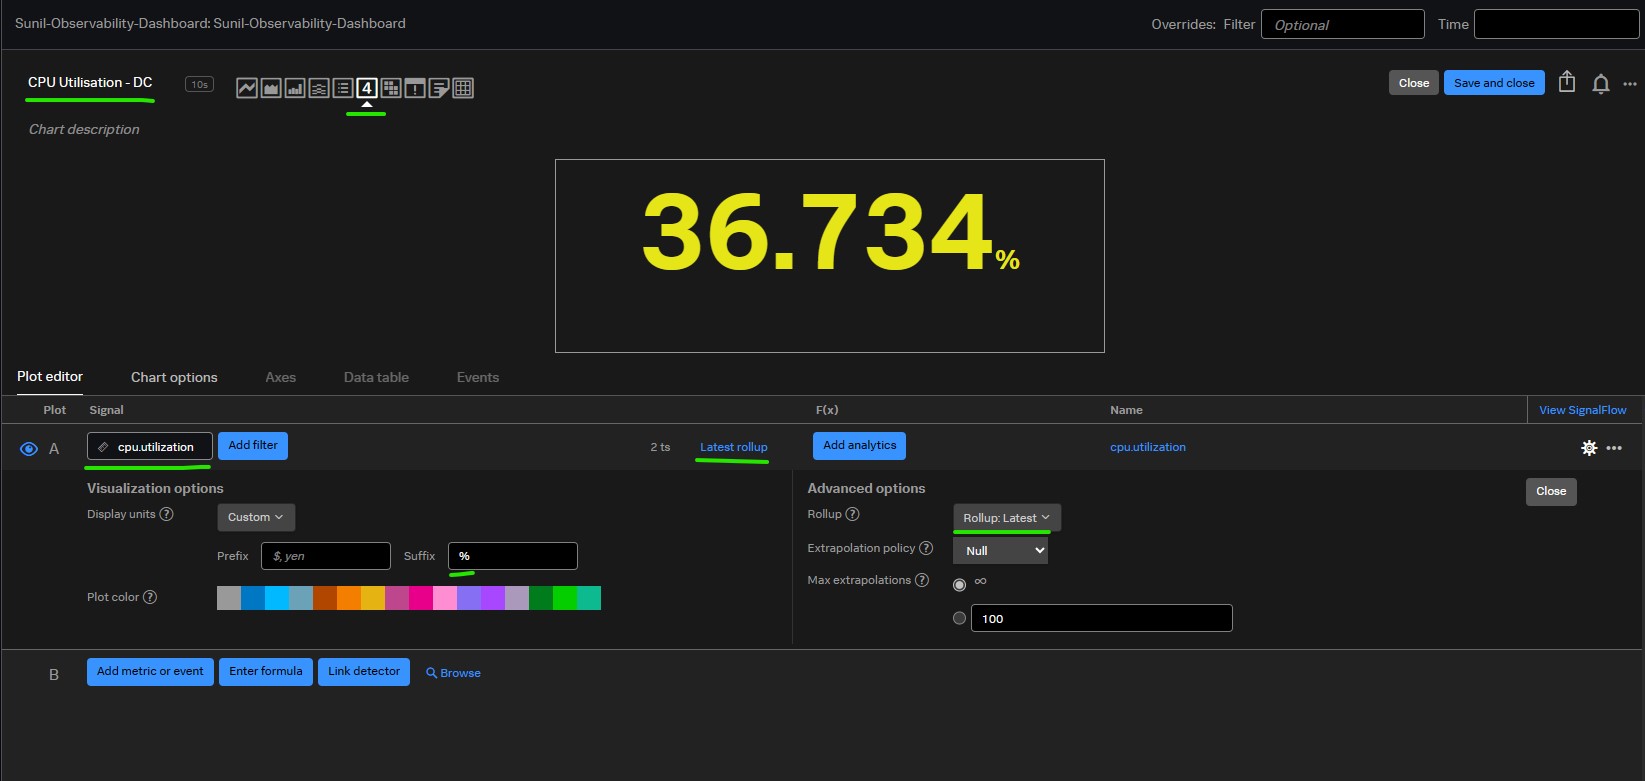
Creating charts
Ex: 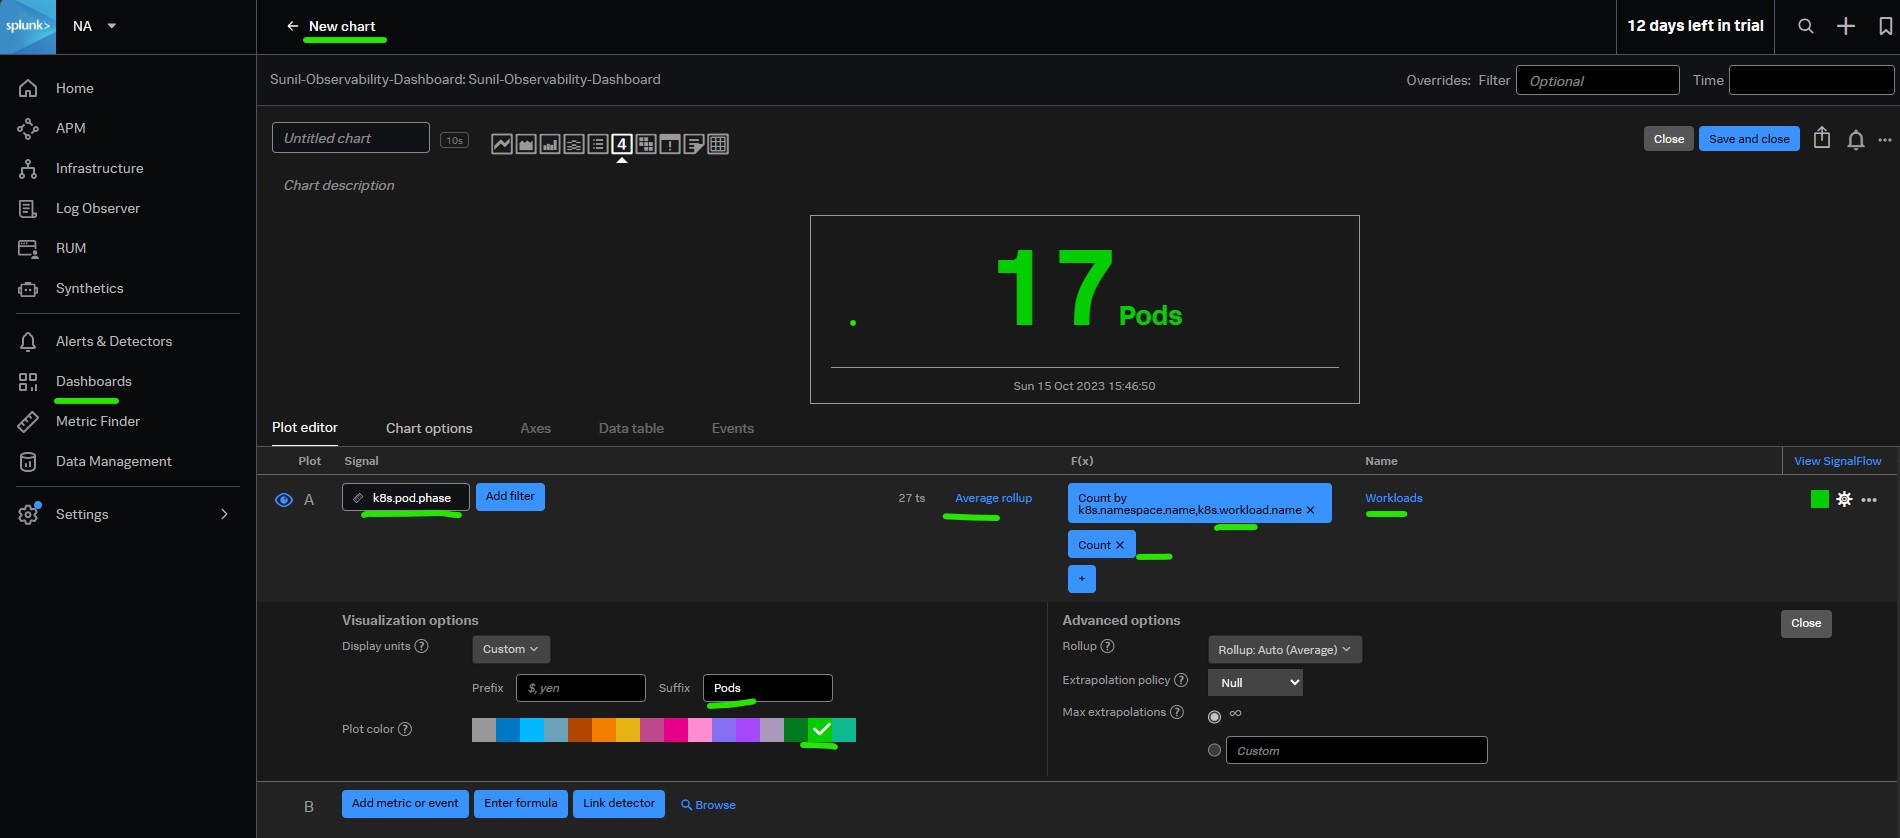
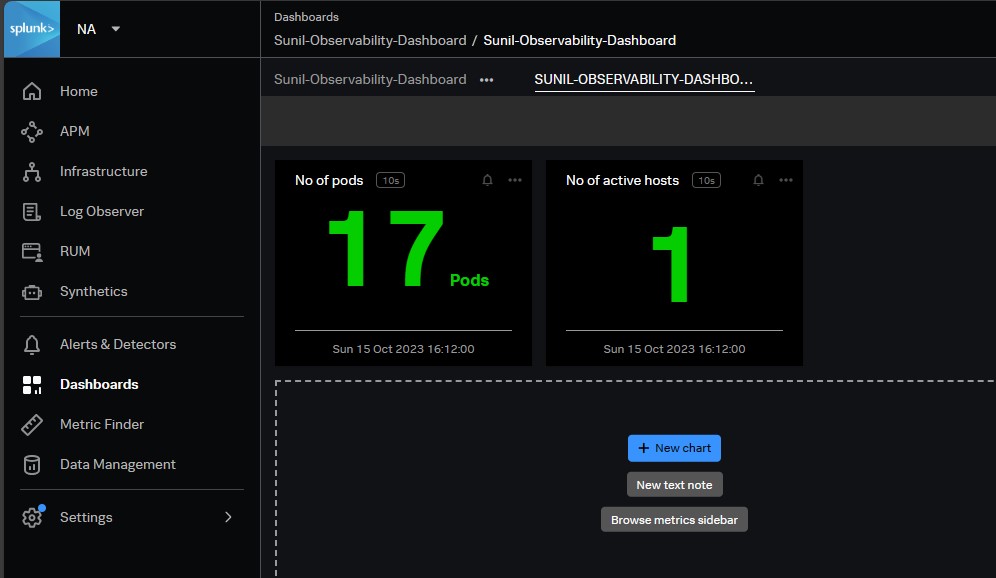
Otherways creating charts
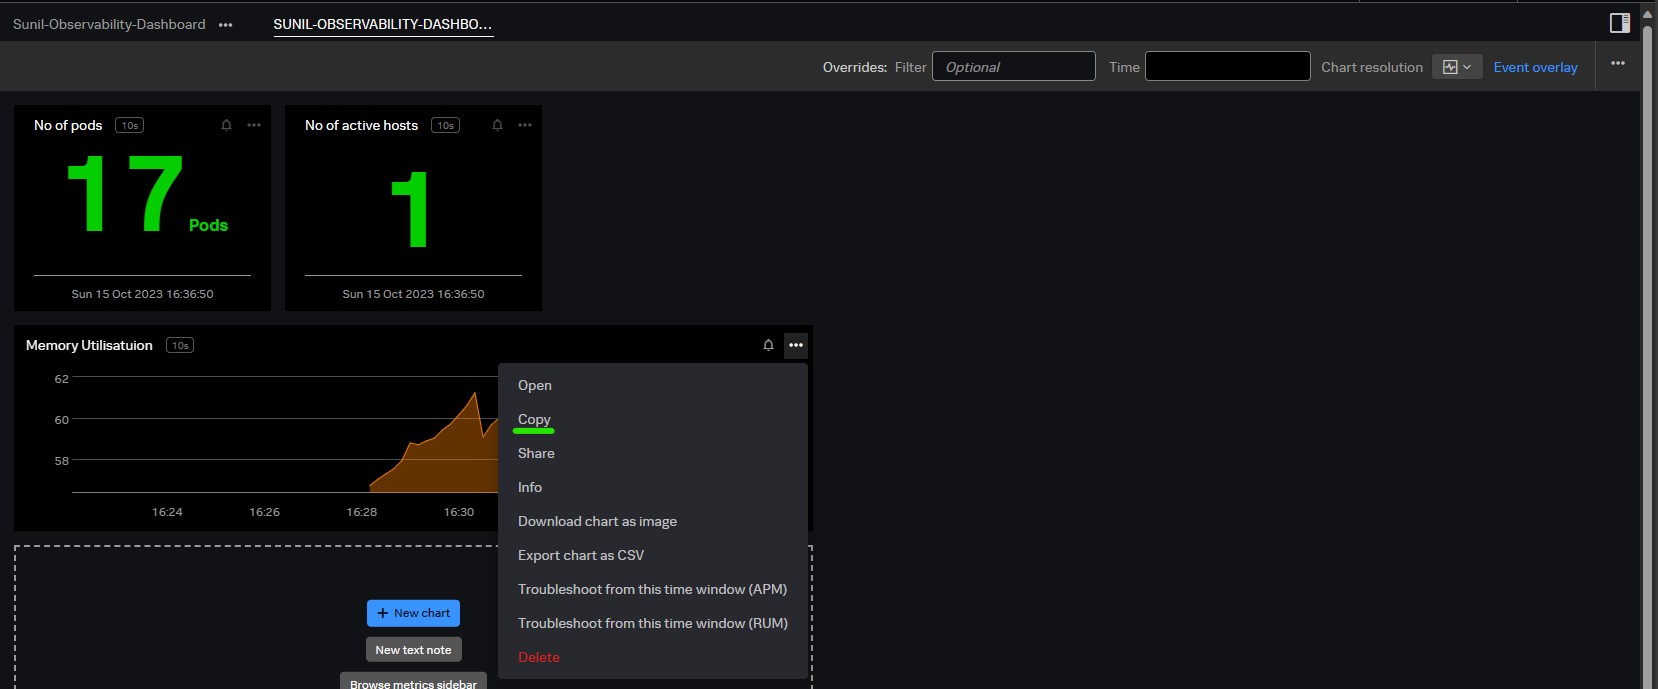
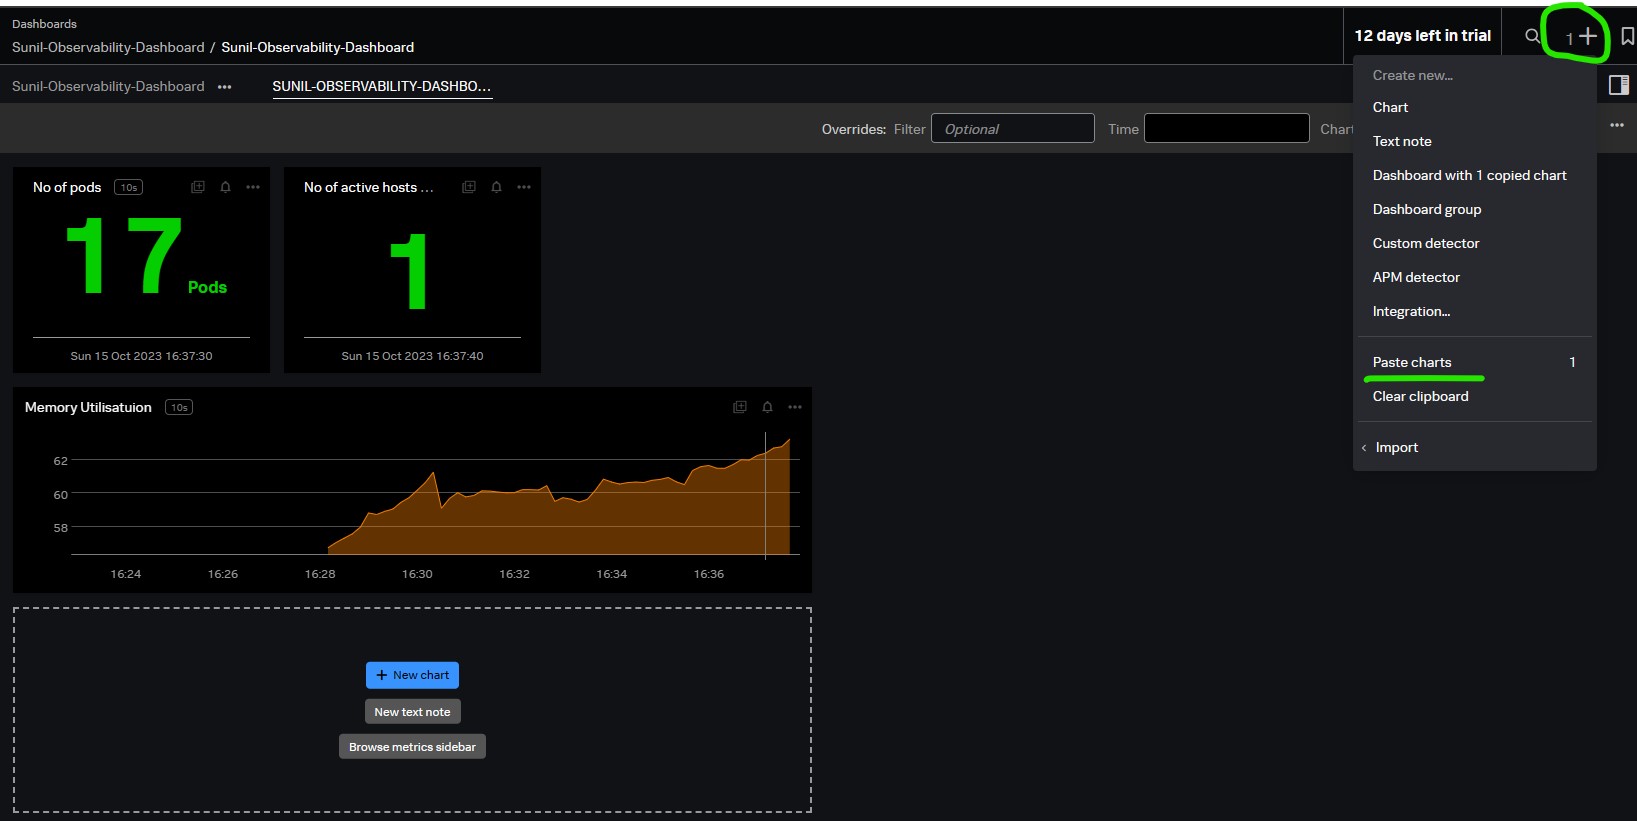
Copy & pasting charts
Using the REST API to create these objects
Using the Splunk Terraform provider to create these objects
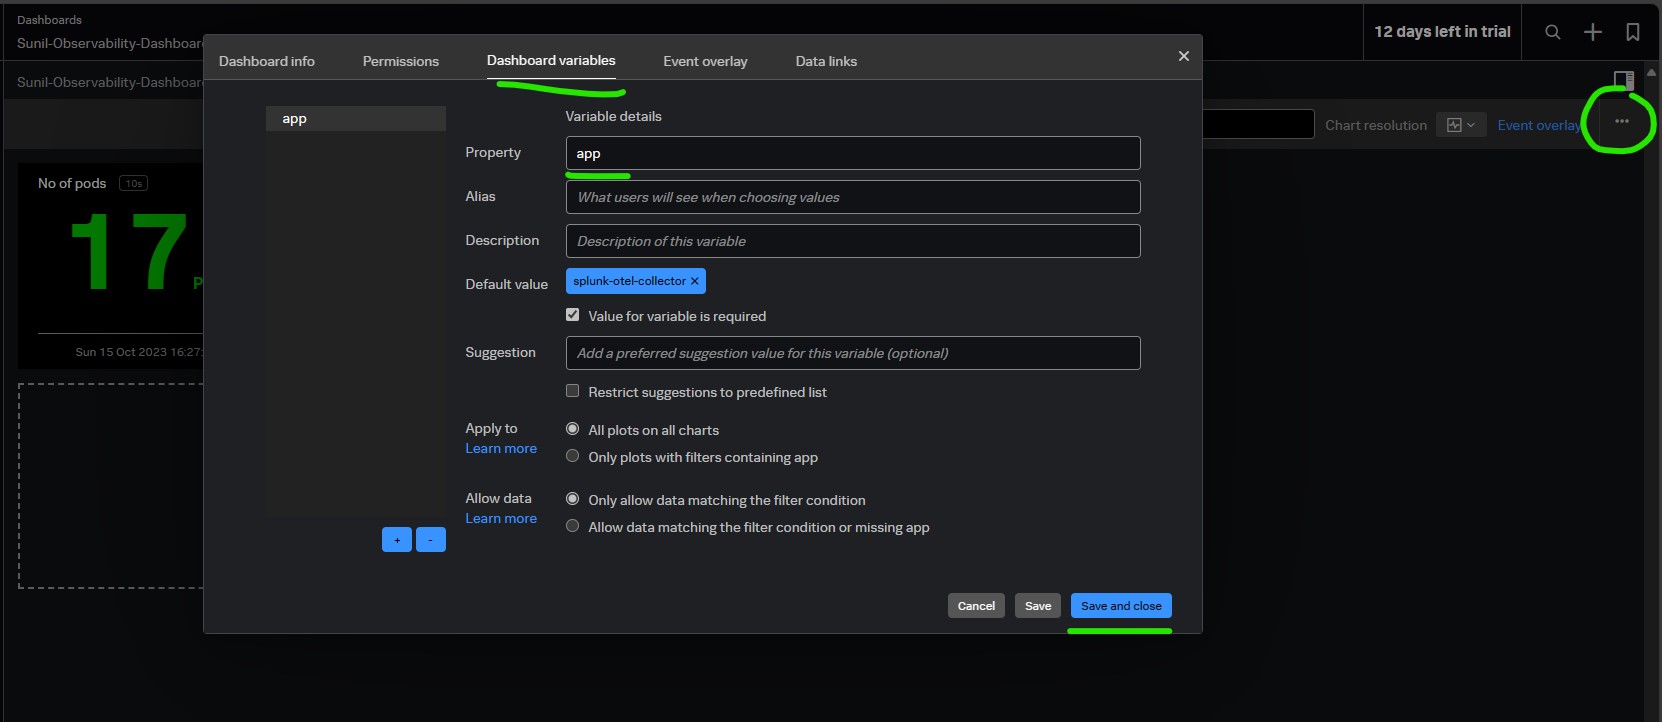
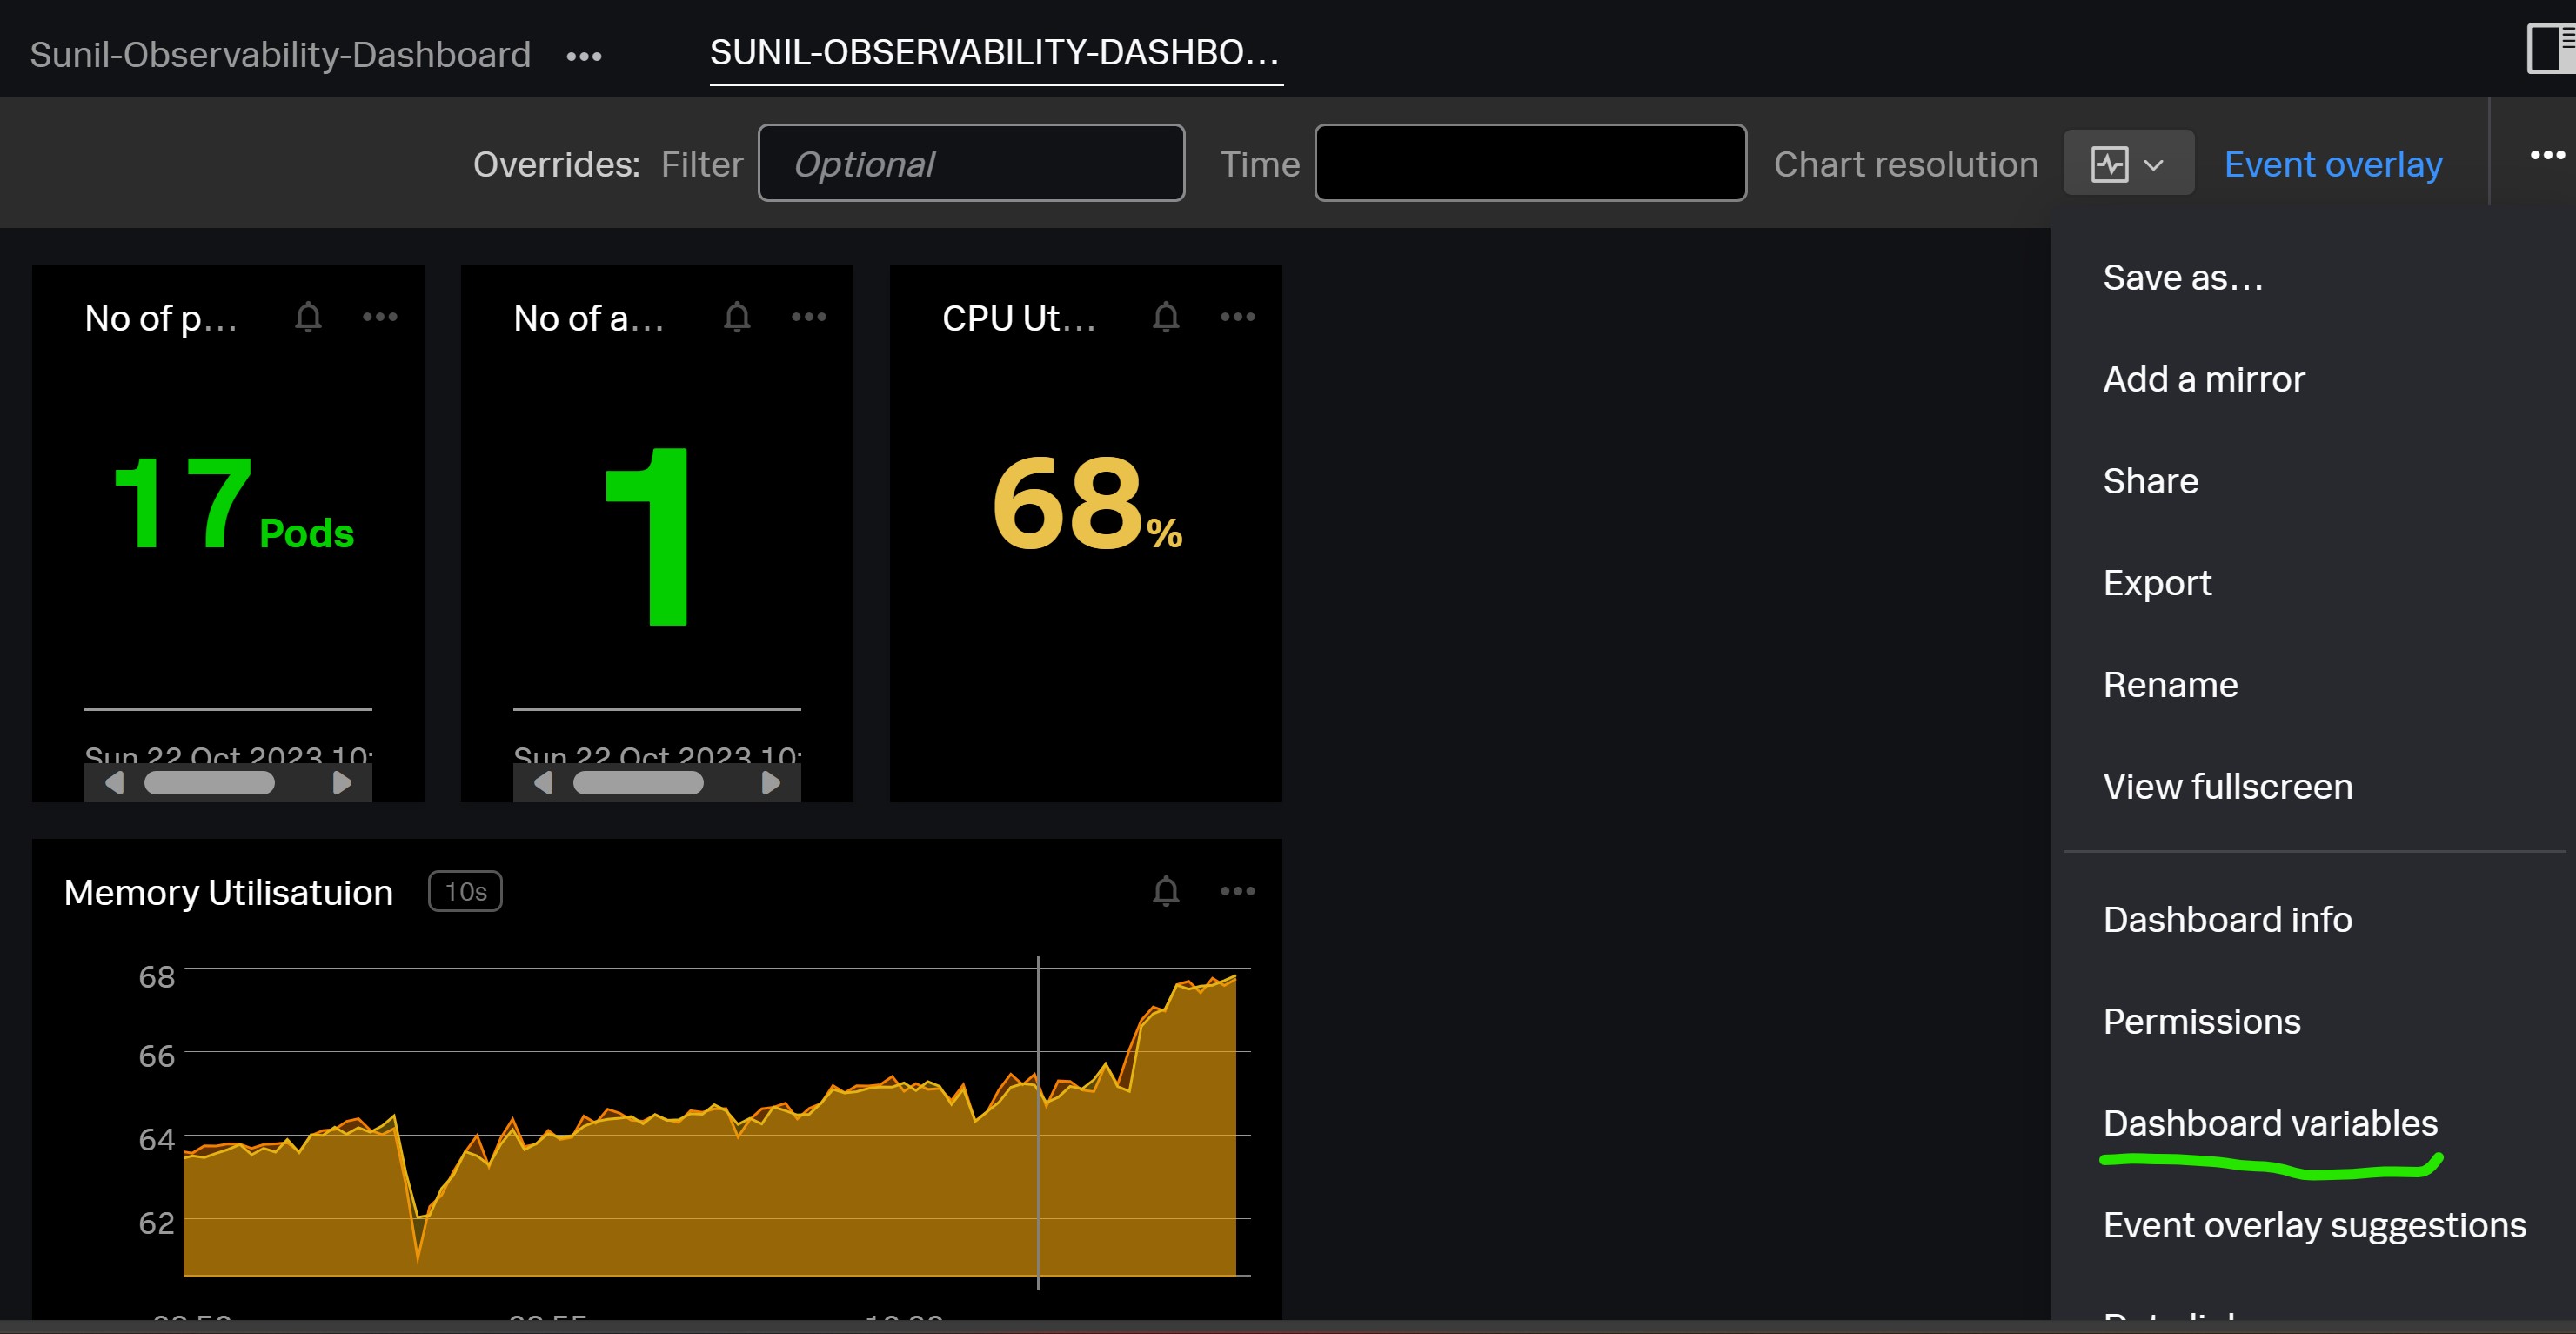
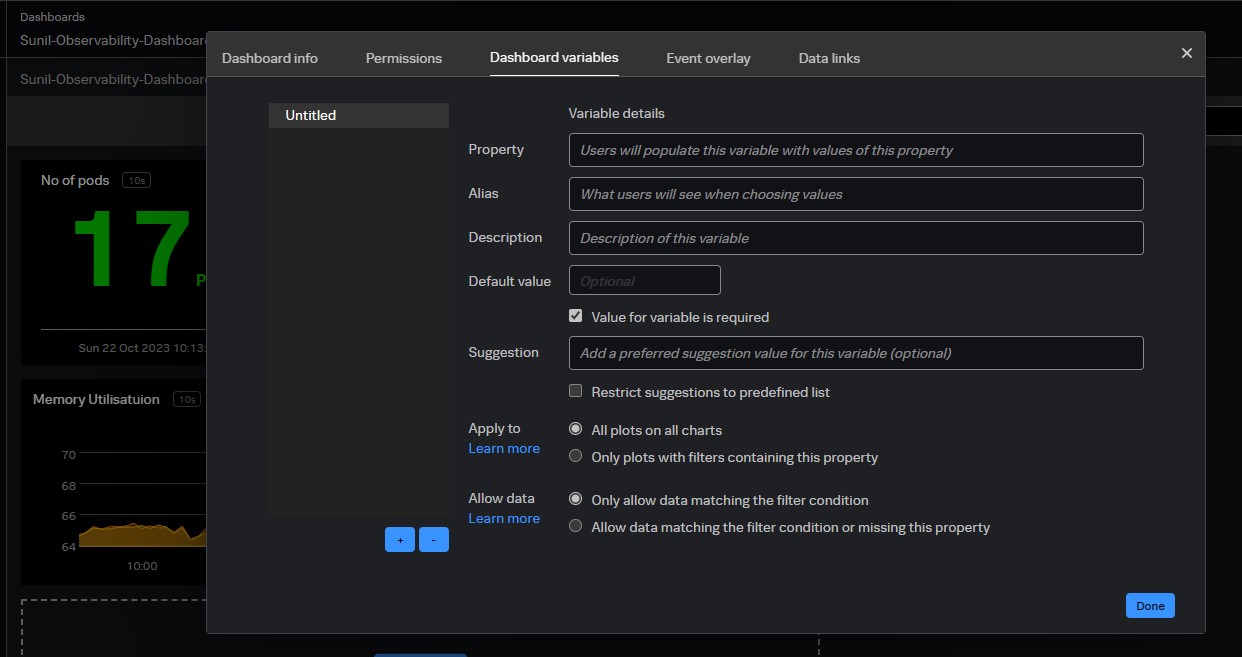
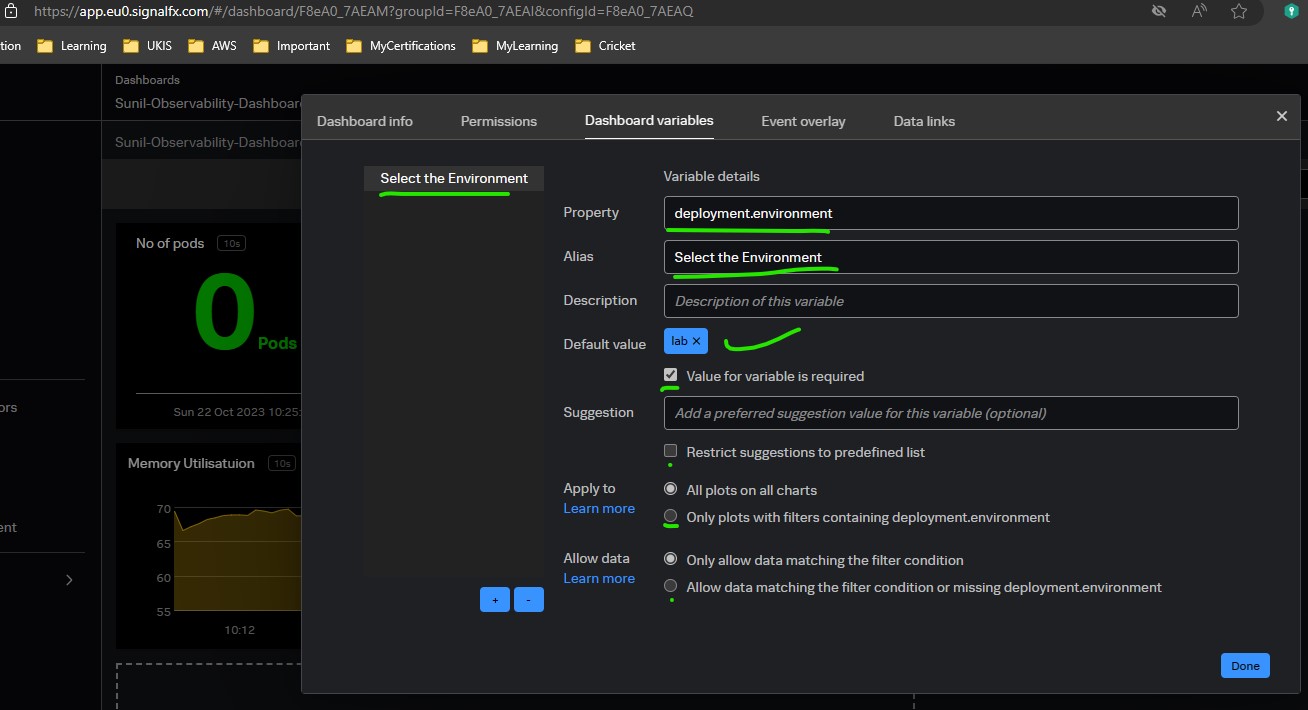
Dashboard variables
It allows to reuse the same dashboard in multiple context. For ex if multiple applications sending same metrics with application name as dimension, each application team can use the same dashboard but filtred for thier application. You can create a dashboard variable for the application name. The dashboard variable appears as a predefined filter on the dashboard. Instead of searching for the key and then the value to filter on, the user can select the relevant application from the dashboard variable.
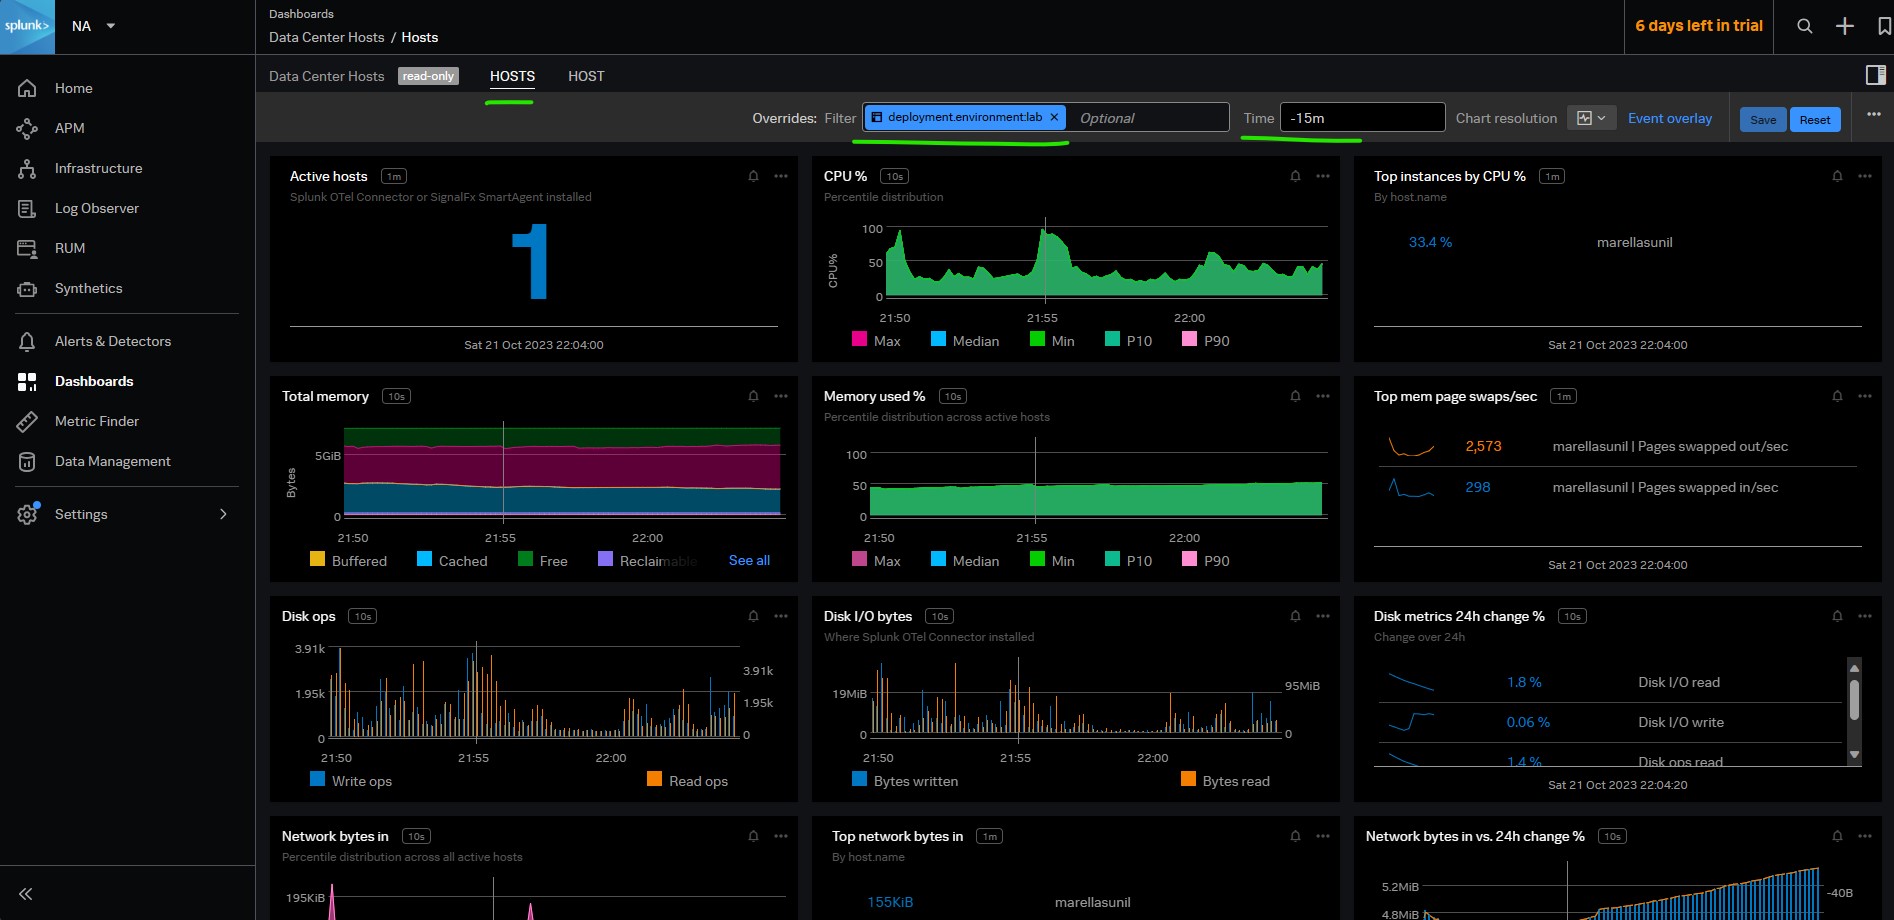
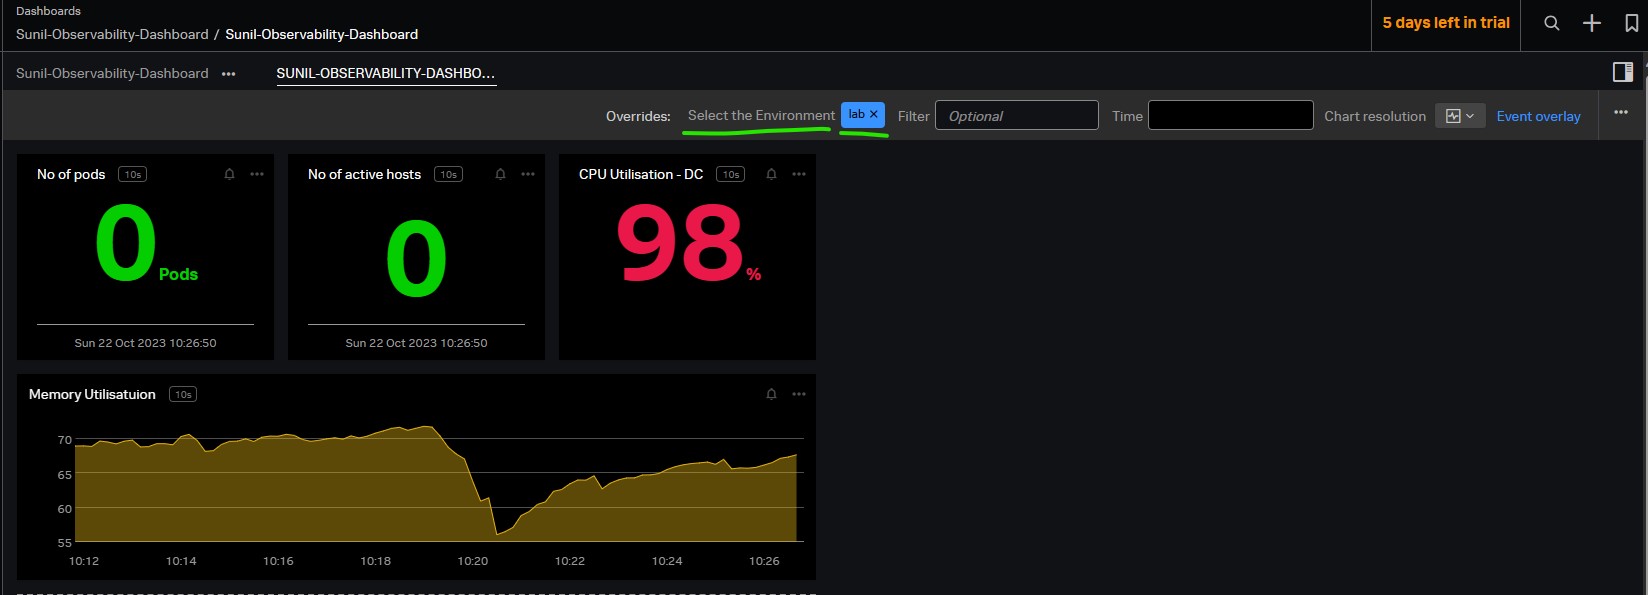
Dashoboard Settings
- Time range
- Chart resolution (Default 10sec)
- Filter (use ! to represent boolean NOT)
- Group by
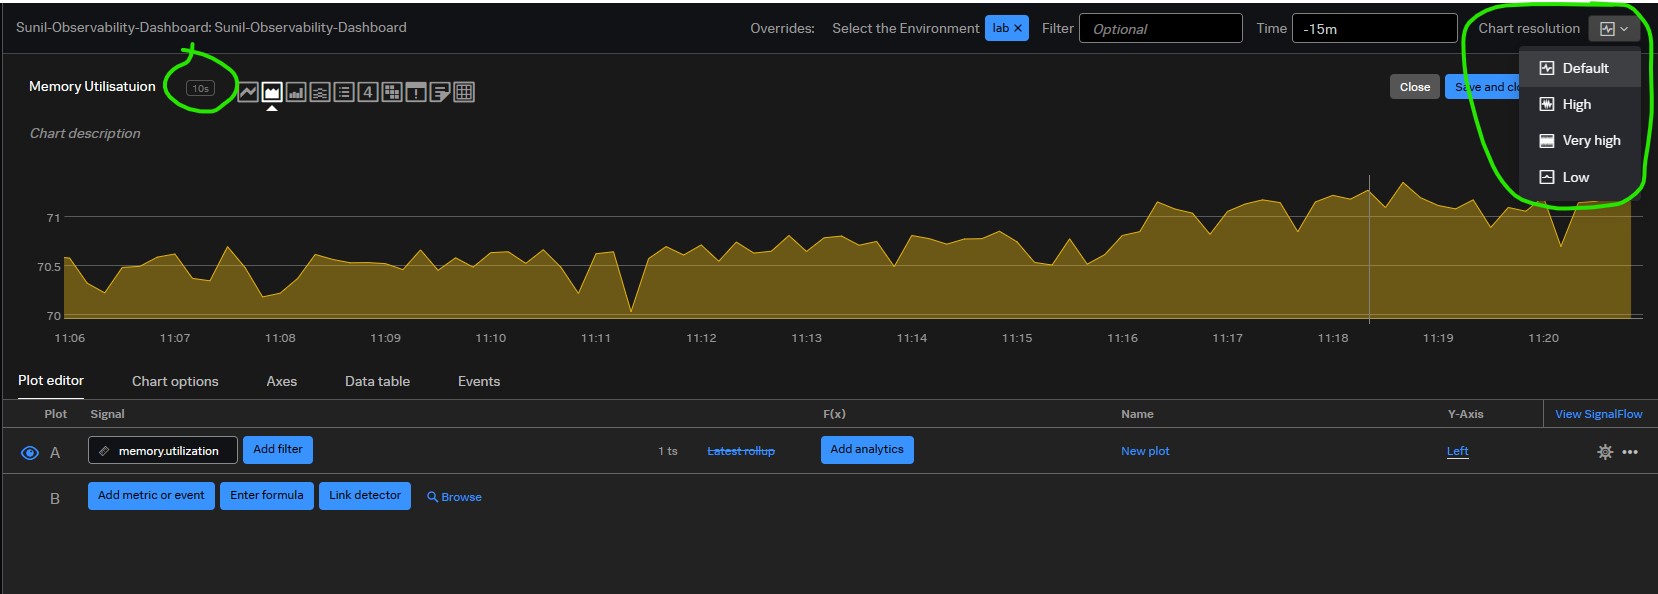
Chart resolution
Types
- Native resolution
- Chart resolution
Chart resolution Values:
- Default - 10 secs
- High - 1 point per secs
- Very high
- Low - 1 point per day
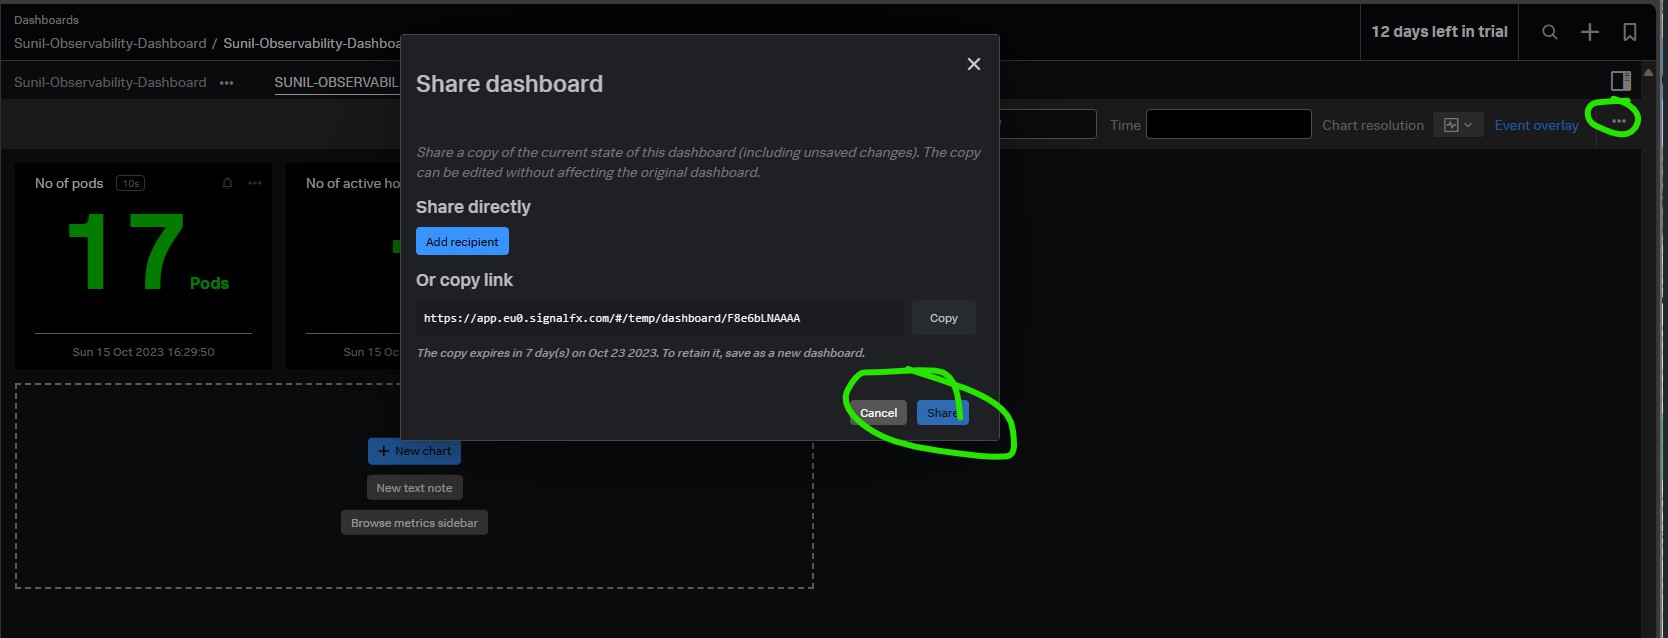
Sharing the dashboard
When you apply filters, select a value for a dashboard variable or change the time range, these parameters are added to the dashboard URL. You can share the dashboard URL with other members
Built-in Dashboards
Ex:
Best pracices for creating dashboard
- Use single-instance and multi-instance dashboards.
- Single instance dashboard for individual & Multi-instance dashboard for accross all.
- Avoid dashboard clutter.
- Do not create individual dashboard for each element. Instead create a defaut dashboard variable that allow user to change the view to the desired.
- Publish dashboards to share with your organization.
- Establish a style guide for your organization
- Plan ahead to avoid blank charts
Dashboard variables
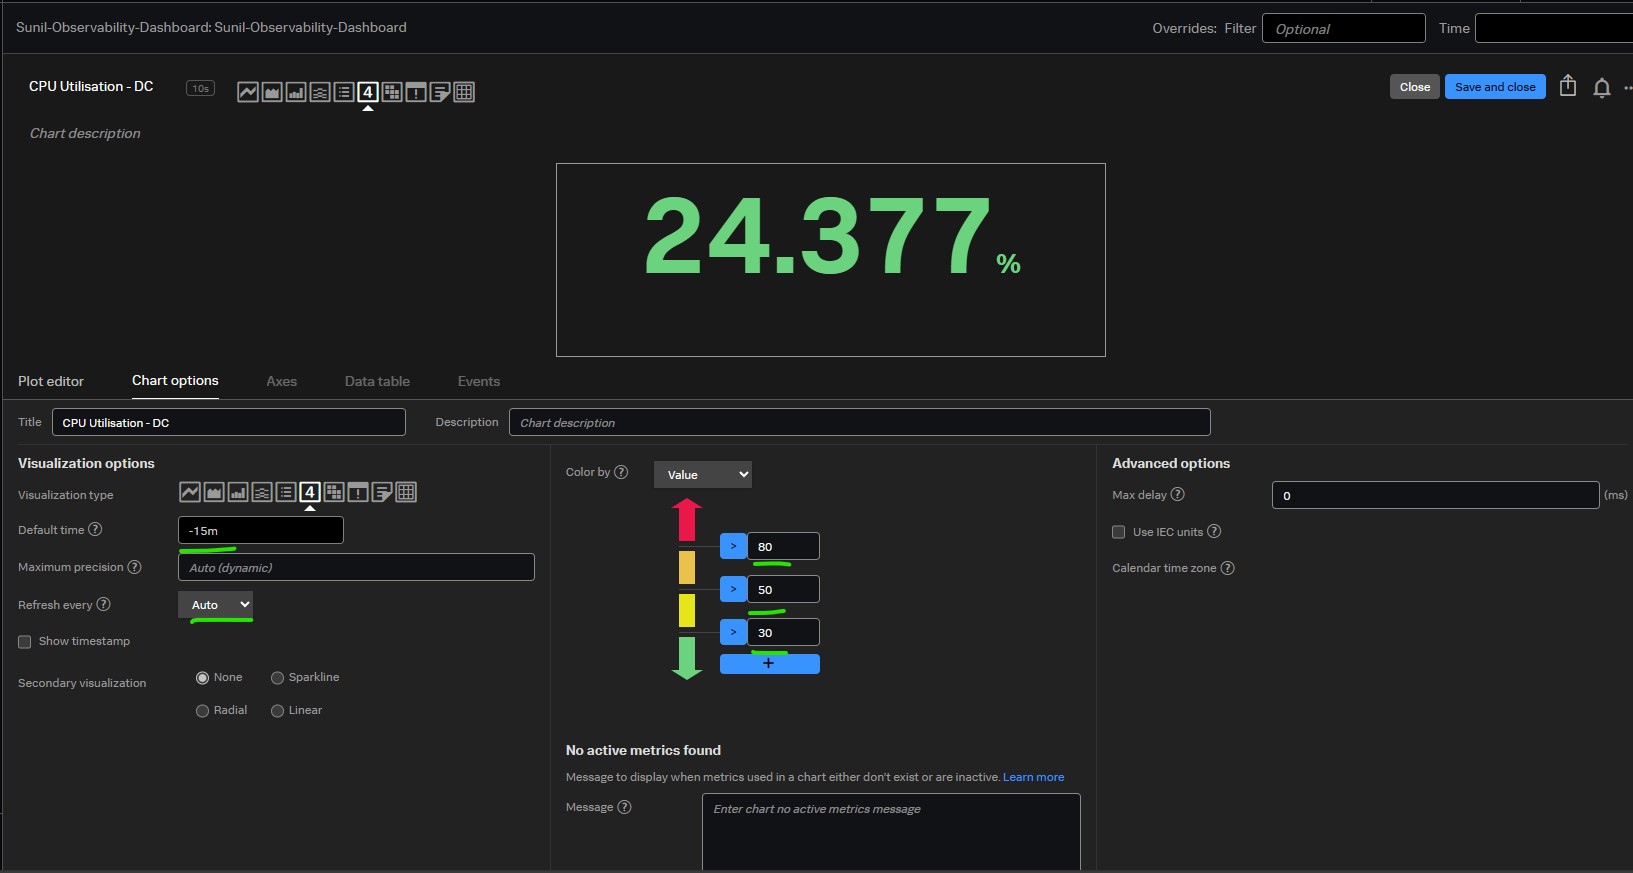
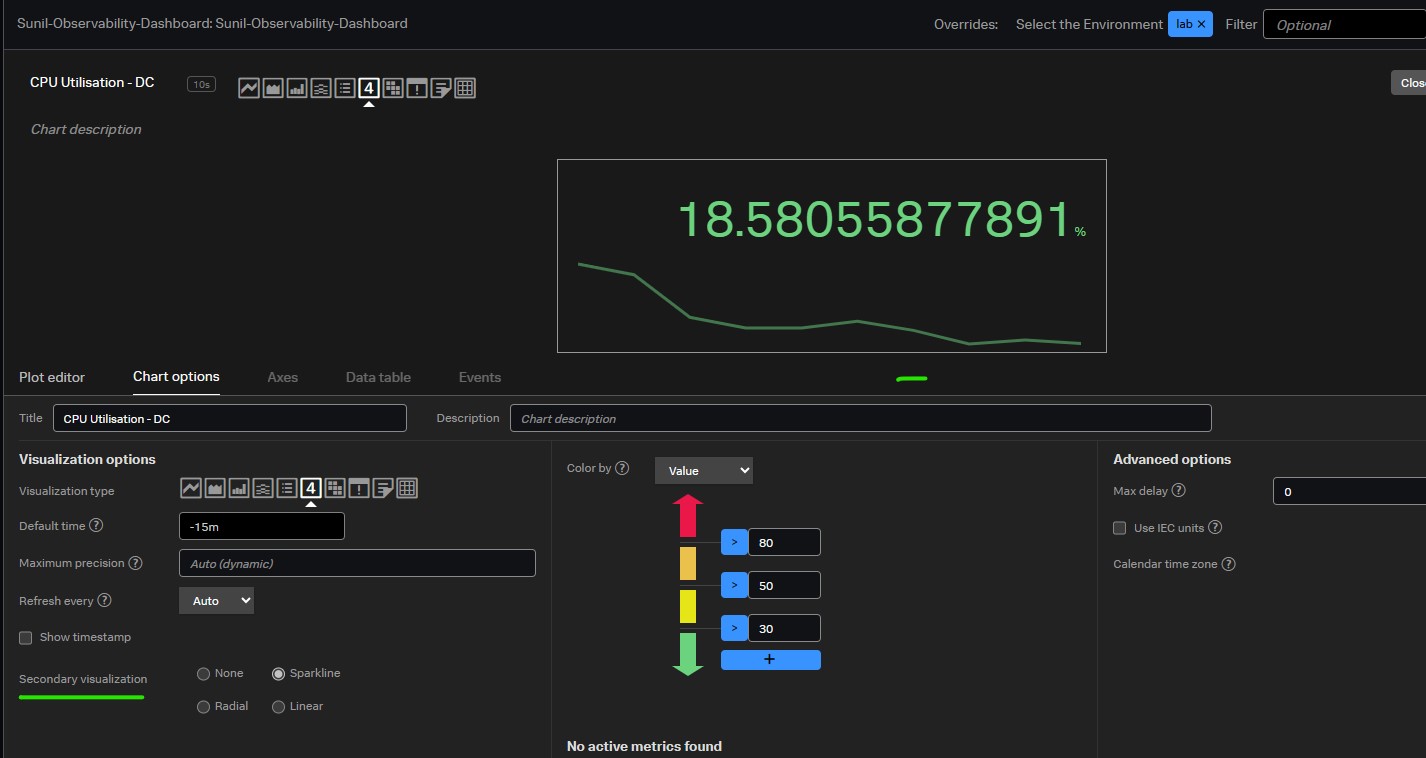
Secondary visulaisation
Secondary visualizations are available for Single Value and List charts
Mirrored Dashboards
Mirror dashboards allows you to add the same dashboard to multiple groups or multiple times to the same dashboard group.
- All mirrors of a dashboard contain the same charts and chart layout, and the same list of available dashboard variables.
- You can edit a dashboard from any of its mirrors. Any changes made to it are visible in all mirrors.
- You can change the dashboard name, filters and modify dashboard variables for each mirror without affecting other mirrors.
Dashboard Mirrors and Write Permissions
If anyone makes a change to a mirror, it affects all mirrors. You can restrict who can make changes to mirrors by setting appropriate permissions
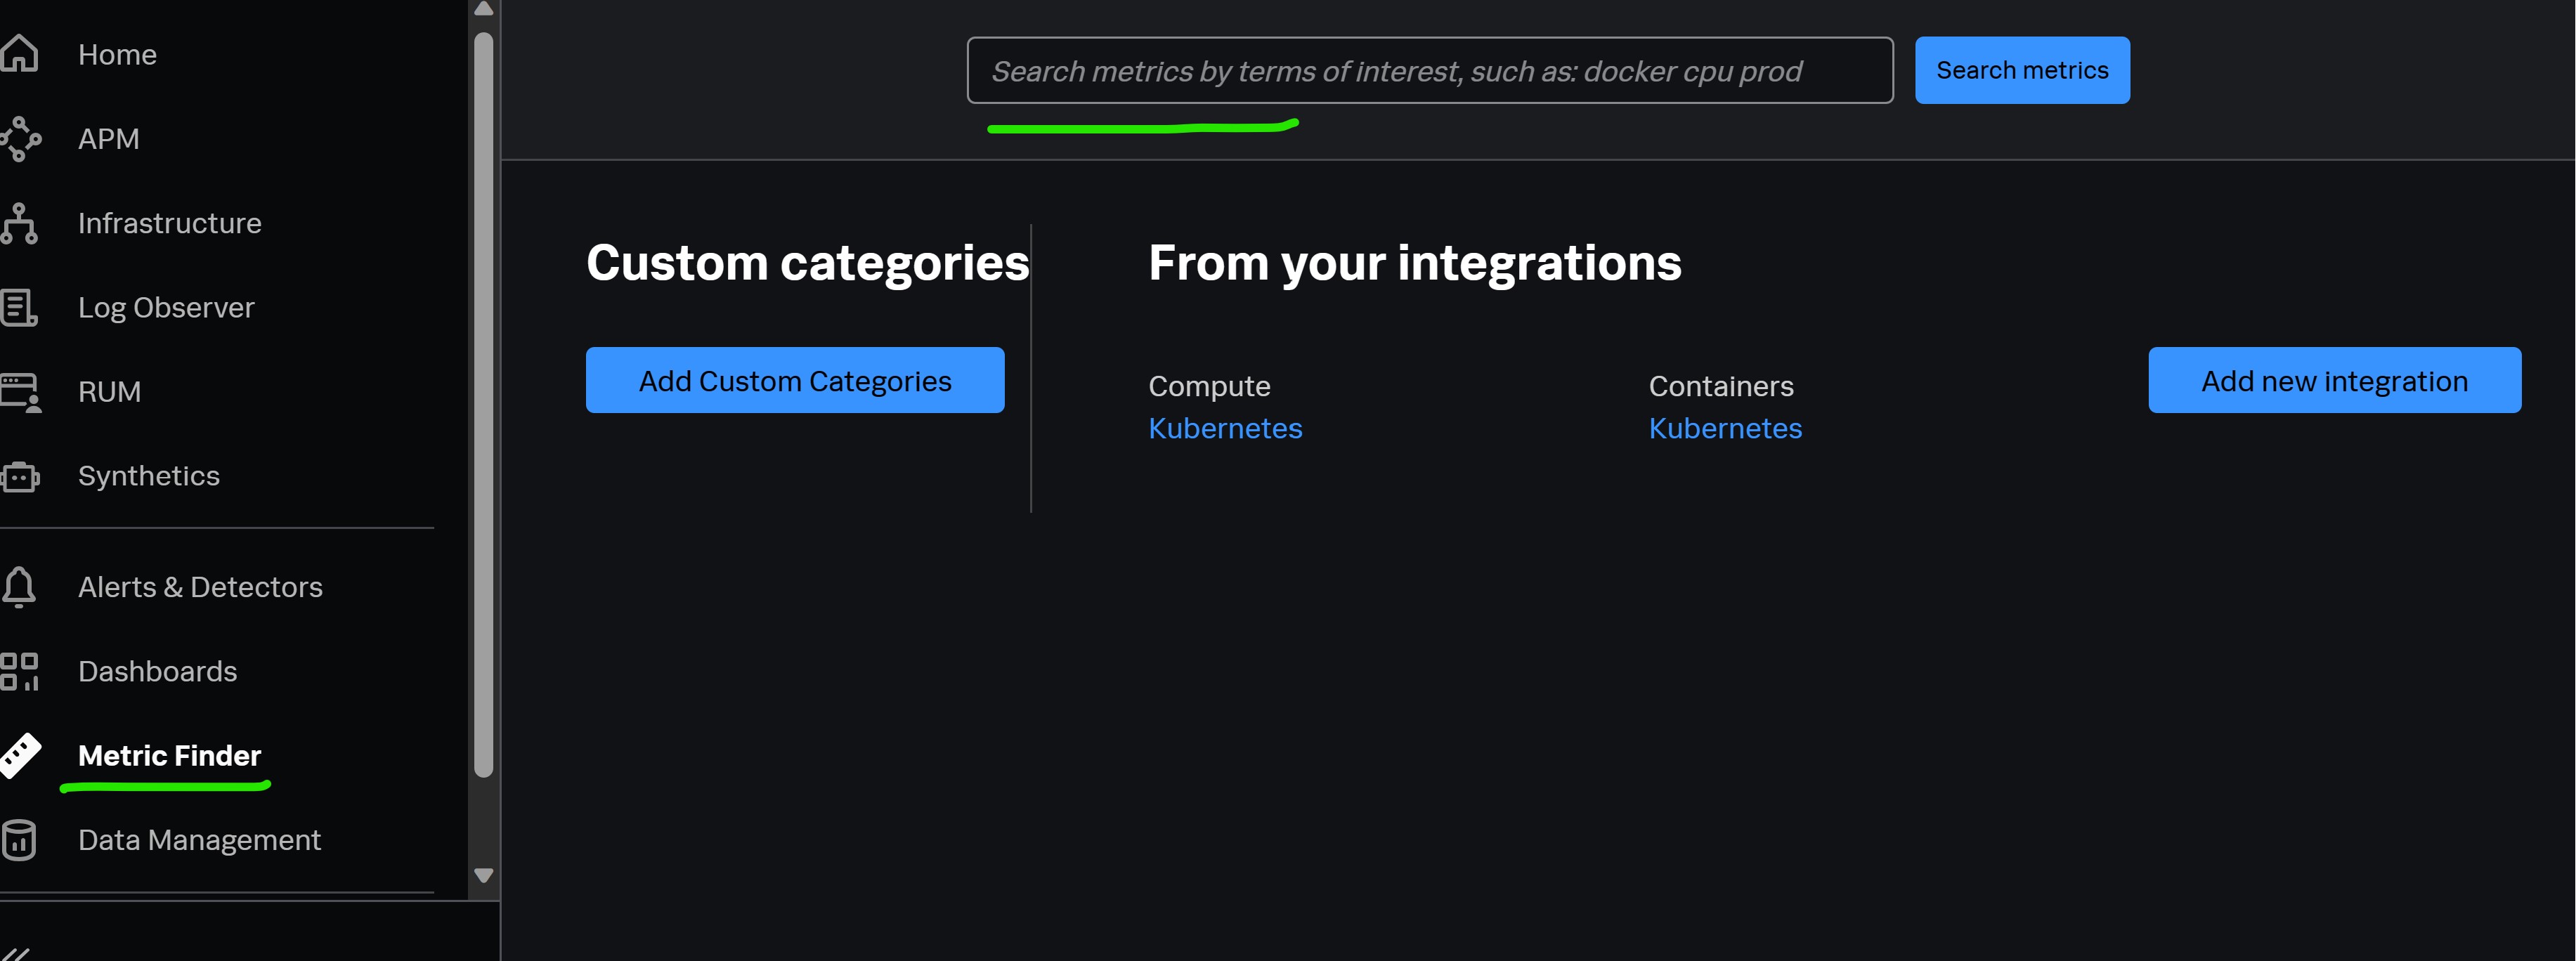
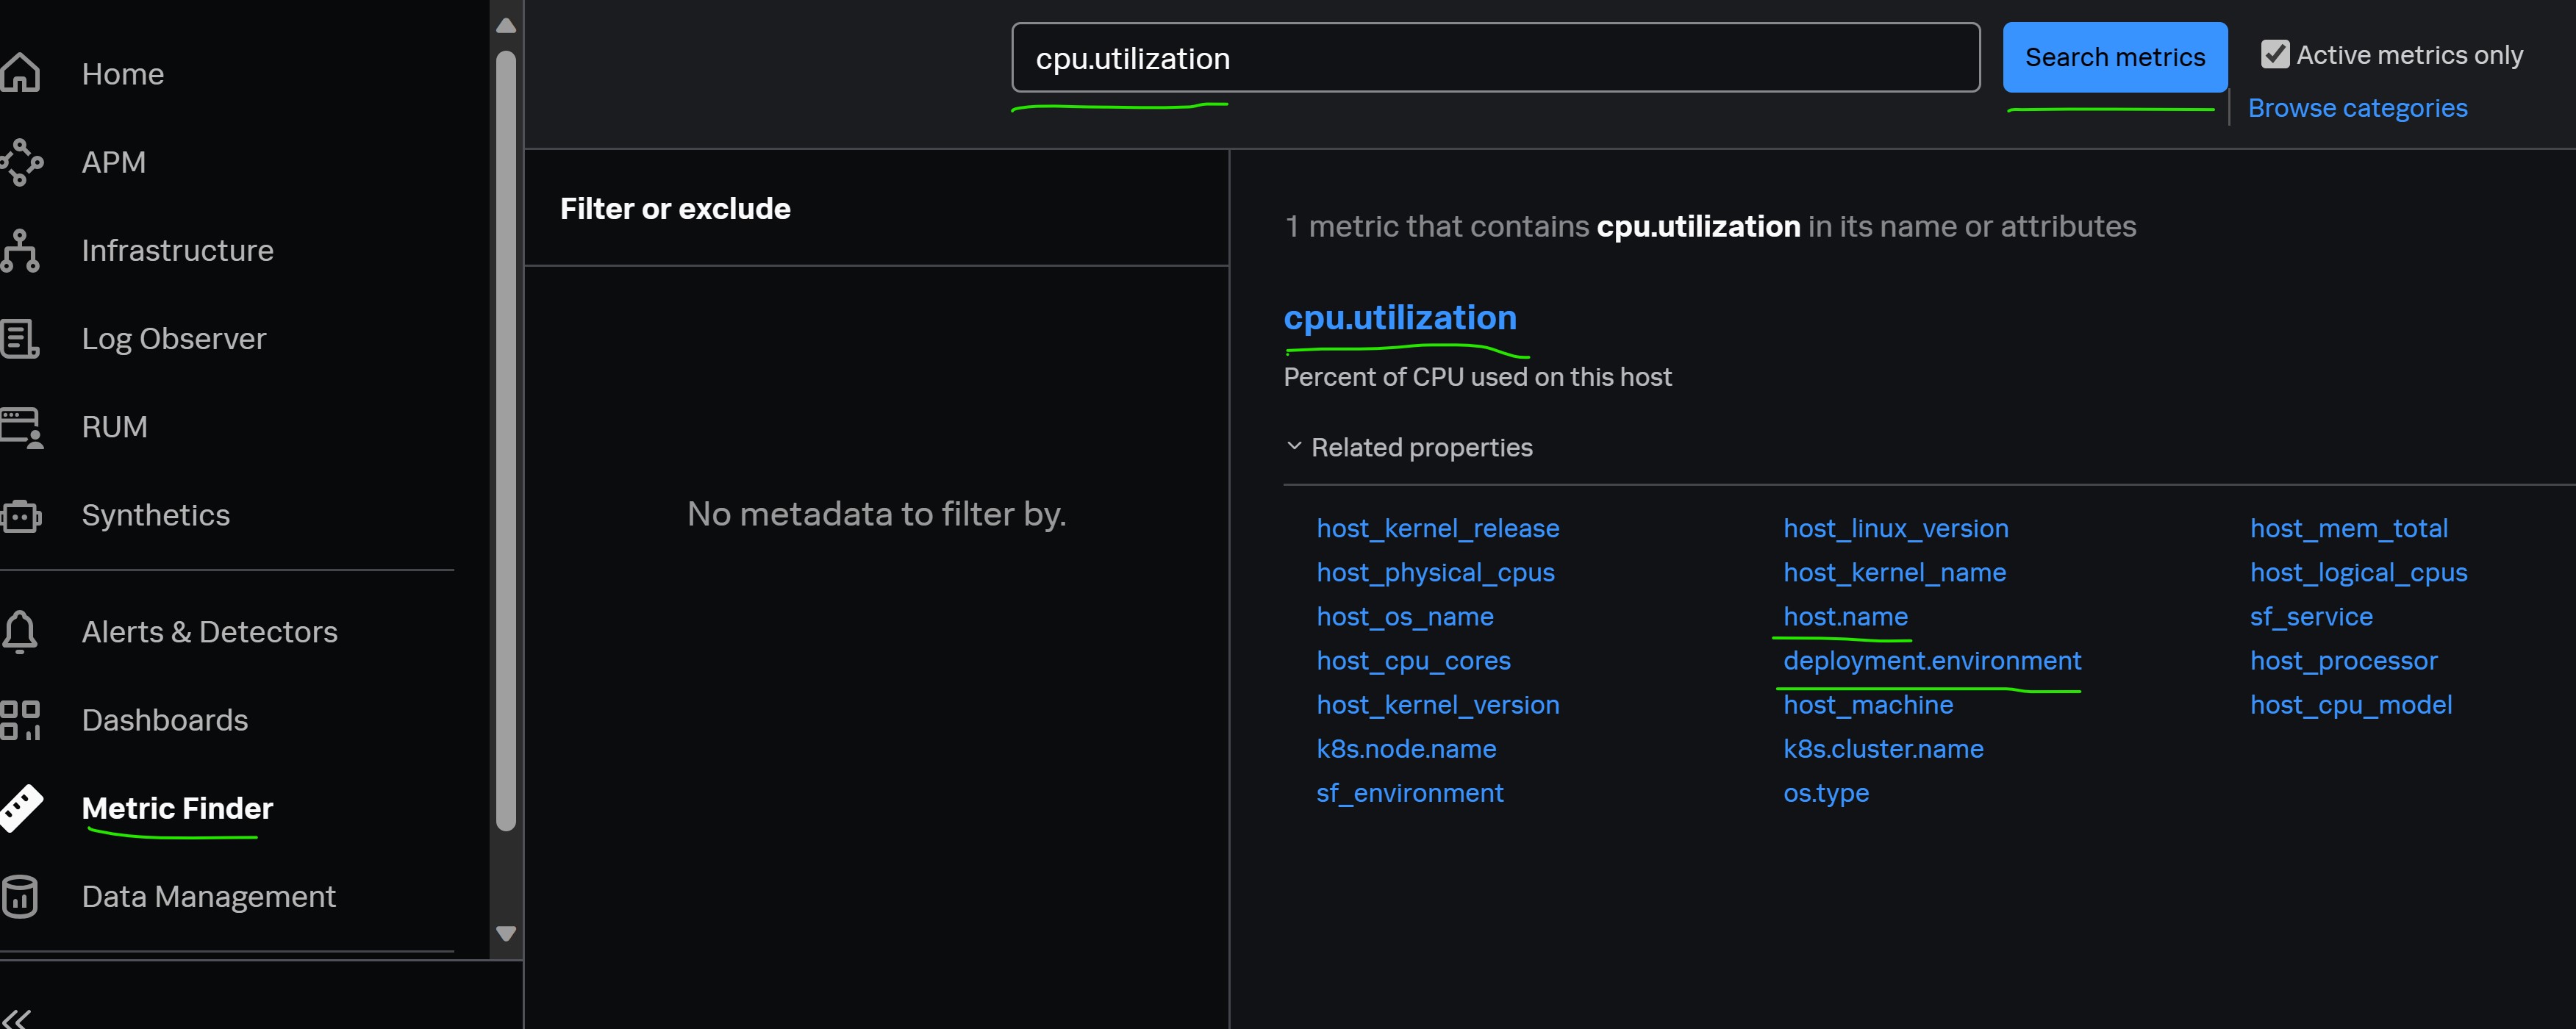
Metric Finder
To find more information about a metric or to see if data points for that metric are coming in, use the Metric Finder