MyObservability
Introduction
This document provides an introduction to the Dynatrace Software Intelligence Platform. It includes links to various sections such as Infrastructure Monitoring, Application & Microservices, Application Security, Digital Experience Monitoring, Business Analytics, and Cloud Automation. Each section contains subtopics for detailed monitoring capabilities like Host Monitoring, Log Monitoring, Network Monitoring, and Cloud Monitoring.
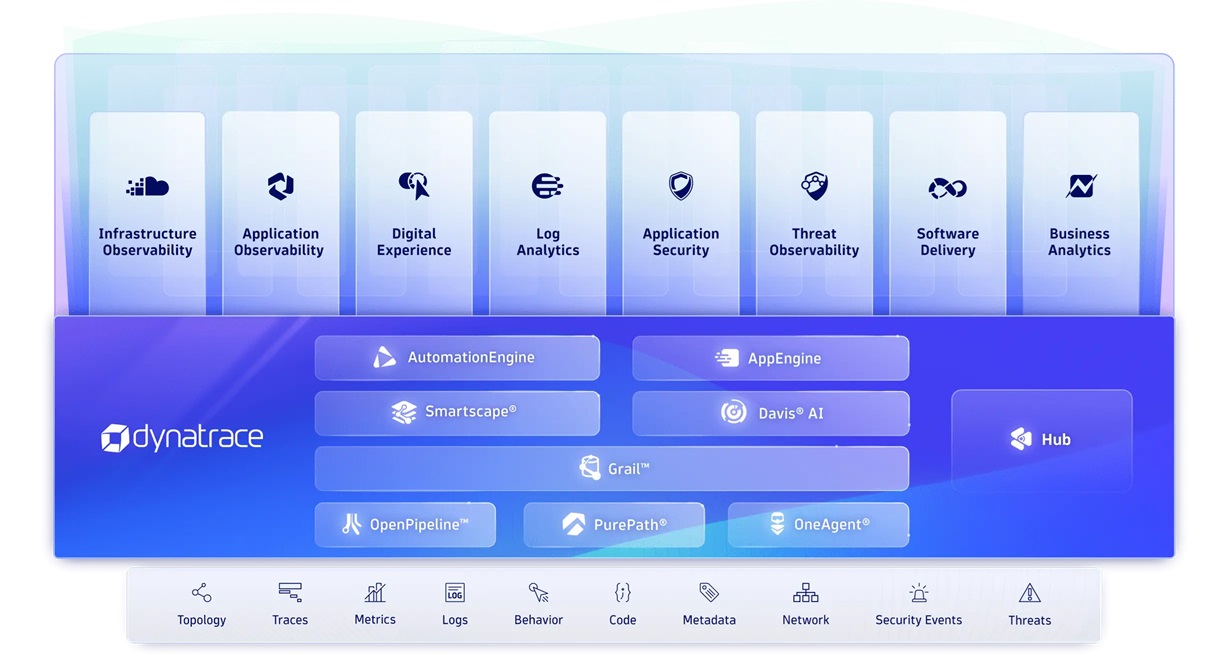
Dynatrace Software Intelligence Platform
- One Agent: Instrument your applications, logs, containers & more
- PurePath: Capture and analyze timing and code-level context for all distributed traces, end-to-end, across the full stack.
- OnePipeline: Ingest, process, and persist observability, security, and business data from any source, in any format, and at any scale.
- Grail: Grail is the Dynatrace data lakehouse designed explicitly for observability data. It acts as a single unified storage solution for logs, metrics, traces, events, and more.
- Darvis & AIOps: Detecting problem automatically.
- Smartscape: Maps out all components and shows you their dependencies in both a vertical (infrastructure) and horizontal (application architecture) view.
- AppEngine: Build custom apps on top of all the observability data collected by Dynatrace.
- Automation Engine: Dynatrace AutomationEngine enables you to combine observability, security, and business data with causal AI to easily automate BizDevSecOps workflows at enterprise scale.
- Hub: Dynatrace Integrations extending Dynatrace capabilities
- Workflows: Allow you to execute and manage multi-step workflows using custom logic to integrate and automate specific task.
- Notebook: Allows you to create powerful, data-driven documents for custom analytics.
How Dynatrace Works
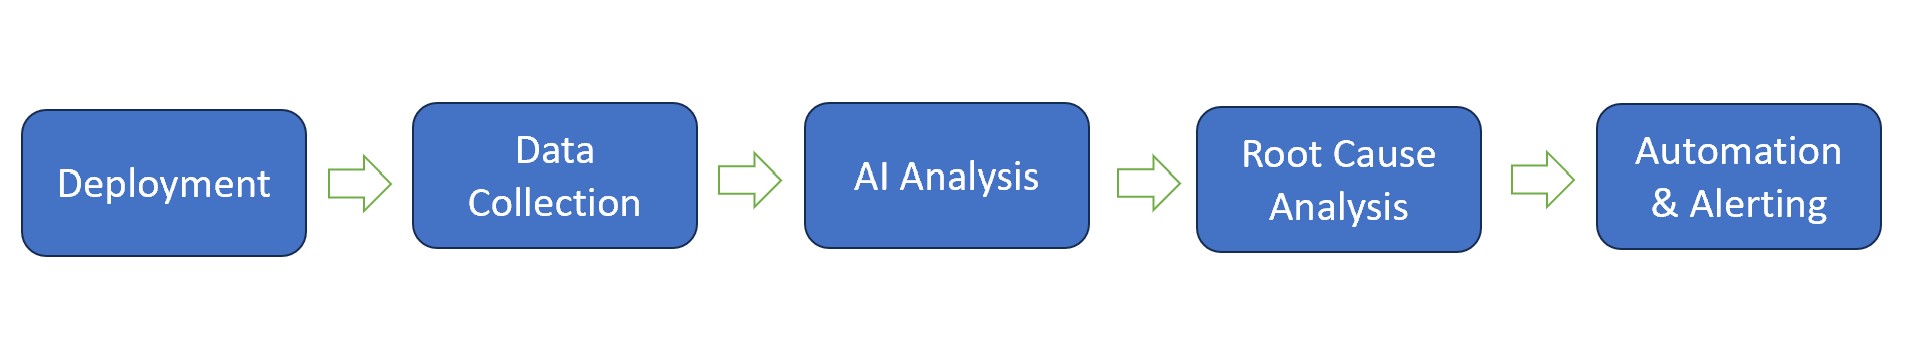
- Install Dynatrace Oneagent (Optionally Activegate).
- Collect data.
- Dynatrace Analyze using AI/ML to identify performance issue.
- Dynatrace provide deep insights into the root cause of performance issues.
- Trigger remediation actions / notify the appropriate.view
OneAgent
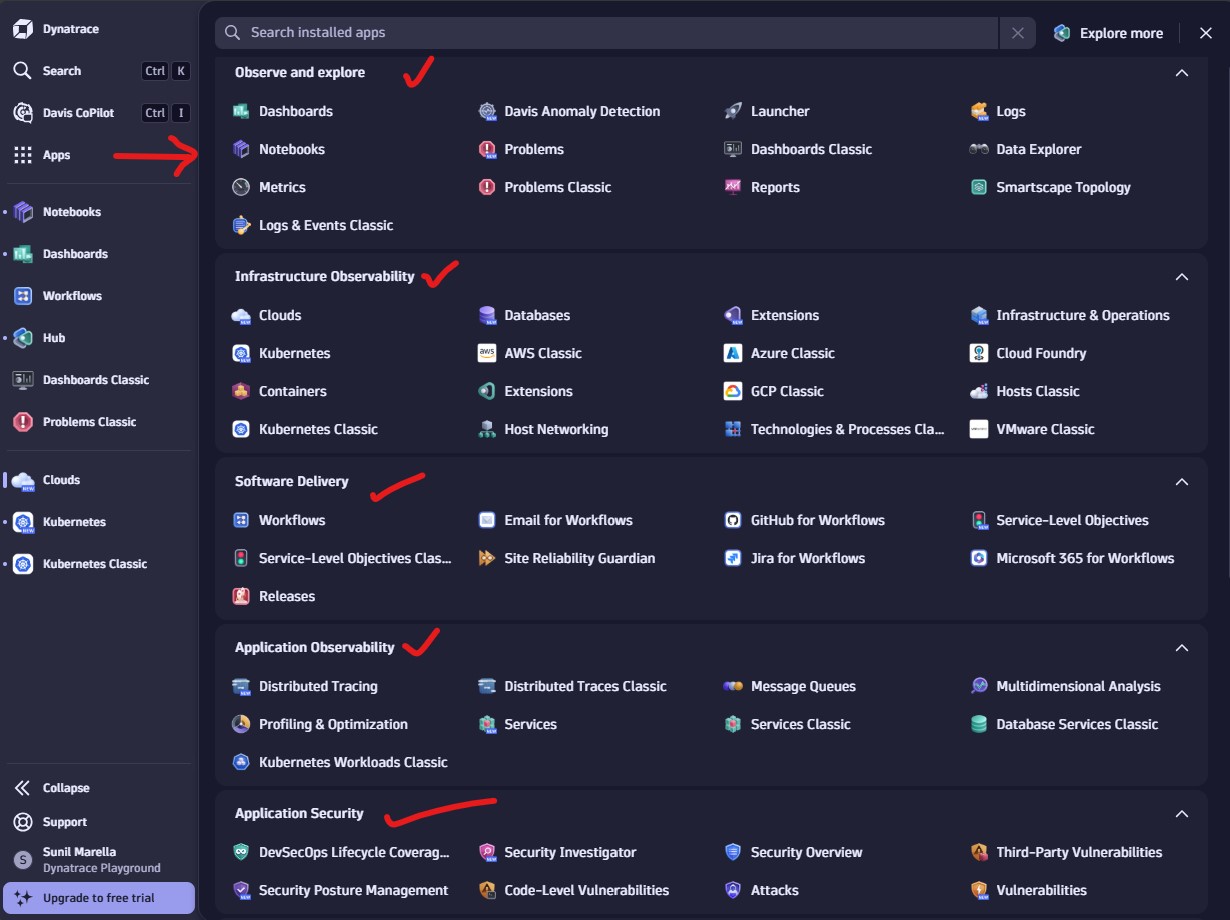
Open Dynatrace -> Deploy dynatrace -> Choose right method
Dynatrace capabilities
Dynatrace can monitor a wide variety of application types across different environments and technologies. Here’s a breakdown of the types of applications Dynatrace can monitor:
- Web Applications
- Java-based applications (Spring, JBoss, WebLogic)
- .NET applications (ASP.NET, .NET Core)
- Node.js applications
- PHP applications (Laravel, Symfony)
- Ruby applications (Ruby on Rails)
- Python applications (Django, Flask)
- Go applications
- JavaScript frameworks (Angular, React, Vue.js)
- Mobile Applications
- Android (Native or hybrid)
- iOS (Native or hybrid)
- Cross-platform frameworks (Flutter, React Native, Xamarin)
- Cloud and Microservices
- Kubernetes and Docker containers
- AWS (Lambda, EC2, RDS, etc.)
- Azure (App Services, Functions, VMs)
- Google Cloud (App Engine, GKE, Cloud Functions)
- Cloud Foundry
- OpenShift
- Server-Side Applications
- Application servers like Apache Tomcat, NGINX, IIS
- Databases (SQL and NoSQL) including Oracle, MySQL, PostgreSQL, MongoDB, Cassandra
- Enterprise Applications
- SAP (ABAP, HANA)
- IBM WebSphere
- Oracle E-Business Suite
- Salesforce
- Microsoft Exchange
- Middleware and Messaging Systems
- Kafka
- RabbitMQ
- ActiveMQ
- IBM MQ
- Custom Applications
- Proprietary applications with custom monitoring using APIs, SDKs, and OpenTelemetry support.
- Virtualized and Cloud-Native Applications
- Monitoring in serverless architectures (e.g., AWS Lambda, Azure Functions)
- VMware (vSphere, vSAN)
- Cloud-native applications in environments like Red Hat OpenShift
- API Monitoring
- Dynatrace can monitor APIs, microservices interactions, and HTTP request flows.
Dynatrace Platform Overview
Next Page: Dynatrace Architecture
Dynatrace : Main Page