MyObservability
Host Monitoring
- Host Performance
-
Process Analysis Process instance snapshots: Dynatrace examines the most resource-consuming processes running on your host and the processes monitored by Process availability.
- CPU, memory, incoming and outgoing traffic in 1-minute intervals.
- Display 20minutes of data - 10 before, 10 after the trigger.
- Each hostonly reports 60mins of metrics perday
- OS Service Monitoring: OS services in undesirable states both for Windows and Linux systemd
- Disk Analysis
- Network Analysis
- Memory Analysis
- Events, Logs, Log sources
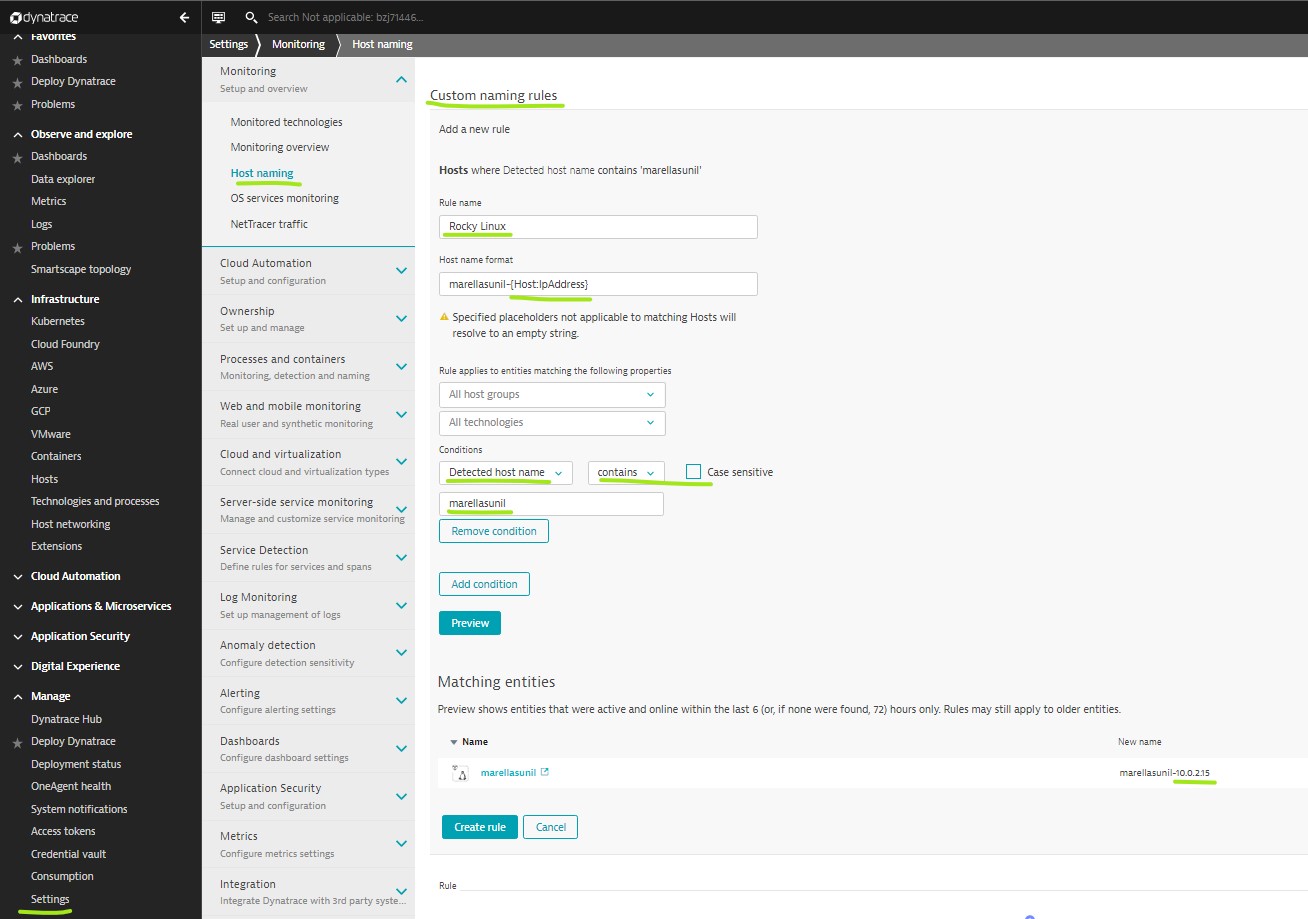
Host settings: Manage -> Settings -> Host naming -> Custom naming rules
All settings:
- Host Monitoring: Monitoring OneAgent automatically monitors host, its processes, services and applications but you can switch off monitoring, disable full-stack monitoring or auto-injection.
- Container Monitoring: Enable/disable automatic injection of code modules into specific containers.
- Disk options: Disk options settings control the visibility of local disks, NFS disks on your hosts. you can exclude any disk.
- Disk Analytics Extension : This extension allows more detailed visibility on local datastores and their volumes, partitions and raid instances on Linux hosts.
- NetTracer traffic : NetTracer is an open source tool for tracing TCP events and collecting network connection metrics on Linux.
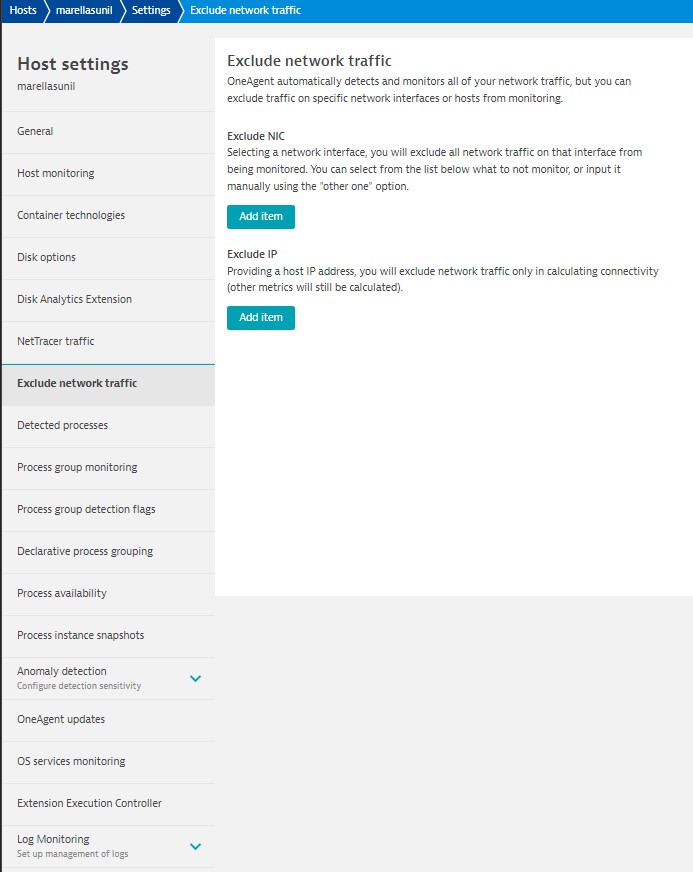
- Exclude network traffic : OneAgent automatically detects and monitors all of your network traffic, but you can exclude traffic on specific network interfaces or hosts from monitoring.
- Anomaly detection for infrastructure: Dynatrace automatically detects infrastructure-related performance anomalies such as high CPU saturation and memory outages. Use these settings to configure detection sensitivity, set alert thresholds, or disable alerting for hosts/disks.
- Log Monitoring: OneAgent Configure OneAgent options for Dynatrace Log Monitoring.
Advanced settings:
- Advanced Memory
- Process crashes
- Memory dump details
- Run oneganet diagnostics
Host availability:
- Up time
- Down time
- Abruptly shutdown - when dynatace looses connection/abruptedly shutdown. A problem will be raised.
- Graseful shutdown - Dynatace will not open any problem.
Monitoring: Host anomaly detection
Main Page: Infrastructure Monitoring
Next Page: Log Monitoring
Dynatrace : Main Page