MyObservability
Infrastructure Monitoring
Intrastructure Monitoring
- Hybrid Cloud Observability
- Fault Domain isolation
- Serverless, container. pod & network
After deploying one agent, Dynatrace begin monitoring host, VM, Container, network, events & logs.
Dynatrace Infrastructure Monitoring
- Kubernetes
- Cloud Foundry
- AWS
- Azure
- GCP
- VMWare
- Containers
- Hosts
- Technology & Processes
- Host Networking
- Extensions
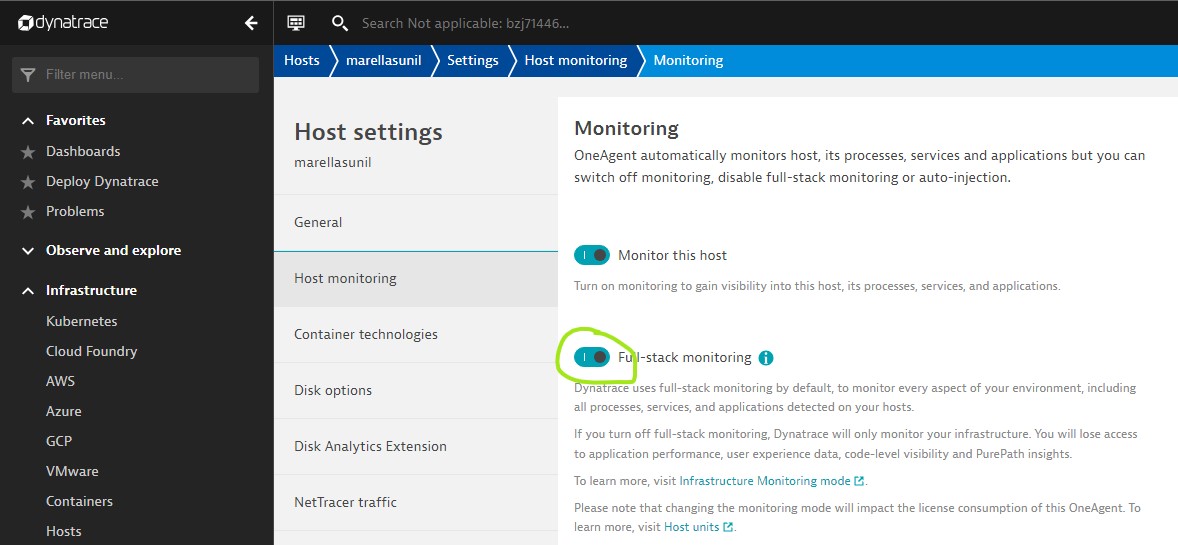
You can select Dynatrace to monitor infrastructure only.
Dynatrace AI for Dynamic Environment
Using Dynatrace with other Devops tools, you can auto remediate & self heal issues.
This information can be synchronised with CMDB like Servicenow.
Dynatrace Extensions
Sometimes you may need visibility of additional components.
It may be
- A Incompatible technology
- Service from cloud provide
- Application with little insights (Like Native applications)
- Hardware appliances (Like load balancer etc)
So you can extend dynatrace reach
- Oneagent extensions
- Active gate extensions
Rule:
One agent extension + Active gate extension + SDK + API + OpenKit = Dynatrace extended.
Refer: Active Gate for Activegate extenstion installation.
How to create JMX Extension
The Dynatrace you can monitor any JMX metric exposed via mbean.
Dynatrace UI -> Settings -> Monitored technologies -> Add new technology monitoring -> Add JMX/PMI extension -> Use editor or create from scratch.
Using JMX/PMI extension editor:
- Extension name
- Add metric source
- Select relevant technology
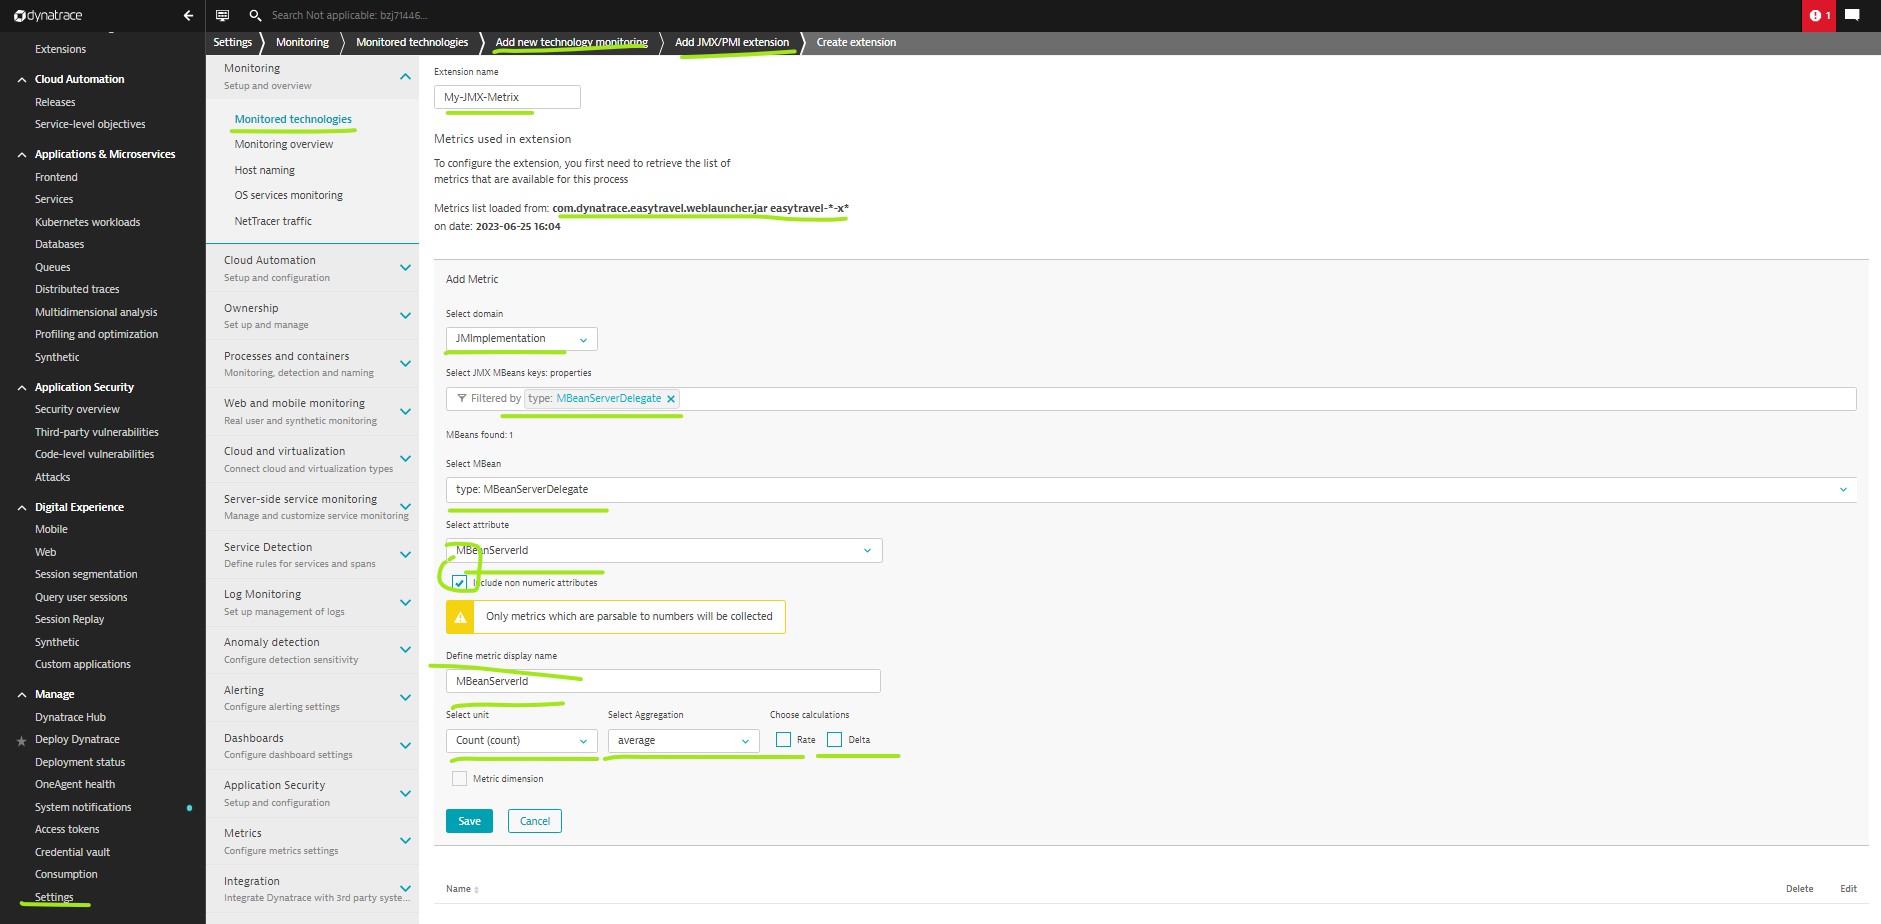
You may need to limit the extension to specific host. Disable global use.
How to create one agent extension
« - To be updated - »
SDKs
Digital touchpoint monitoring:
By providing you with a set of open source libraries, OpenKit enables you to instrument the digital touchpoints in your environment that aren’t detected automatically by OneAgent. This means you can monitor the usage, performance, and user sessions of traditional rich-client applications, smart IoT applications, Alexa skills, and much more.
OneAgent SDK: Capabilities
- Trace incoming and outgoing remote calls and web requests
- Trace database requests
- Trace in-process asynchronous execution
- Trace queues and messages
- Capture request attributes.
You can find SDKs in Github.
« - To be updated - »
Next Page: Application & Microservices
Main Page: Click Here