MyObservability
Network Monitoring
Provides visibility and insights into the performance and quality of your network communications between hosts and processes. Dynatrace monitors process-to-process network communications.
Dynatrace monitors the overhead generated by network monitoring and throttles it if it increases above 5% of available CPU. The network module is then paused for slightly less than 3 minutes and re-enabled. If the threshold is still exceeded, then paused for 6mins (Twice then after up to max of 45mins)
Path: Infrastructure -> Host Networking
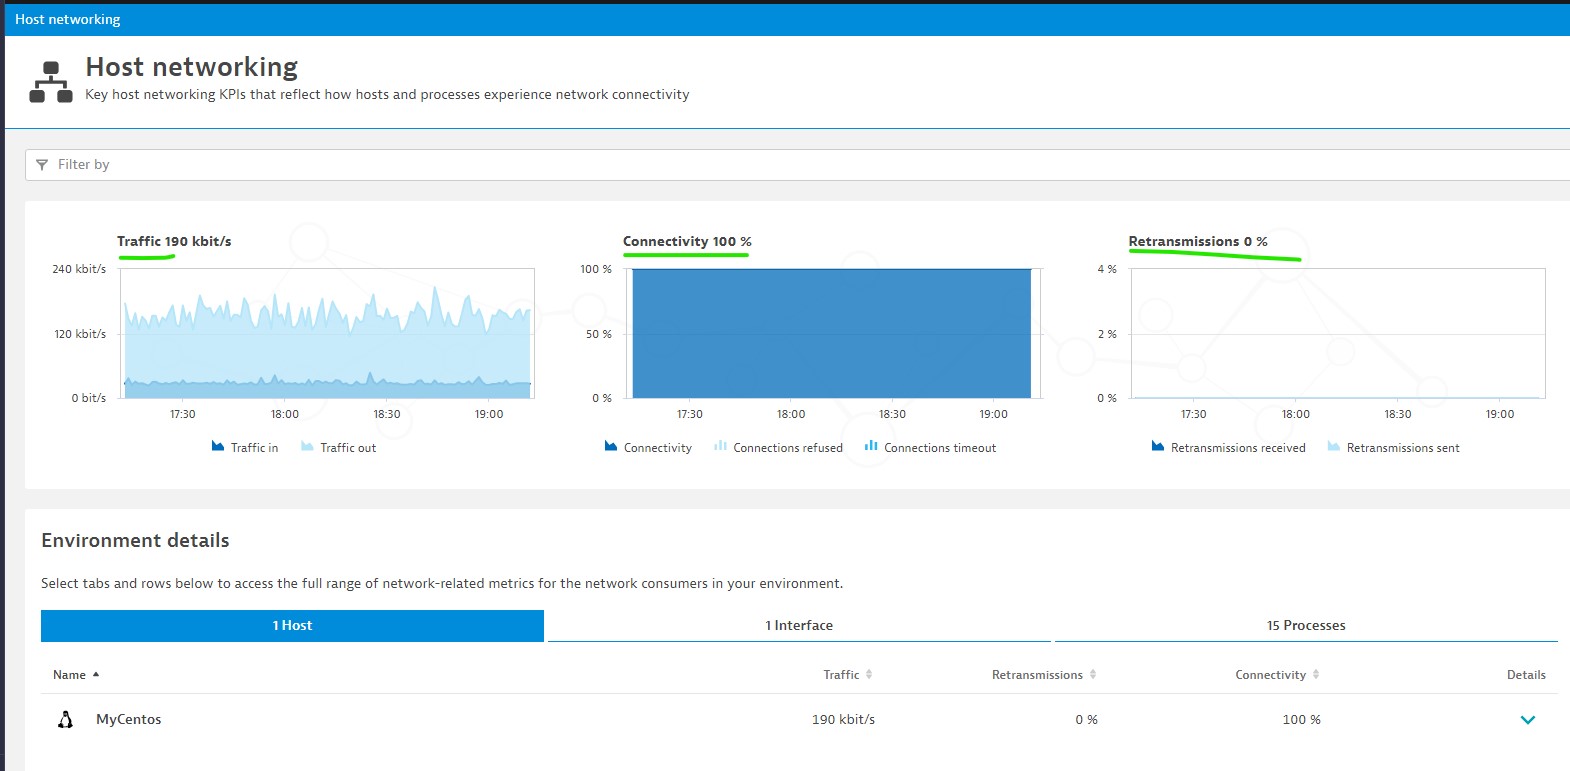
Types:
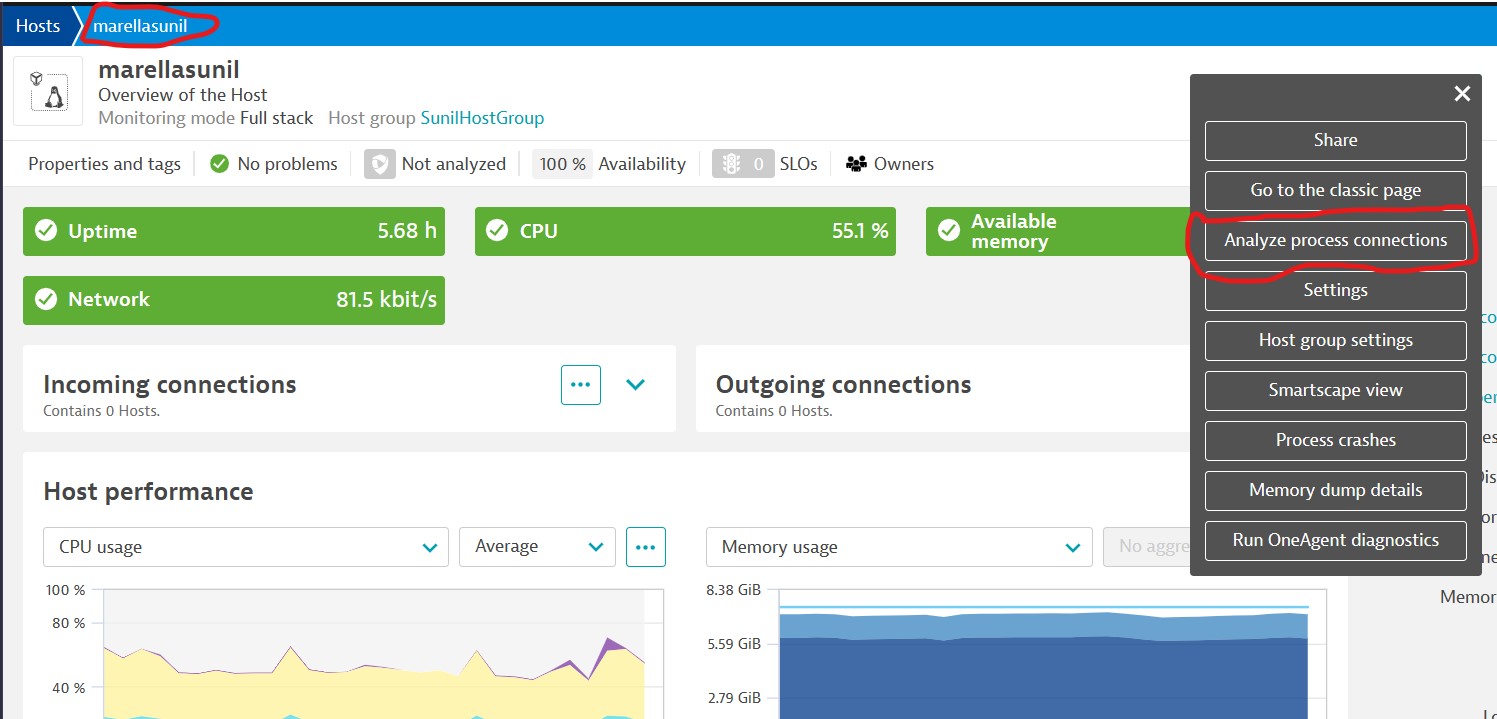
- Analyze process connection (Host)
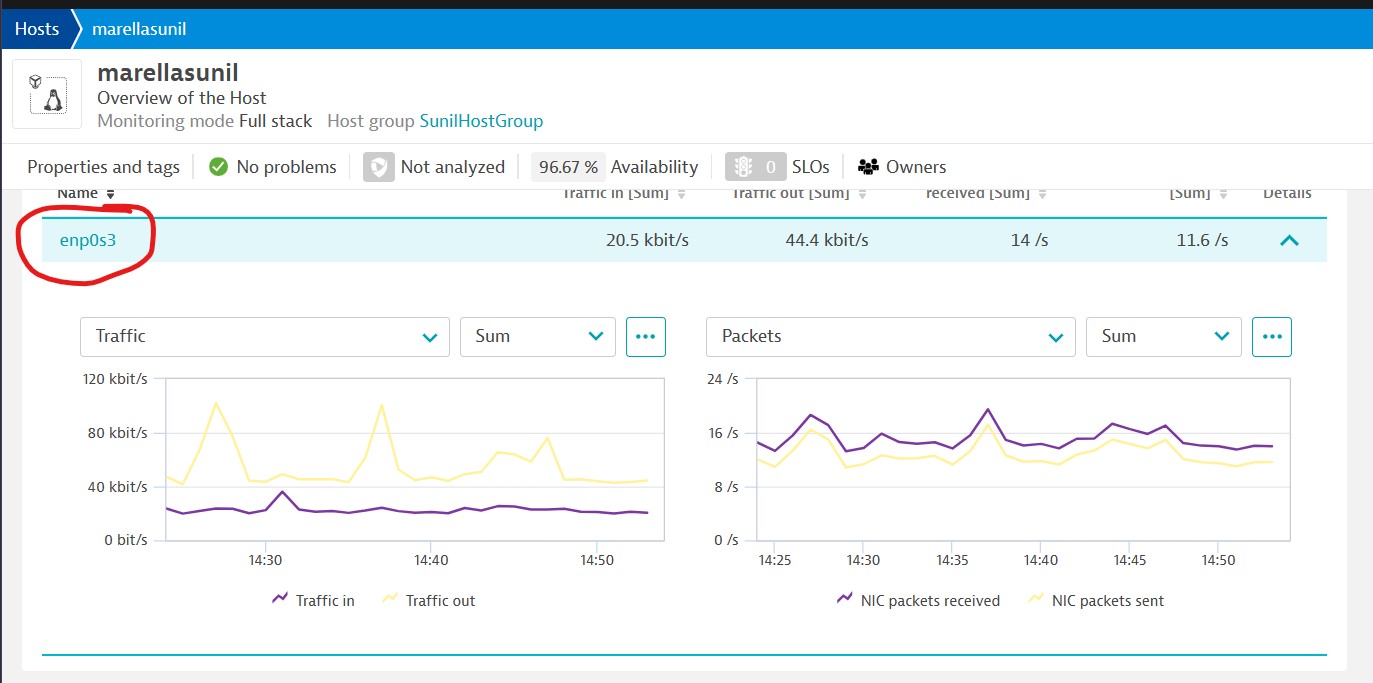
- Communication based monitoring (Interface - eth0, eth1 etc)
- Process level Monitoring (Process)
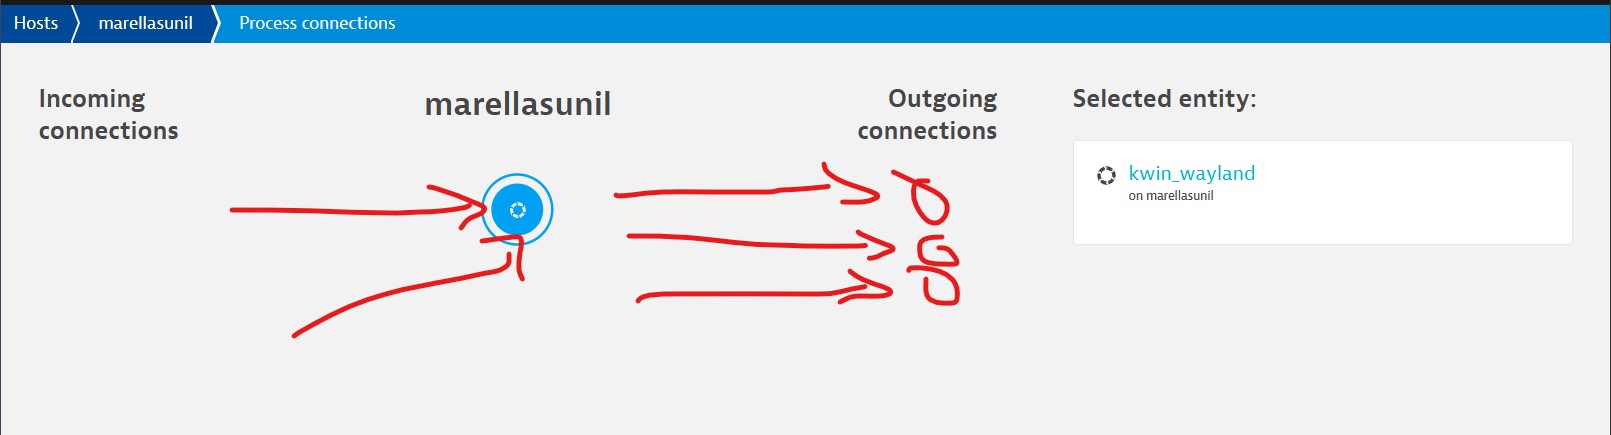
Analyze process connection
View all connections made and received by the host. Select any process node (the middle column) to view relevant network metrics for that process’ connections (displayed in the right-hand pane). For each connection, you’ll see network Transfer, Connectivity, and Retransmissions rates.
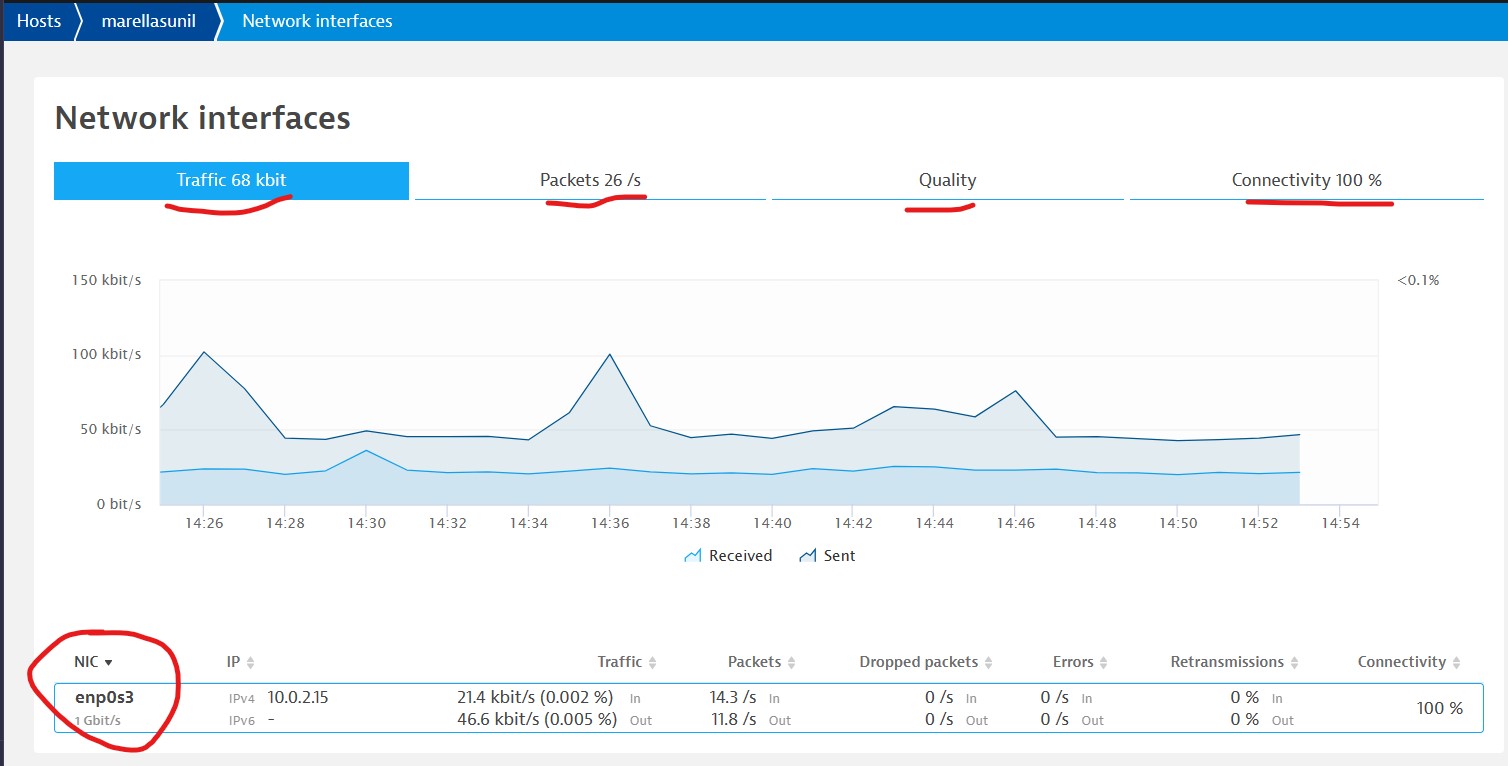
Communication based monitoring (Interface)
Main Page: Infrastructure Monitoring
Next Page: Cloud Monitoring