MyObservability
Services
- Introduction
Introduction
Applications built upon services the process requests like web requests, web service calls and messaging. One agent detects and names services, organizing them by type, technology and within process groups.
Services monitoring capabilities
In Dynatrace, services are a key component of application monitoring. A service typically represents a set of monitored transactions or requests that share a common purpose, such as a web service or a database query handler. Dynatrace provides deep monitoring and observability into these services across various layers of an application. Here’s what can be monitored under services in Dynatrace:
- Service Requests
- Request Count: Dynatrace tracks the total number of requests handled by a service.
- Request Latency (Response Time): It monitors how long a service takes to process requests. You can set thresholds to alert if the response time exceeds acceptable limits.
- Error Rates: Monitors the percentage of requests that result in errors, such as HTTP 4xx or 5xx status codes.
- Throughput (Requests Per Minute): Measures the number of requests processed by a service over a specific time period.
- Service Performance
- Service Response Time: Dynatrace tracks the average, median, and slowest response times for all service calls.
- Service Load: Measures the workload of a service, such as concurrent users or transactions.
- Apdex Scores: This is a user satisfaction metric based on response time thresholds (satisfied, tolerating, frustrated). It helps quantify user experience.
- Service Dependencies
- Upstream and Downstream Dependencies: Dynatrace visualizes how services are connected and interact with one another. This includes seeing which services call others and which databases or external services they depend on.
- Service Flow: Dynatrace provides an overview of the service flow to show how requests traverse through multiple services in a multi-tier architecture.
- Service Error Detection
- Automatic Error Detection: Dynatrace automatically detects service errors such as exceptions, crashes, and other anomalies. It can identify problematic methods or external calls that are failing.
- Error Types: Monitors and categorizes errors (e.g., SQL exceptions, HTTP errors, timeout errors) that occur during service execution.
- Database and Query Monitoring
- Database Calls: Tracks database queries made by the service, including execution times and slow queries.
- SQL Statement Monitoring: Captures specific SQL queries executed by the service and analyzes their performance.
- Database Load: Measures the impact of a service on the underlying database, such as the number of connections or transactions per second.
- External Services
- Third-Party Service Monitoring: Monitors calls to third-party services, including response times and error rates. For example, tracking API calls to external providers (like Stripe, AWS, etc.).
- xternal Service Latency: Tracks the latency involved in calling external services to ensure third-party dependencies are not causing performance bottlenecks.
- Service Method-Level Monitoring
- Method Hotspots: Dynatrace provides method-level monitoring, allowing you to identify slow or resource-intensive methods within a service.
- Method Execution Time: Tracks how long each method or function within a service takes to execute.
- Failed Method Calls: Captures information on method-level failures, such as thrown exceptions.
- Distributed Tracing
- Request Tracing Across Services: Dynatrace follows a request through multiple services and components using distributed tracing. It shows how long each part of the transaction takes and highlights slow or failing services along the way.
- Trace Propagation: It tracks request propagation and correlates logs with traces for a full view of service interactions.
- Service-Level Monitoring for Microservices
- Container Monitoring: If the service runs inside containers (e.g., Docker), Dynatrace can track container performance metrics, including CPU, memory, and disk usage.
- Kubernetes Monitoring: For services running in a Kubernetes cluster, Dynatrace provides in-depth visibility into the health and performance of the services running in pods, along with cluster performance.
- Security Monitoring
- Runtime Vulnerability Detection: Monitors for security vulnerabilities in the service, such as outdated libraries, security misconfigurations, or known CVEs (Common Vulnerabilities and Exposures).
- Runtime Application Self-Protection (RASP): Monitors for real-time attacks (e.g., SQL injection, cross-site scripting) and automatically mitigates security threats.
- Key Requests Monitoring
- Key Requests: Allows you to designate specific service requests as “key requests,” so they can be monitored more closely. This is useful for business-critical operations or endpoints that need heightened visibility.
- Service-Level Objective (SLO) Monitoring: Dynatrace allows you to define SLOs for key requests to ensure that the service meets the defined performance or reliability criteria.
- Custom Service Monitoring
- Custom Instrumentation: Allows developers to define custom monitoring logic, instrumenting specific methods or transactions that are critical for their application. This is useful for non-standard applications or edge cases.
- Service Dashboards and Alerts
- Service Health Dashboards: Dynatrace allows you to create custom dashboards for service health, showing performance metrics, request data, dependencies, and error rates.
- Alerting and Problem Detection: Dynatrace uses AI-powered Davis (its AI engine) to detect anomalies, deviations from baseline performance, and potential service problems. It sends alerts when issues are detected.
Services
Dynatrace detects services several ways
- Cluster services: When same service is detected running within multiple processes in the same process group, it is represented as a single service running on multiple processes or hosts.
- Separate Services: When the same service is detected in multiple process groups, it is represented as separate services.
- Merged Services: These services can be merged. Dynatrace identifies which services are candidates for merging.
- Opaque services: These services cannot be monitored by Dynatrace but are detected when requests are made to them by other services.

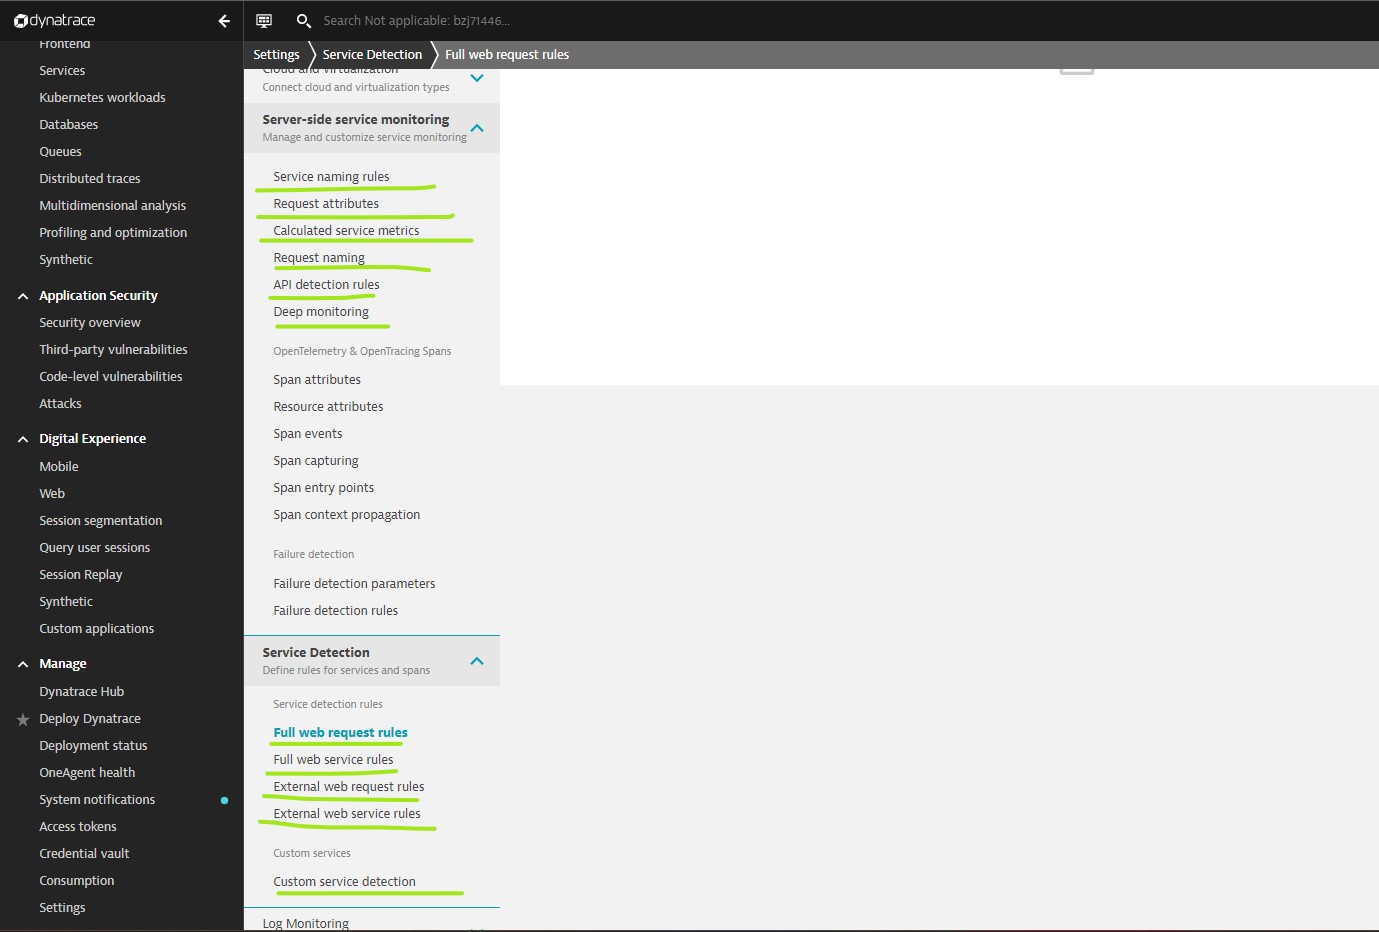
Service Detection
- Automatic services detection
- Custom service settings: If your application doesn’t rely on standard frameworks, you can set up custom services. With a custom service you can instruct Dynatrace which method, class, or interface it should use to gain access to each of your application’s custom server-side services.
- Request attributes settings: Define request attributes to enrich monitored requests with metadata. Request attributes are derived from captured data (Web request URLs, HTTP request headers, and other request metadata) in requests that you define. Request attributes are key/value pairs that are filterable across all Dynatrace service and trace views.
- Service merging settings (Deprecated), use rule-based service detection
- rule-based service detection: Service detection rules for Full Web Requests, Rules are evaluated from top to bottom, and the first matching rule applies. Rule conditions are evaluated before Service Id Contributors are applied. Note that conditions do not modify attributes of requests. If conditions match, then Service Id Contributors are applied.
Others Real-time updates are turned off. Processes affected by method parameter request attributes changes need to restarted. If you want to enable real-time updates, please head to the deep monitoring settings.
Deep monitoring:
- Exclude noisy and unnecessary exceptions.
- Exclude specific incoming web request URLs.
- Real-time updates to Java and PHP services.
- Distributed tracing.
Service naming rules: Naming rules enable you to customize and enhance the default names of your services.
Calculated service metrics: Additionally you might need additional business or technical metrics that are specific to your application. These metrics can be calculated and derived based on a wide variety of available data within the captured trace.
Global request naming rules: Global request naming rules enable you to consolidate multiple requests into a single one across services.
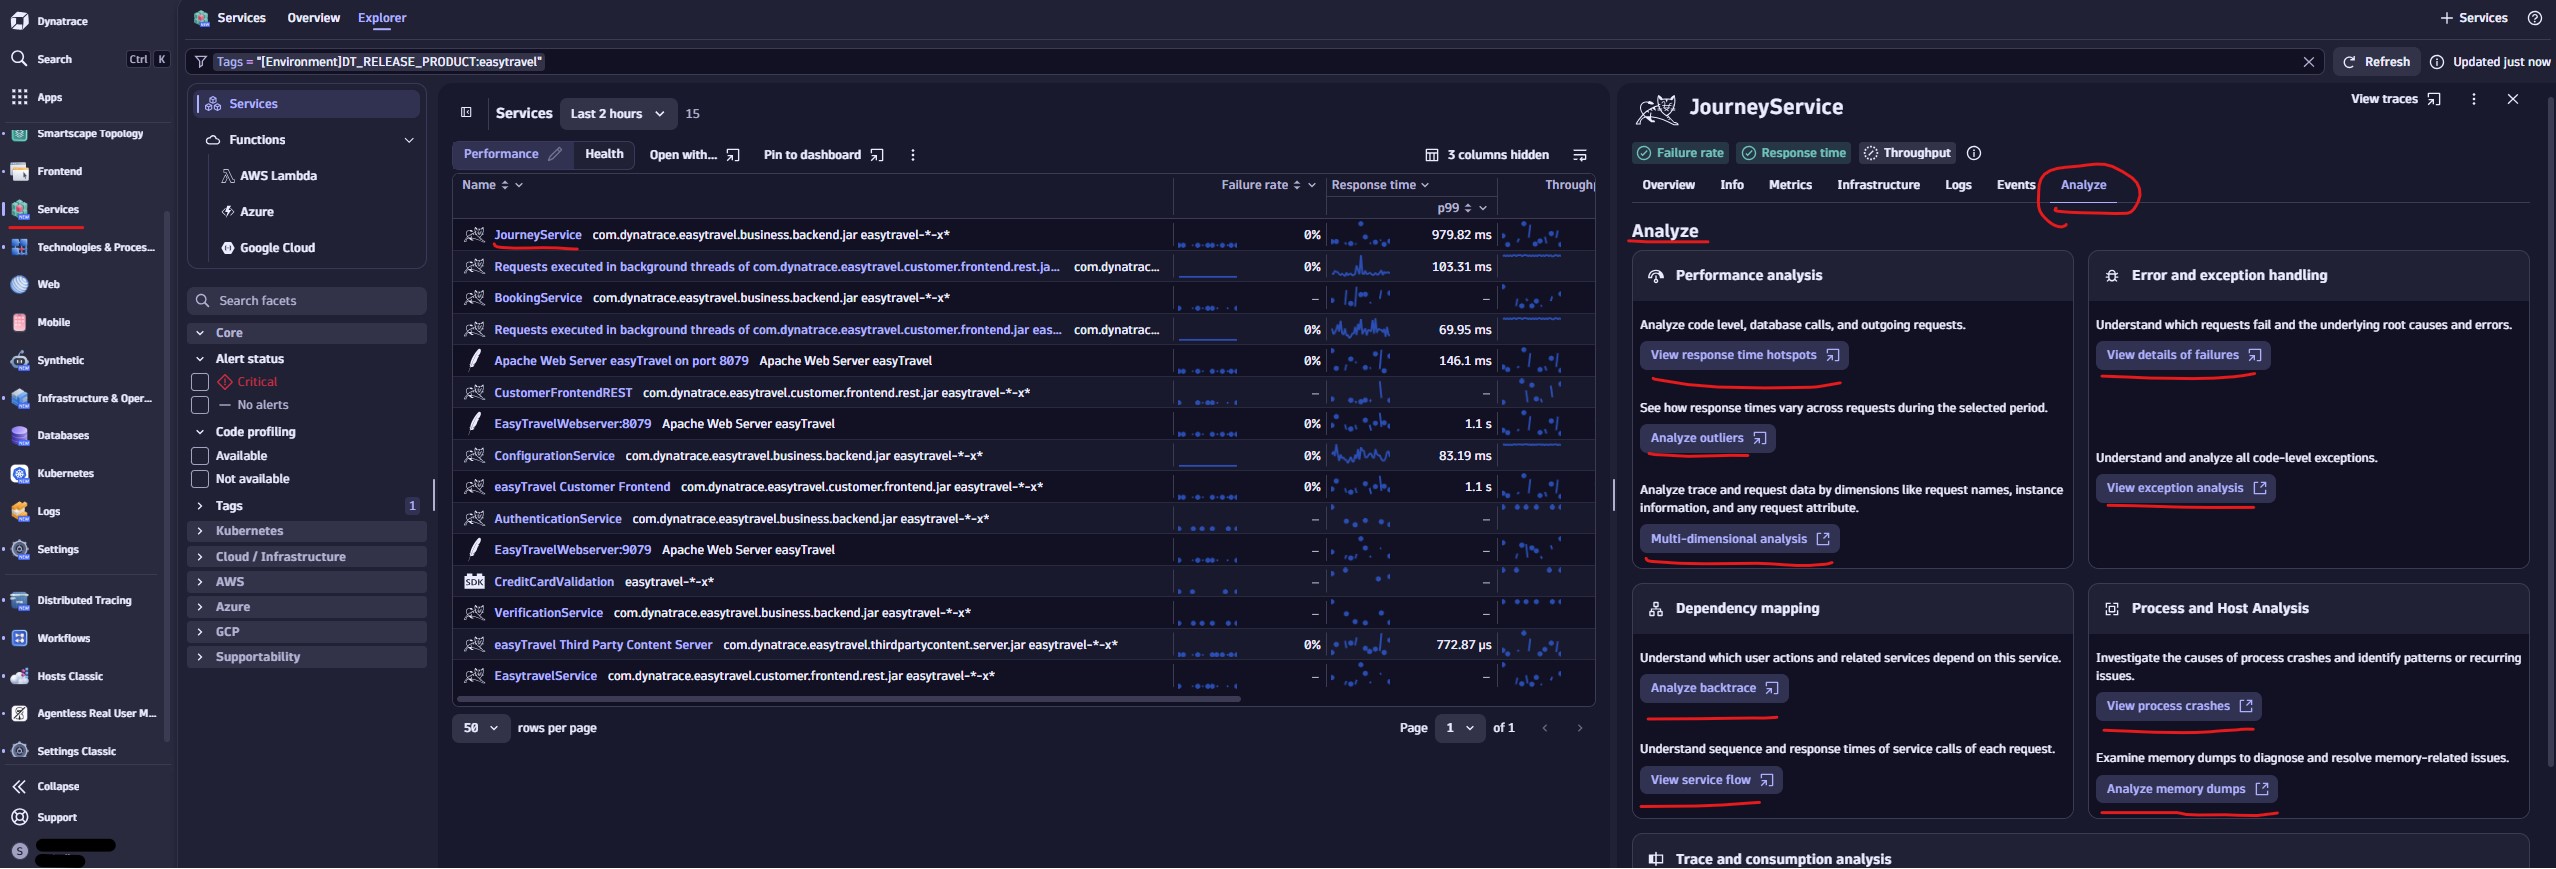
Other Analysis options
Hotspots: shows slow and problematic requests.
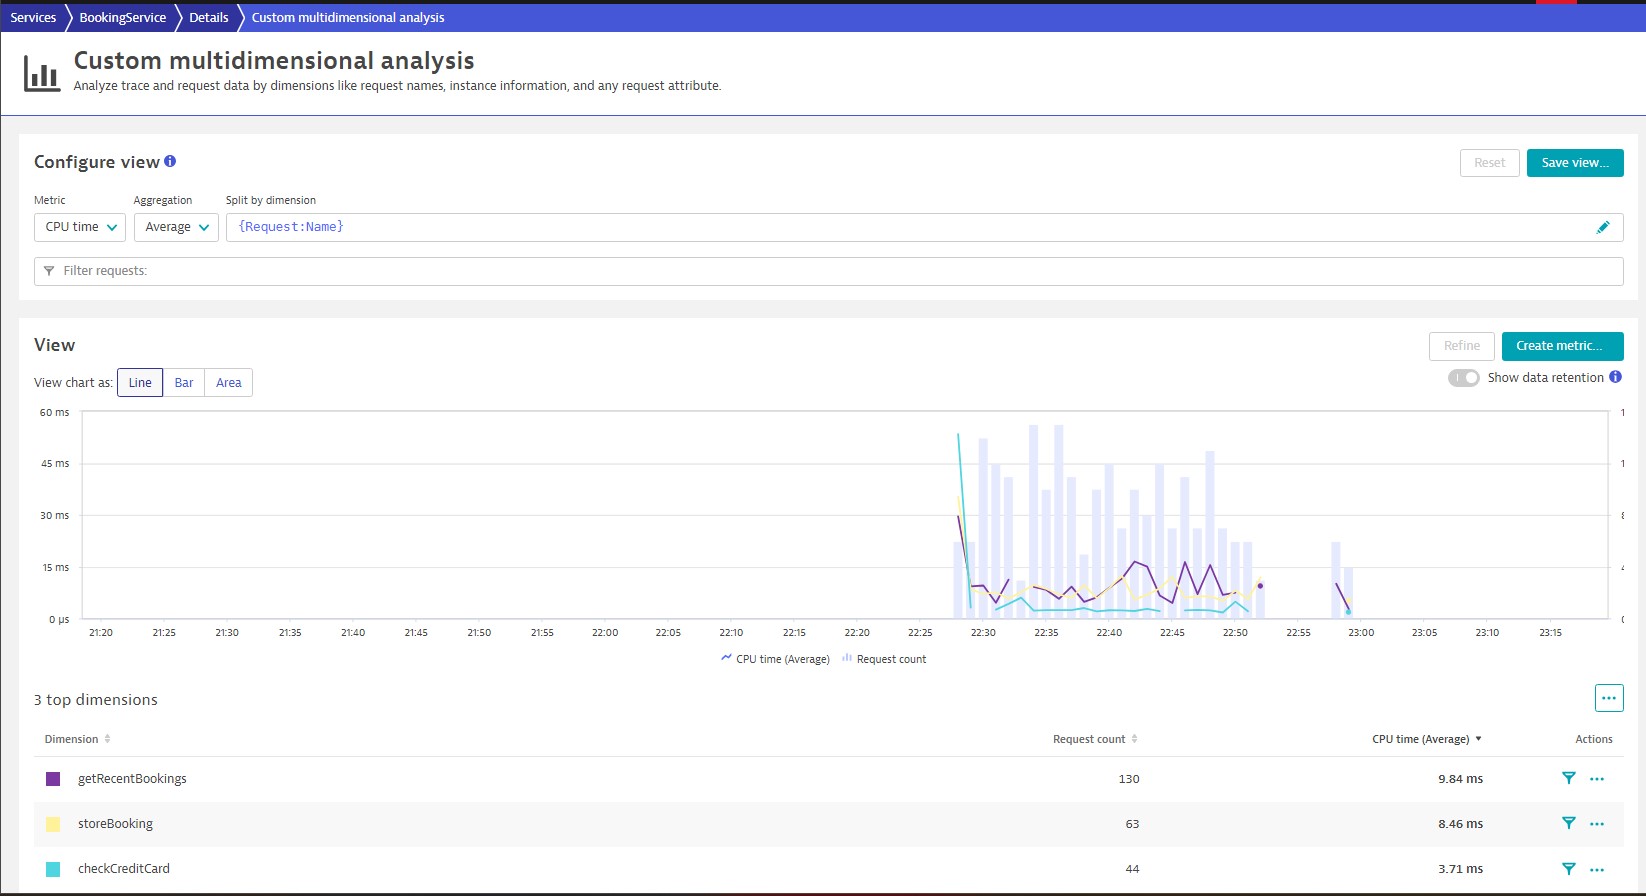
Multidimensional analysis views: Creating charts to analyze any combination of request metrics and custom metrics, tables and charts to understand dependencies.
Understand dependencies:
- Understand sequence and response times of service calls of each request.
- Understand which user actions and related services depend on this service.
- See requests in trace overview.
- Understand and analyze which web requests are the most expensive and most frequently called.
- See logs from the process group on which this service runs.
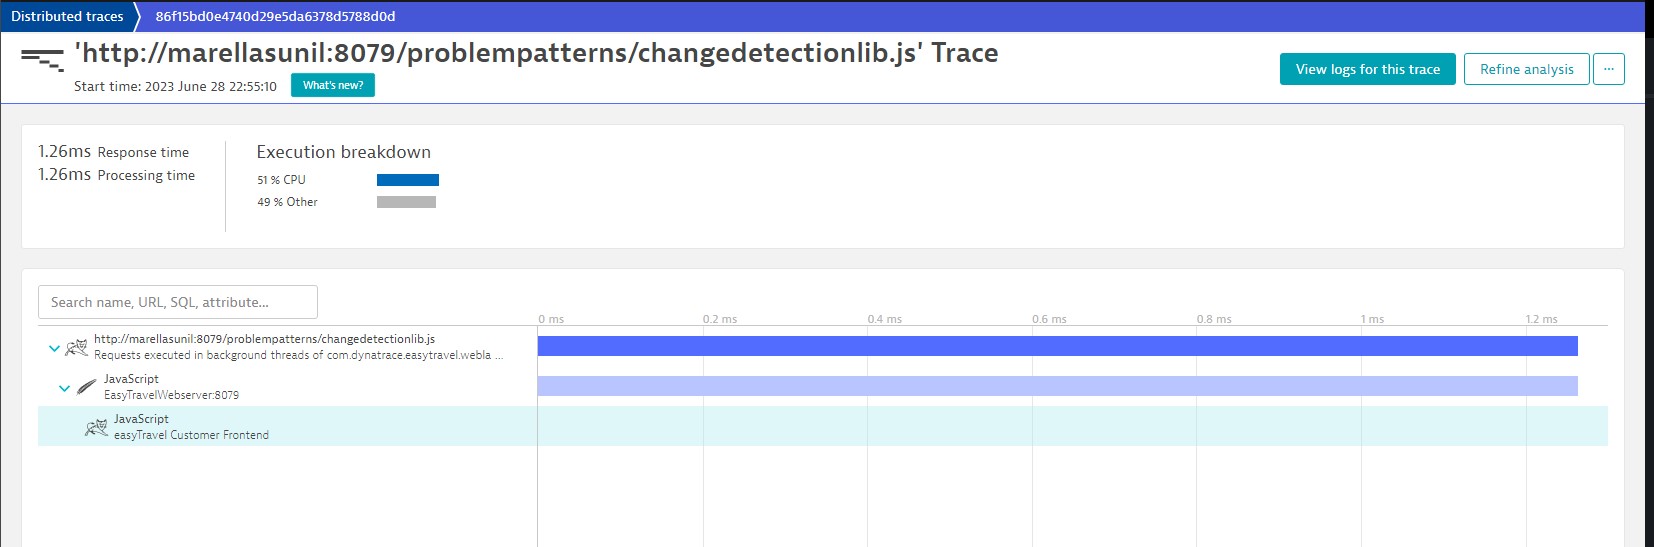
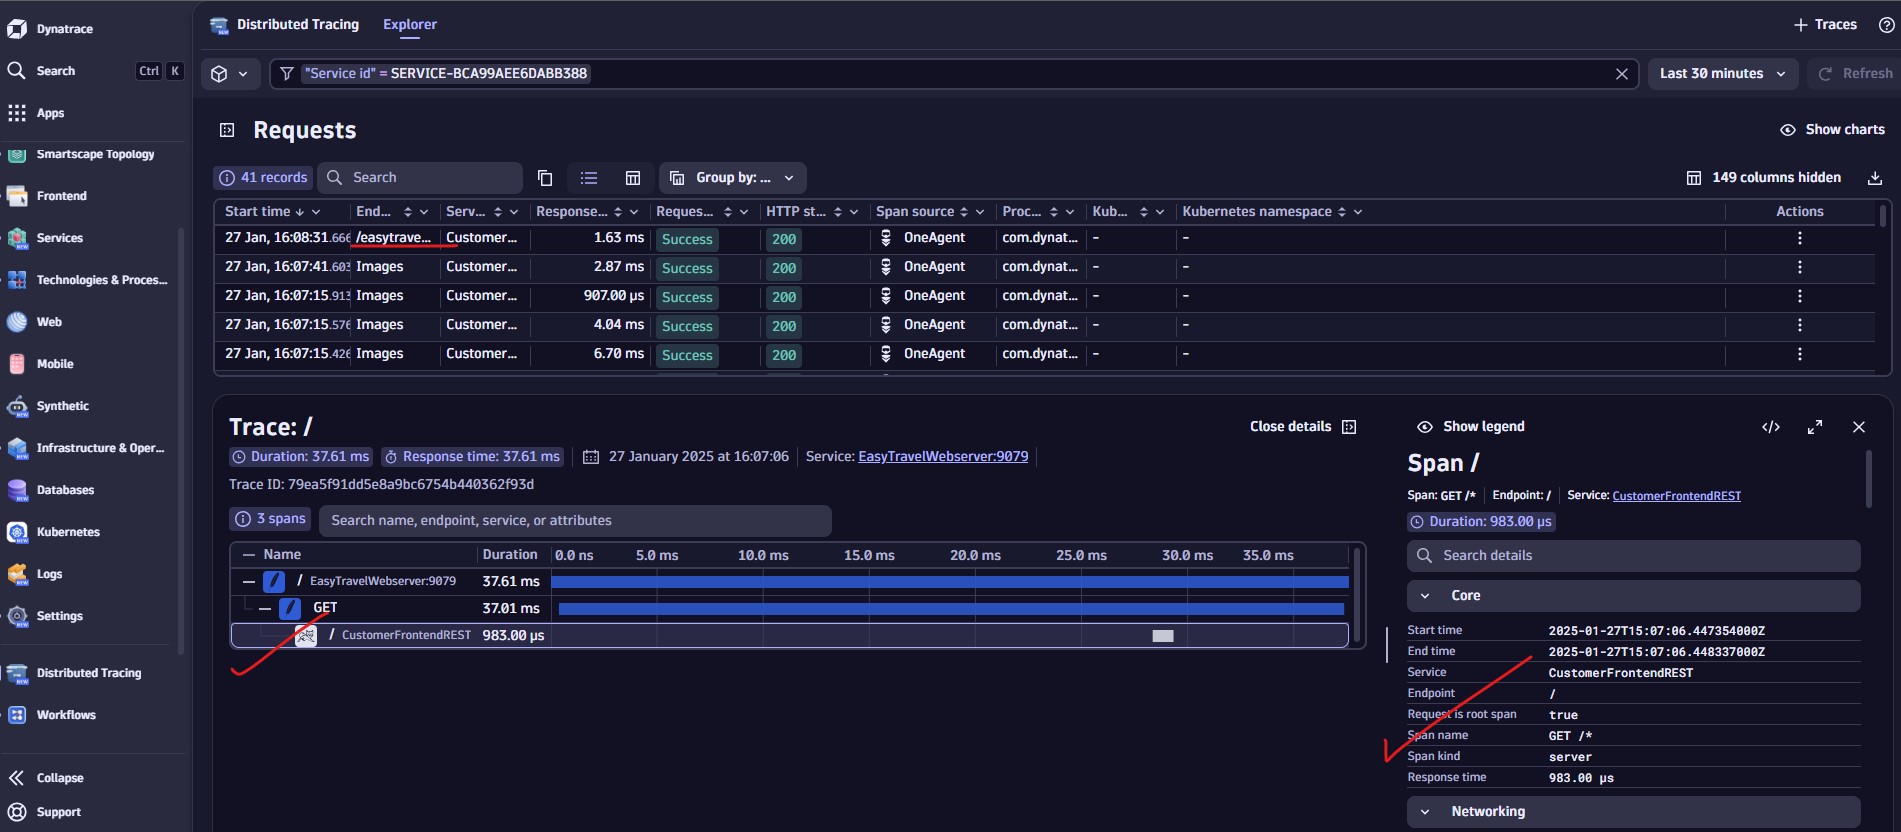
Purepath Distributed Traces
Purepath technology enables oneagent capturing transactions across your technology stack, from the browser down to the code and database level.

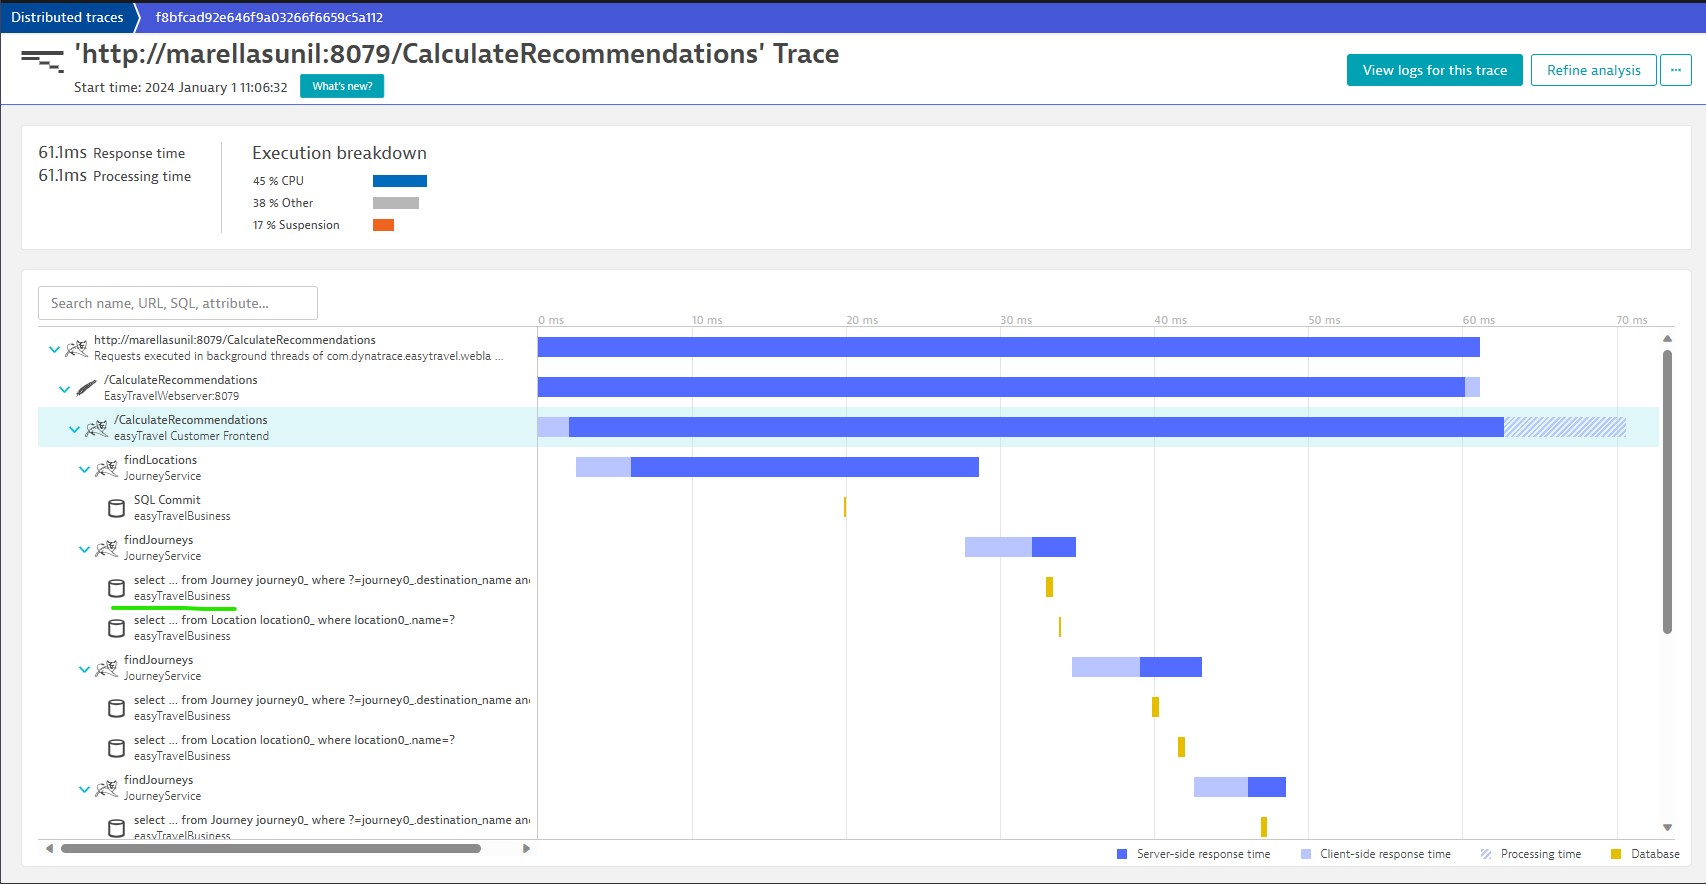
Another Distributed Trace Example (With databases):
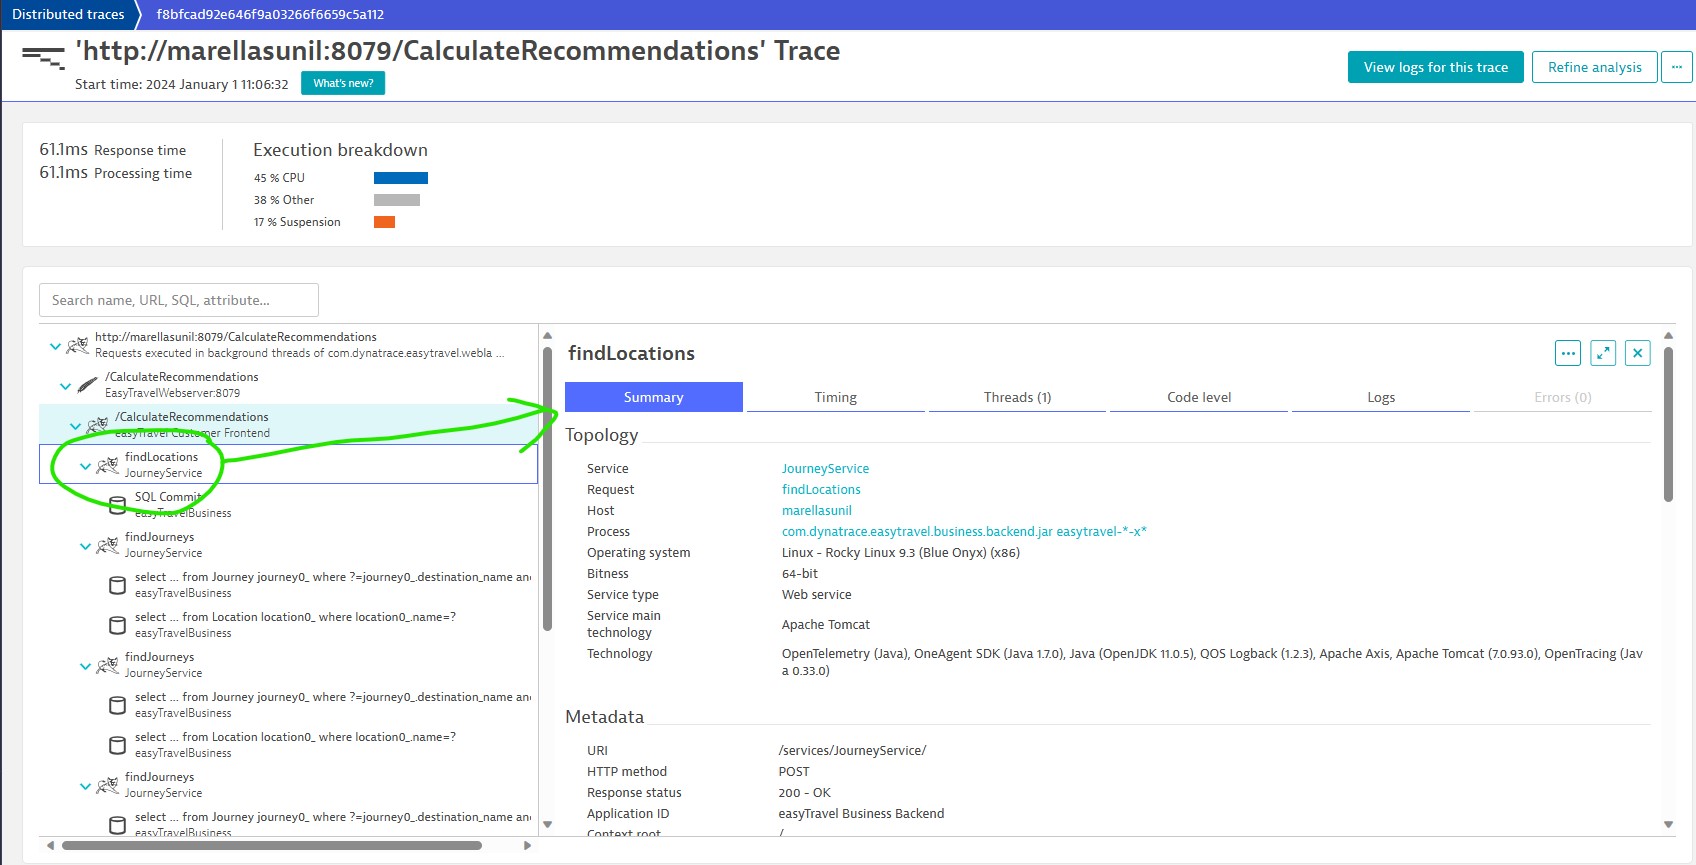
Select any of the URL/Name/Attribute/Database to see more details like Summary, Timing, Threads, Code level, Logs & Errors
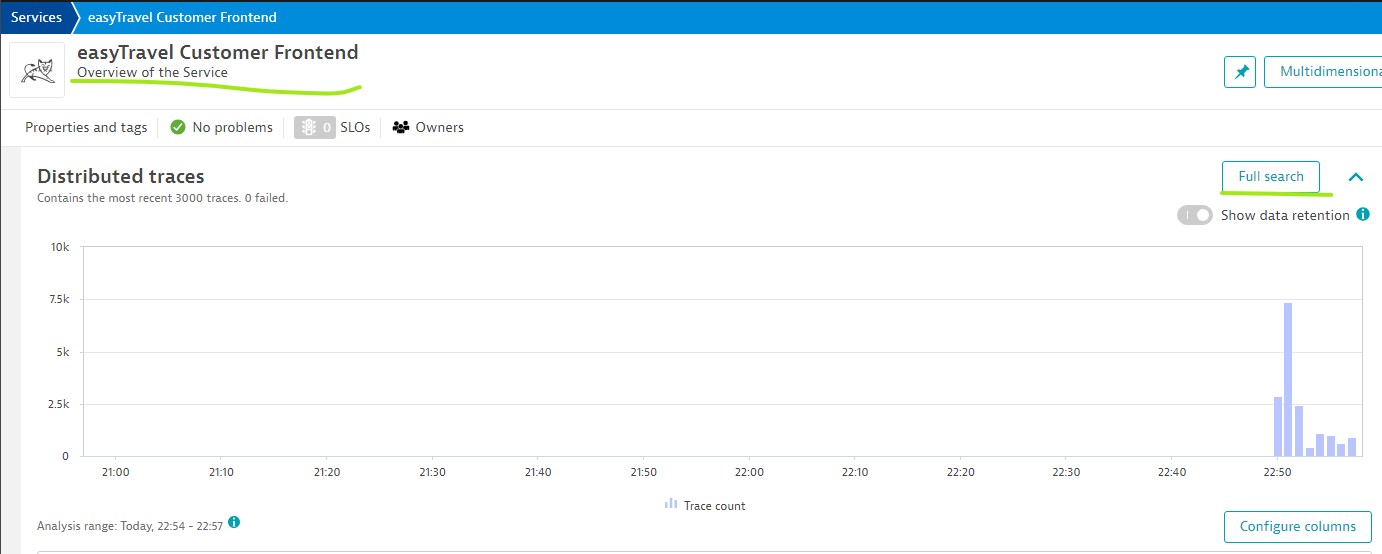
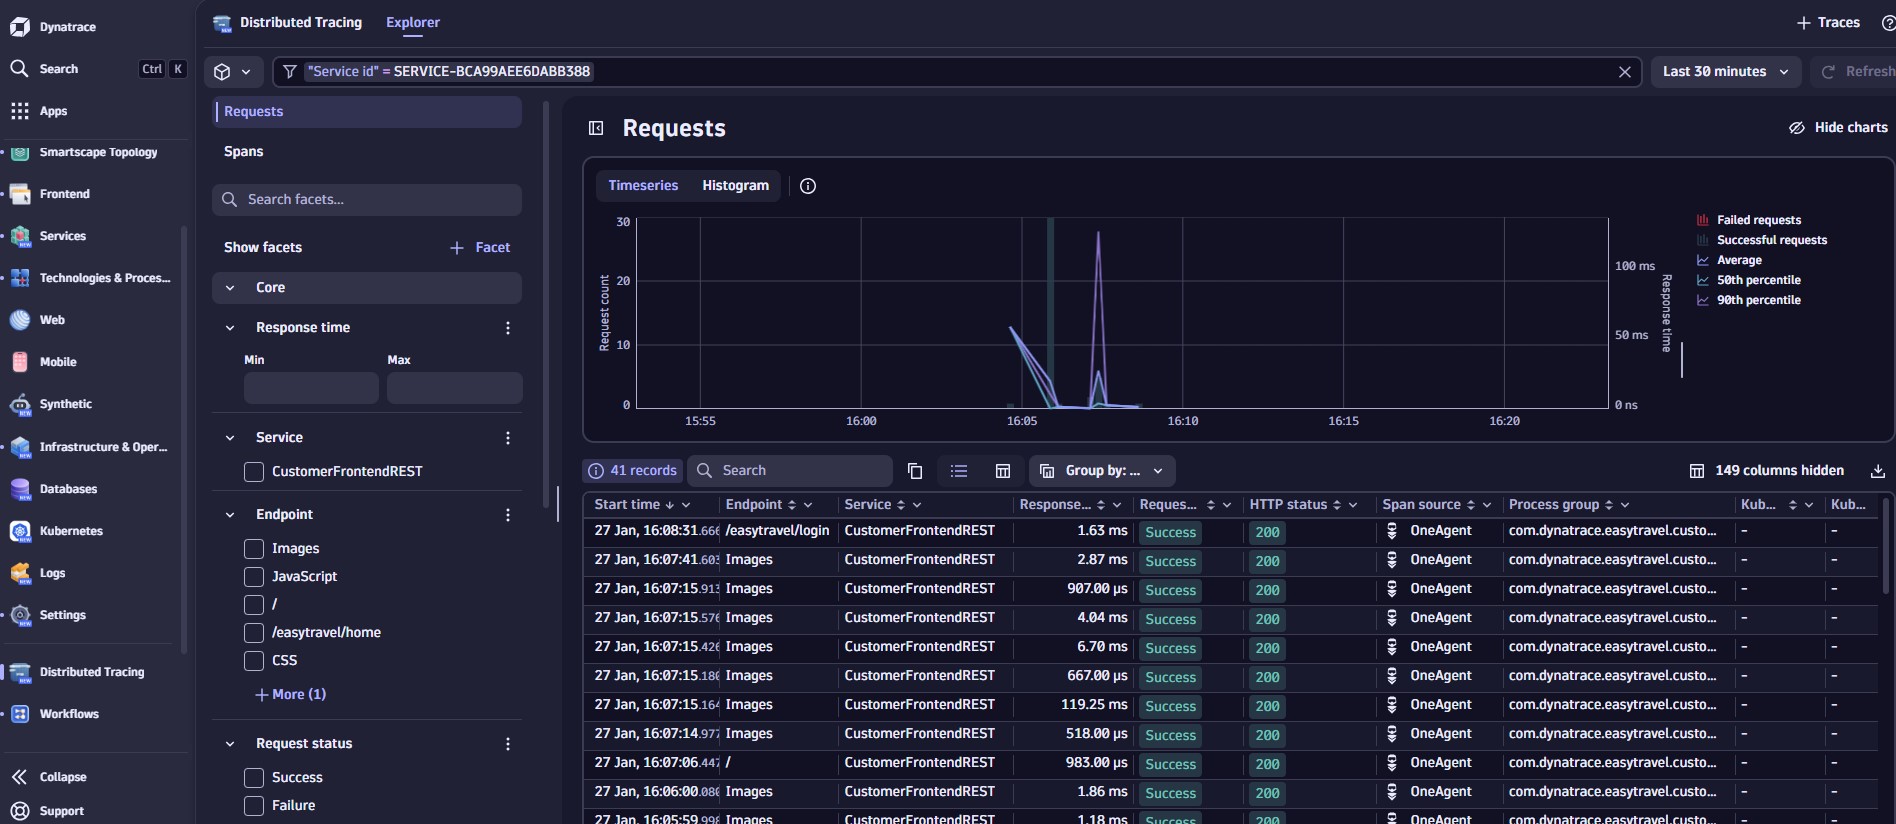
Services (New View)
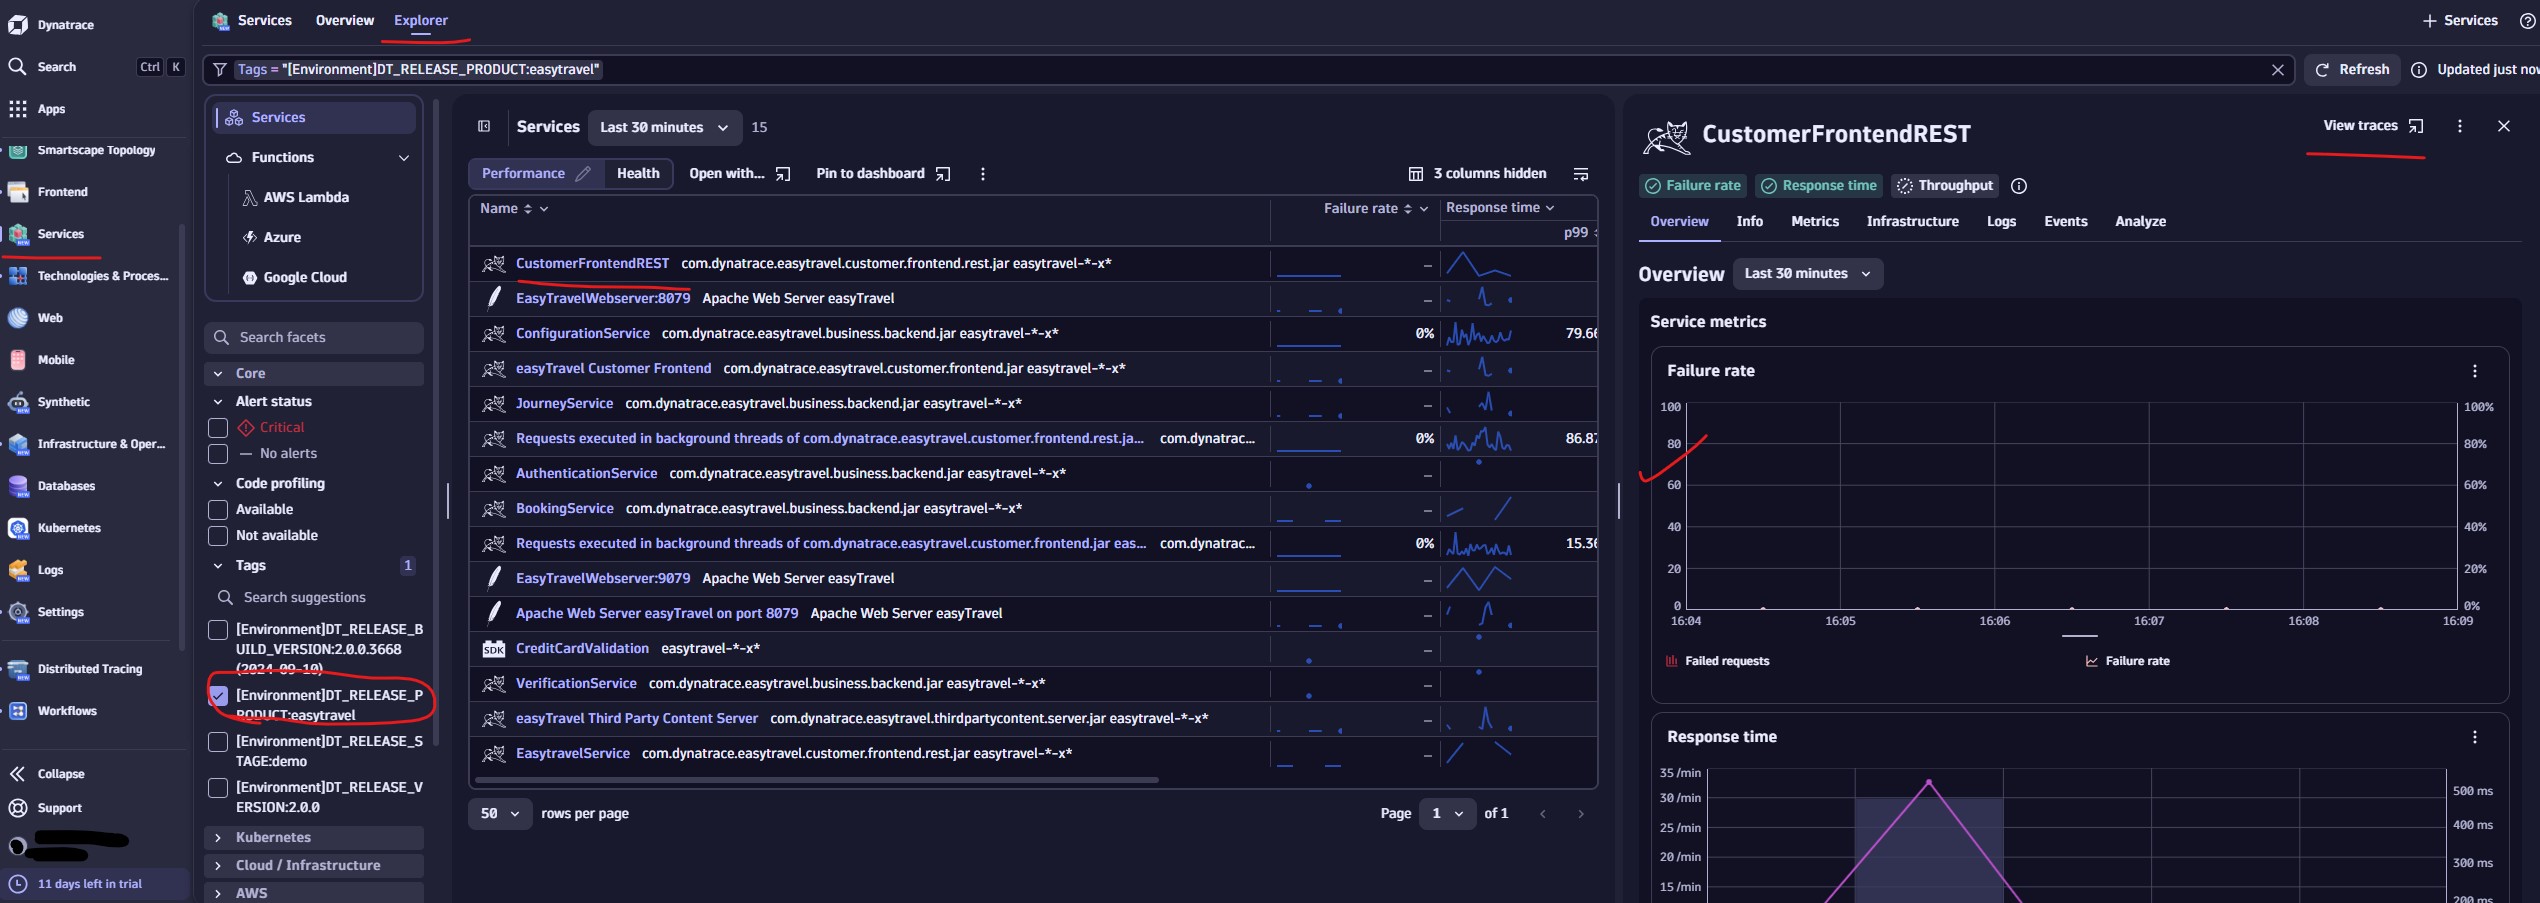
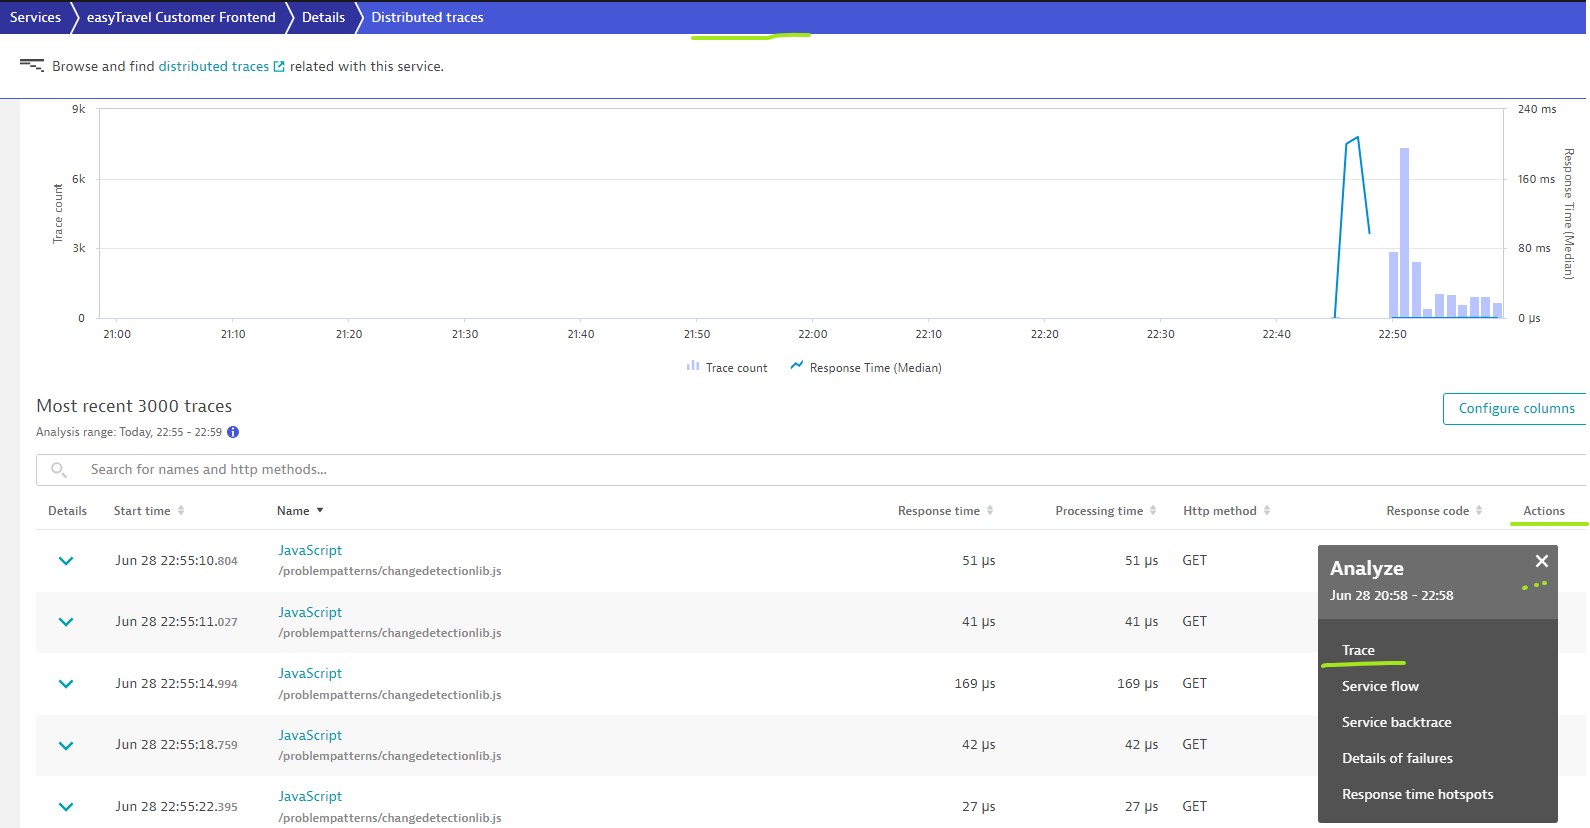
Distributed Traces:
Trace Details:
Service Analyze:
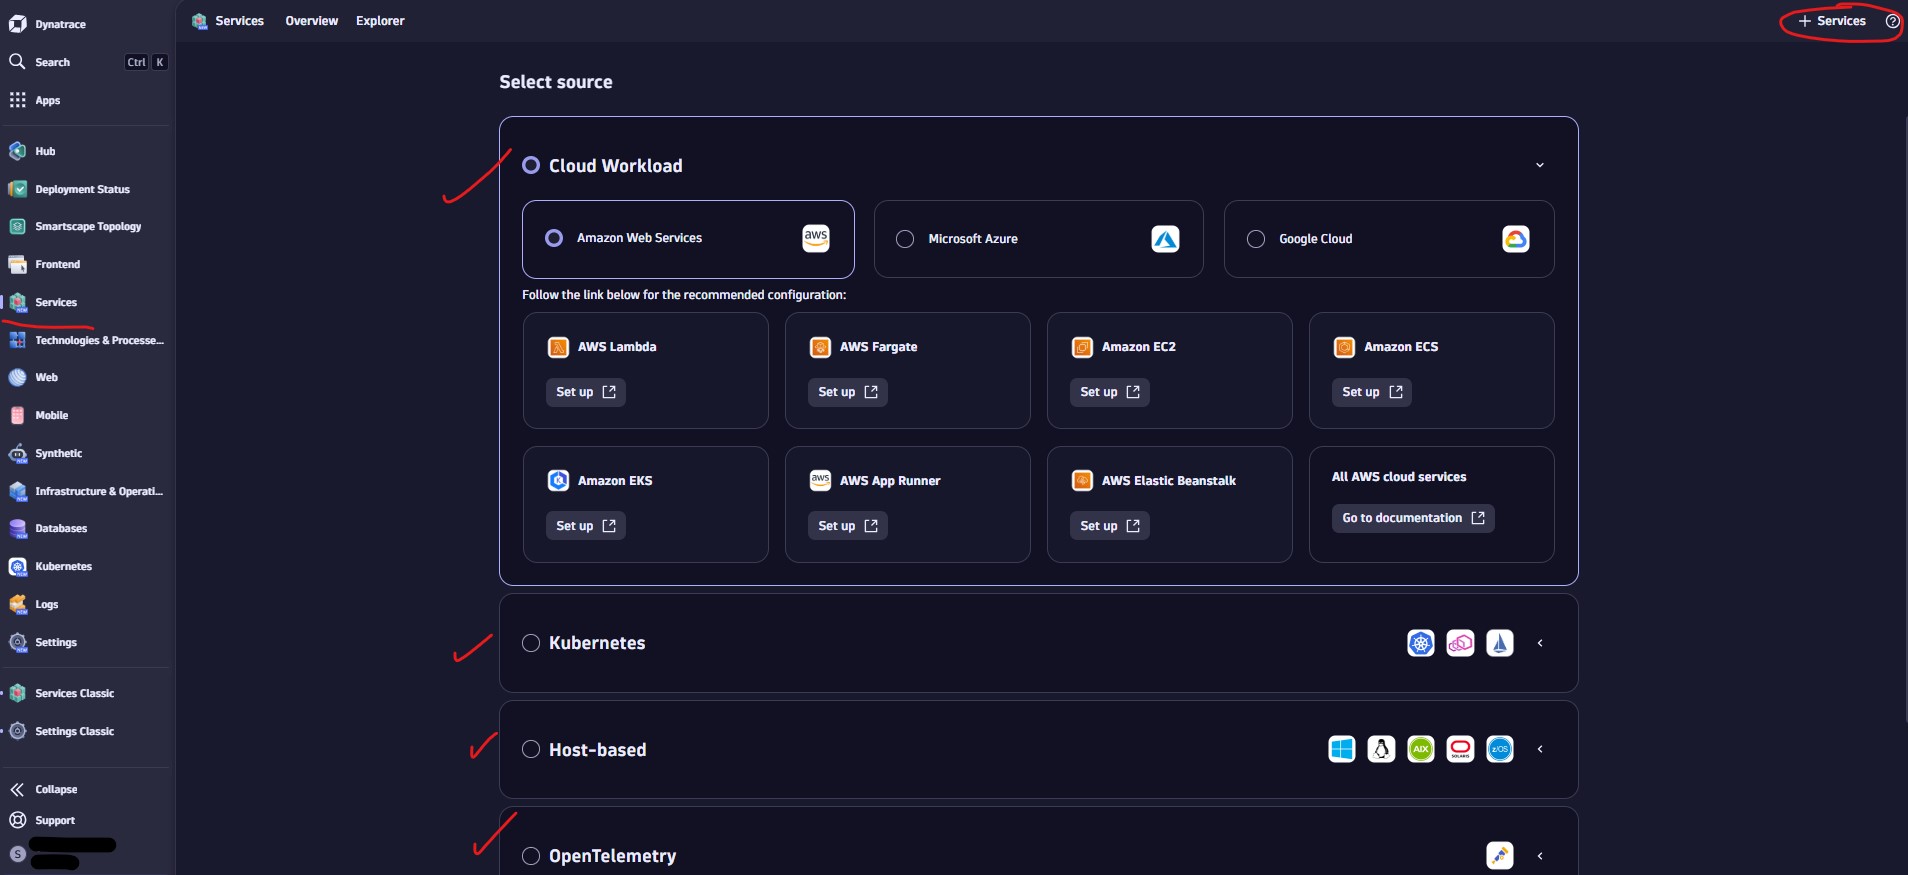
Get services into Dynatrace:
Next Page:
Main Page: Application & Microservices
Next Page: Service Management
Dynatrace : Main Page