MyObservability
Monitoring Services
- Monitoring Services
- Exploring Metrics
- Exploring Service flow
- Exploring PurePaths
- Exploring Backtrace
- Multidimesntional Analysis
- Charting with the Data Explorer
- Exception Analysis
- Top Web Requests
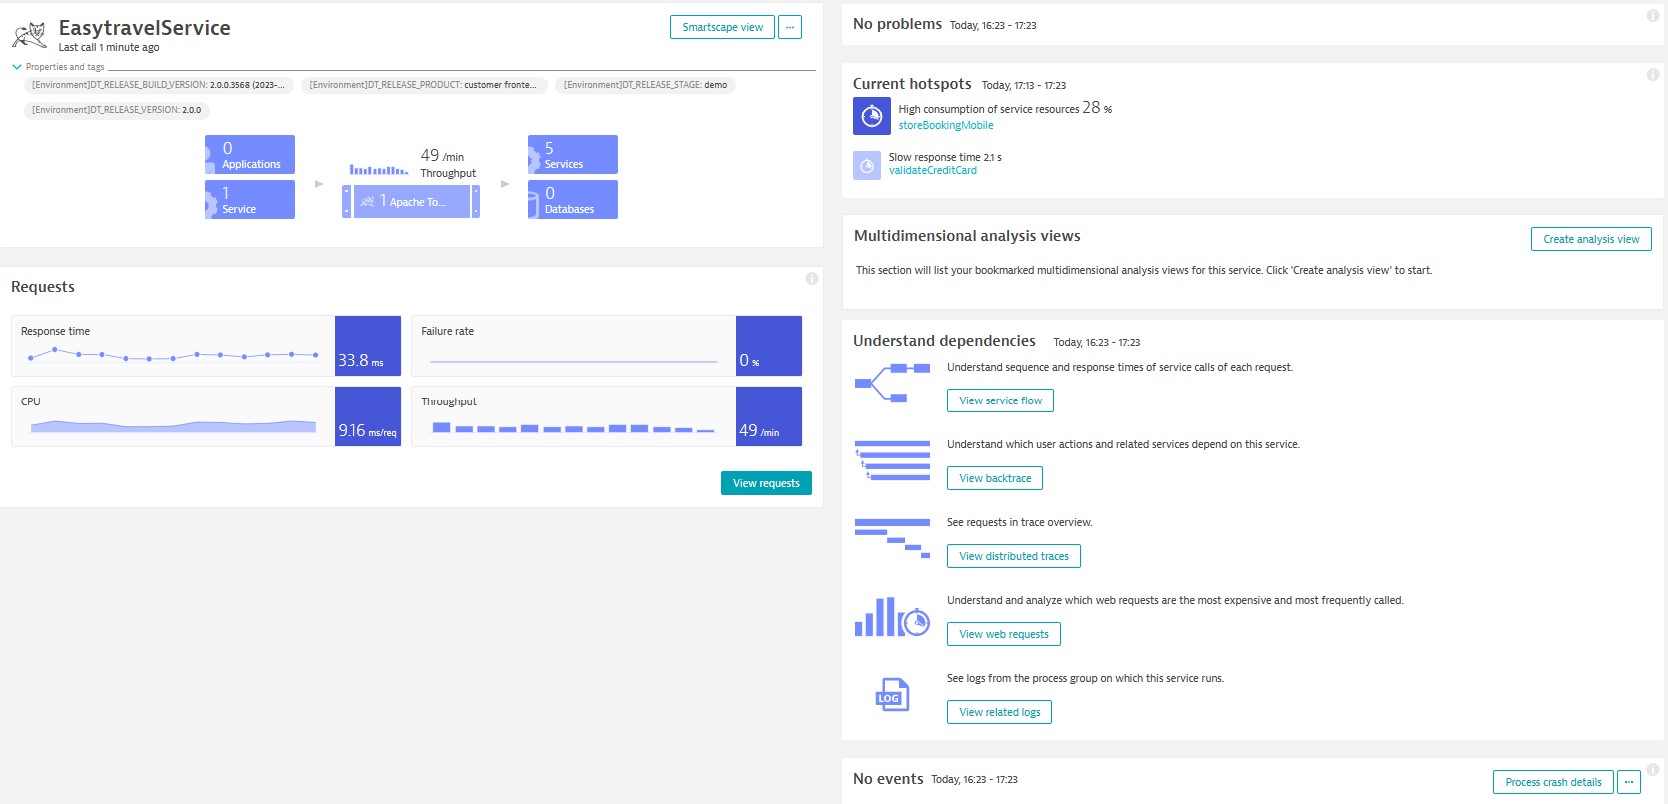
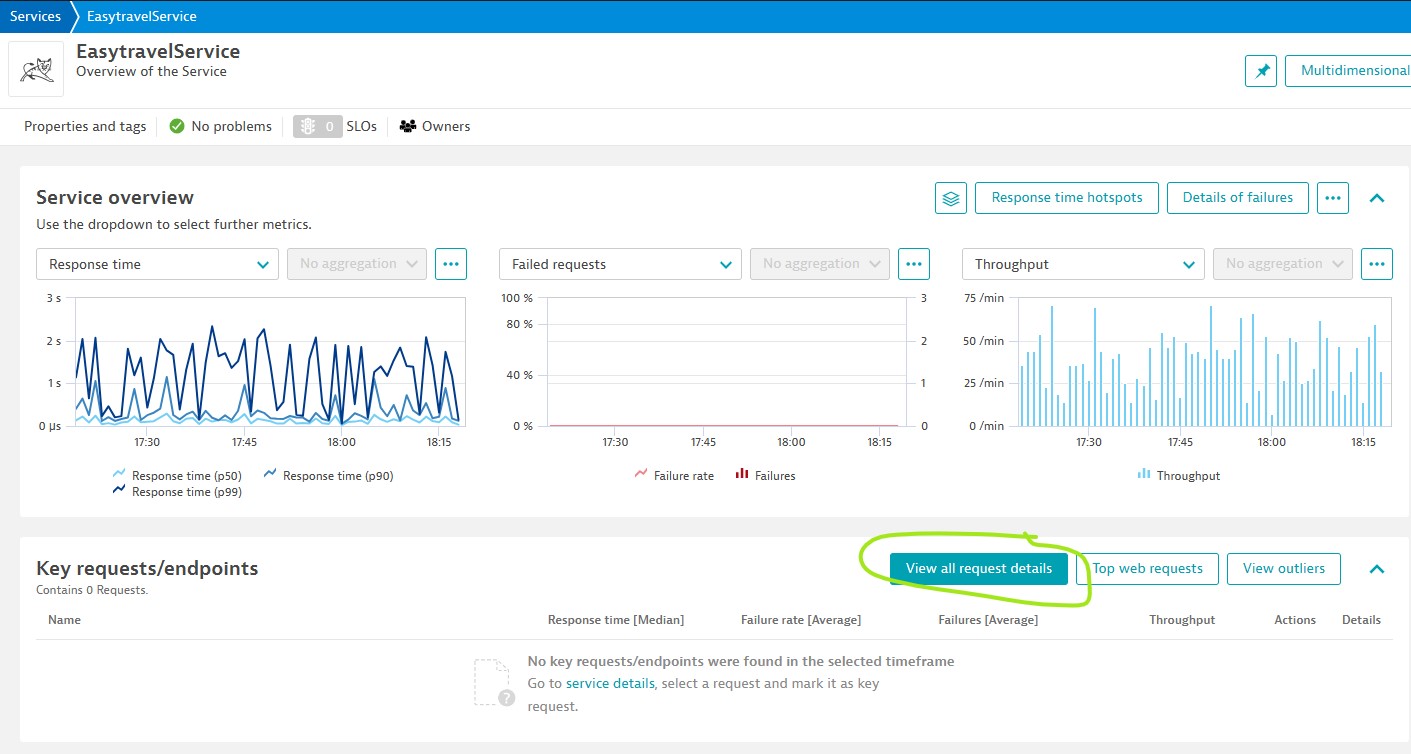
Monitoring Services
Service page contains:
- Smartscape view
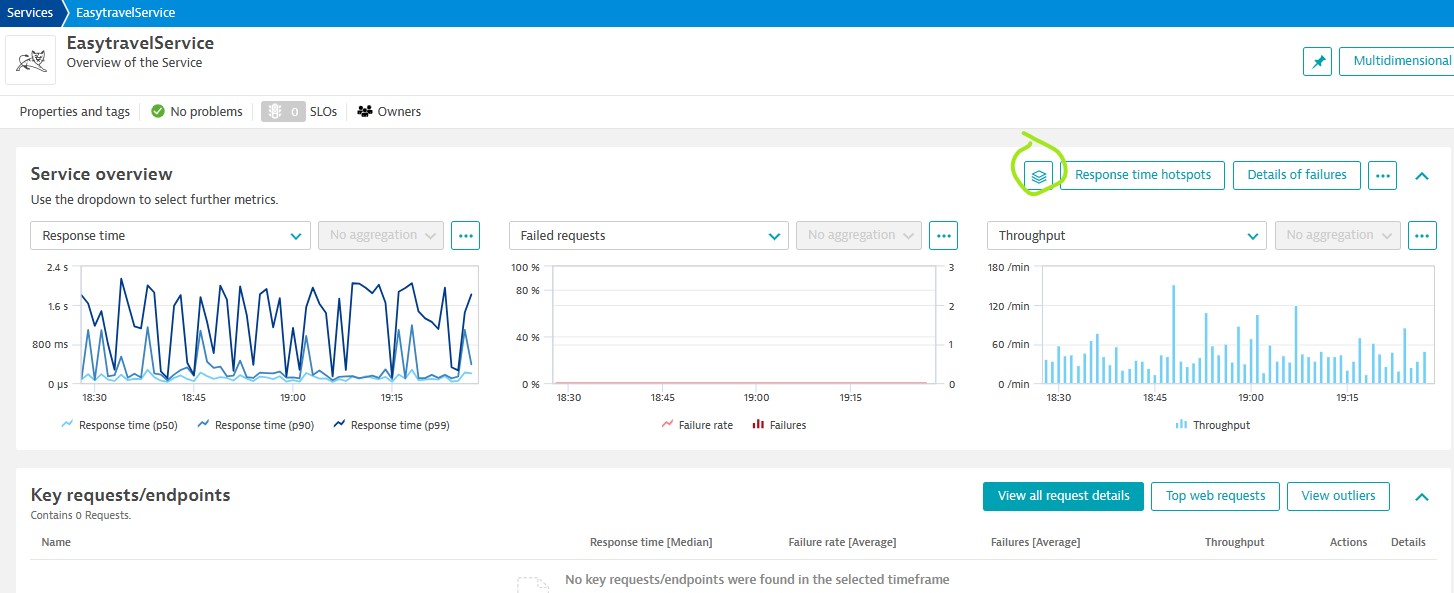
- Responsetime hotspots / analysis
- Details of failures
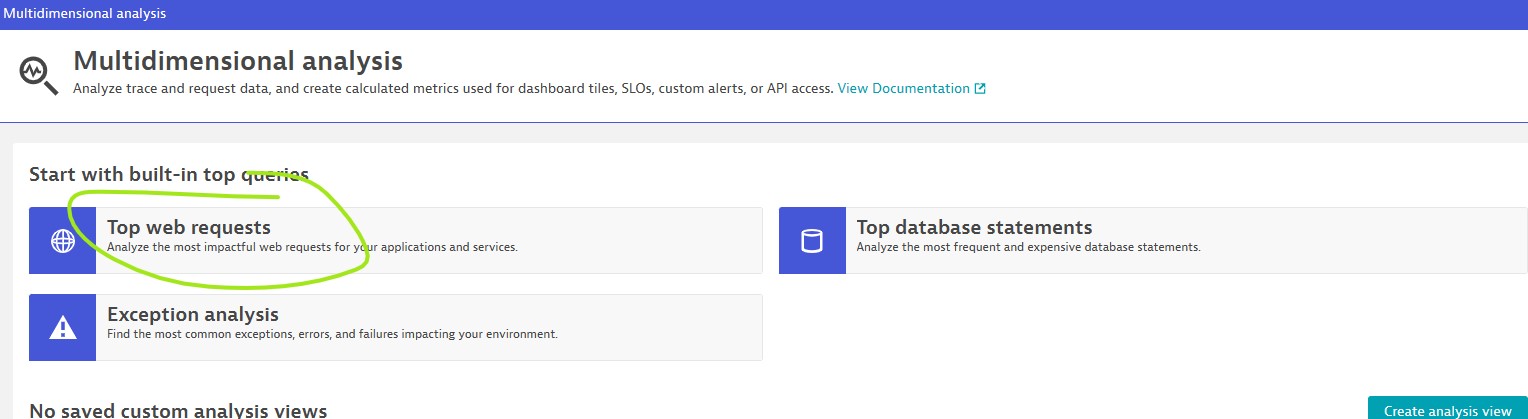
- Top web requests: Understand and analyze which web requests are the most expensive and most frequently called.
- View outliers: Understand the response time distribution of all requests
- View backtrace: Understand which user actions and related services depend on this service.
- Service flow: Understand sequence and response times of service calls of each request.
- Distributed traces: Traces overview
- Events
- Logs
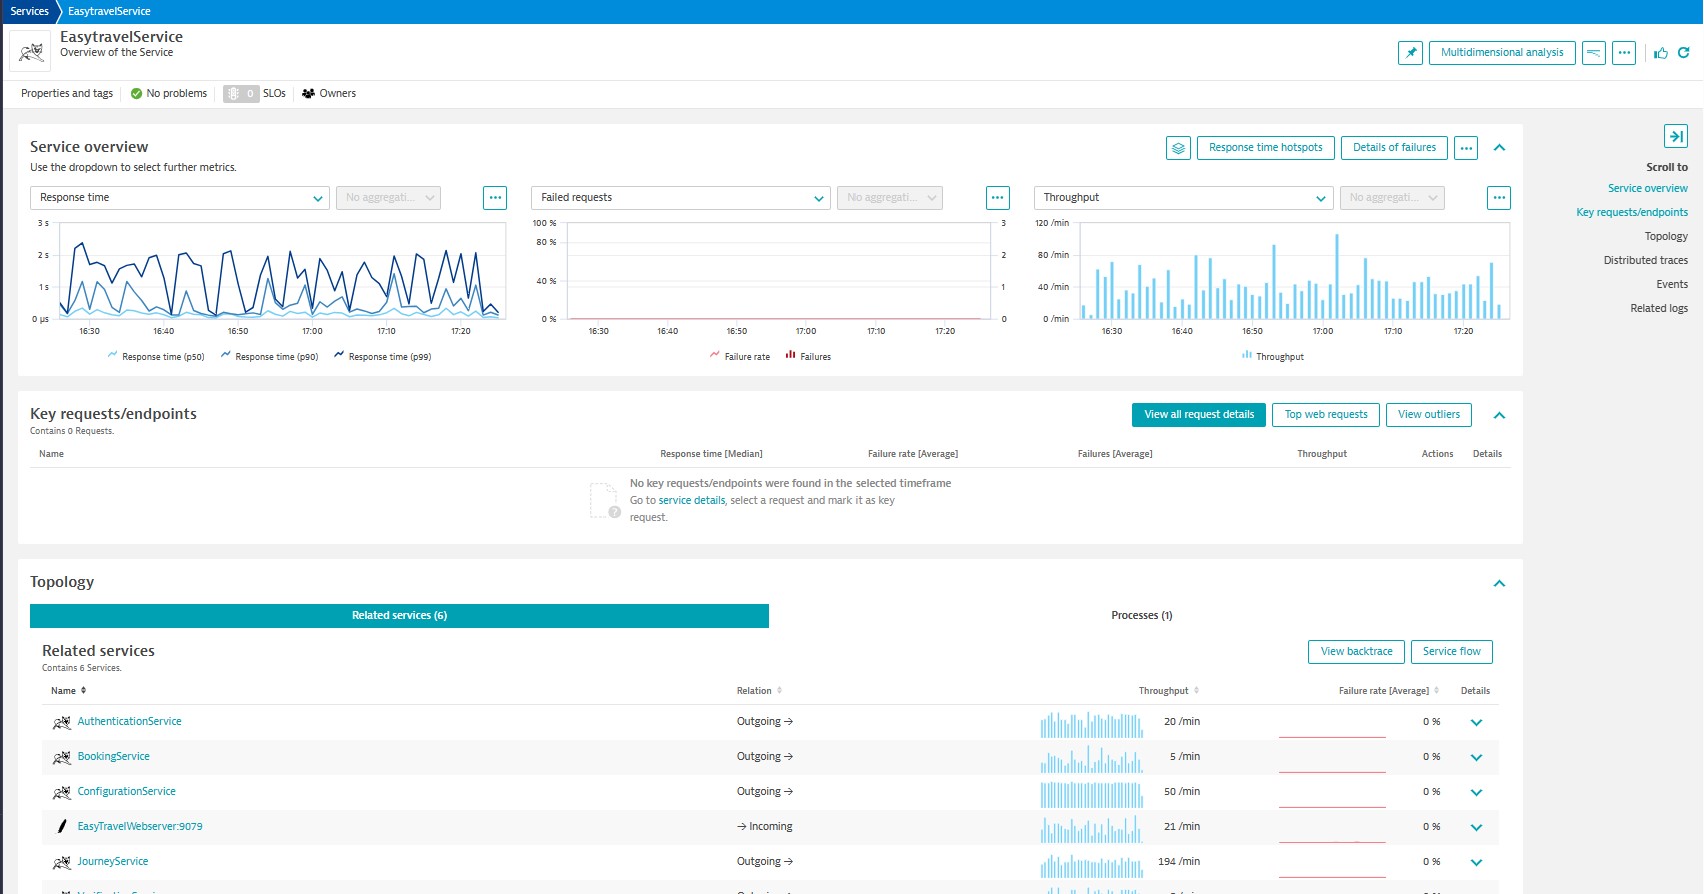
Classic view:
New view:
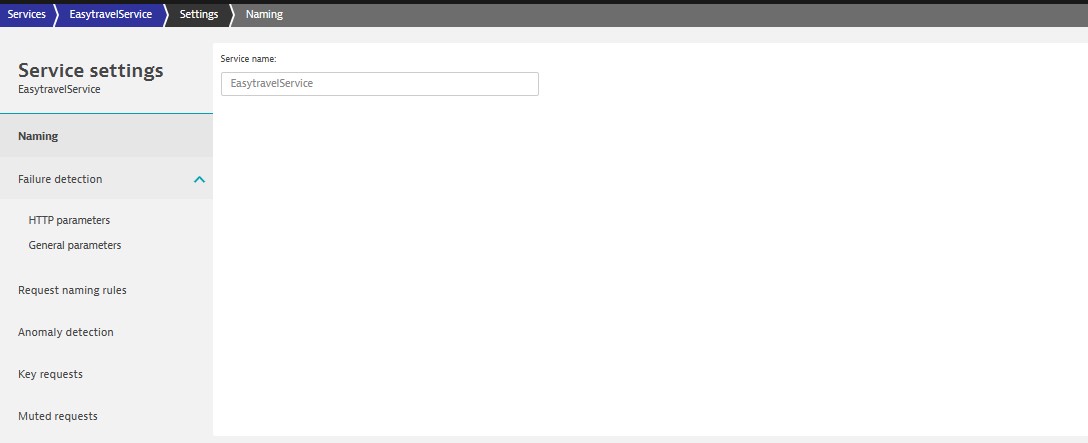
Service Monitoring:
Path: Select service which need for monitoring -> … (Top right corner) -> Settings
Smartscape view:
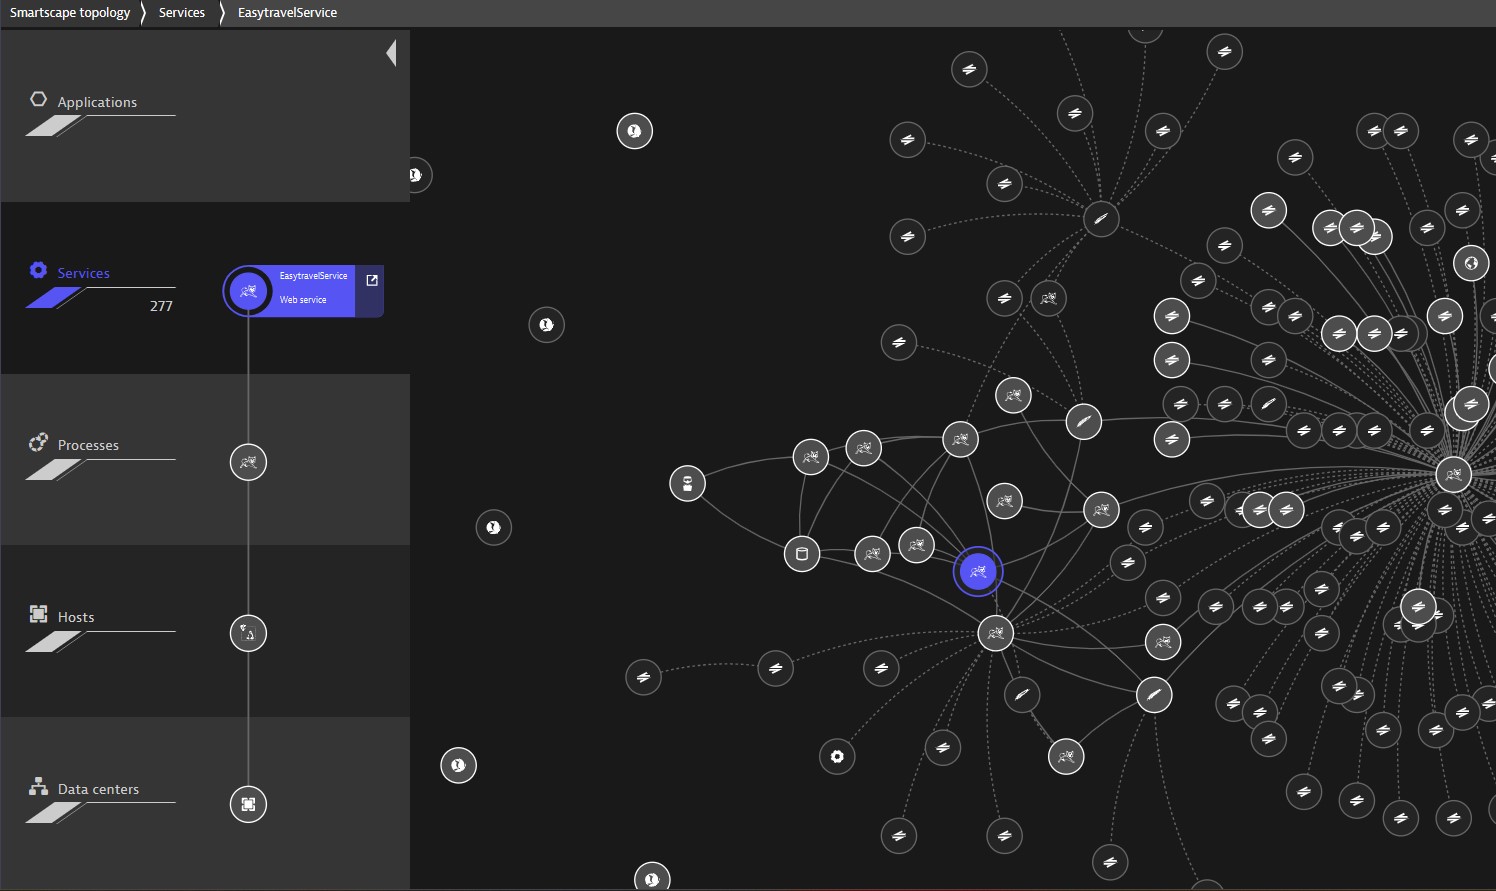
Details about service

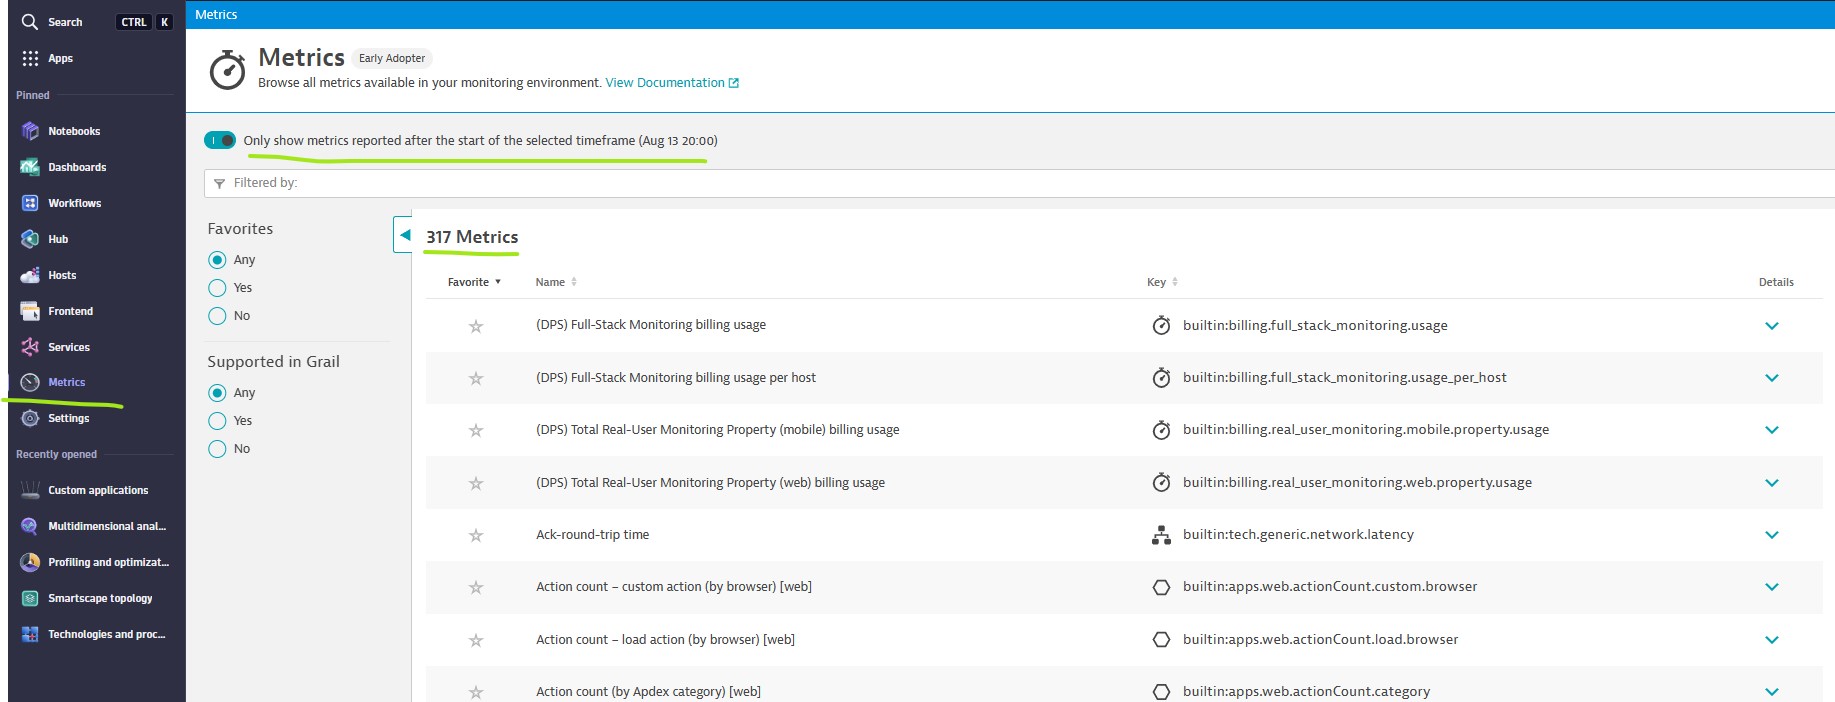
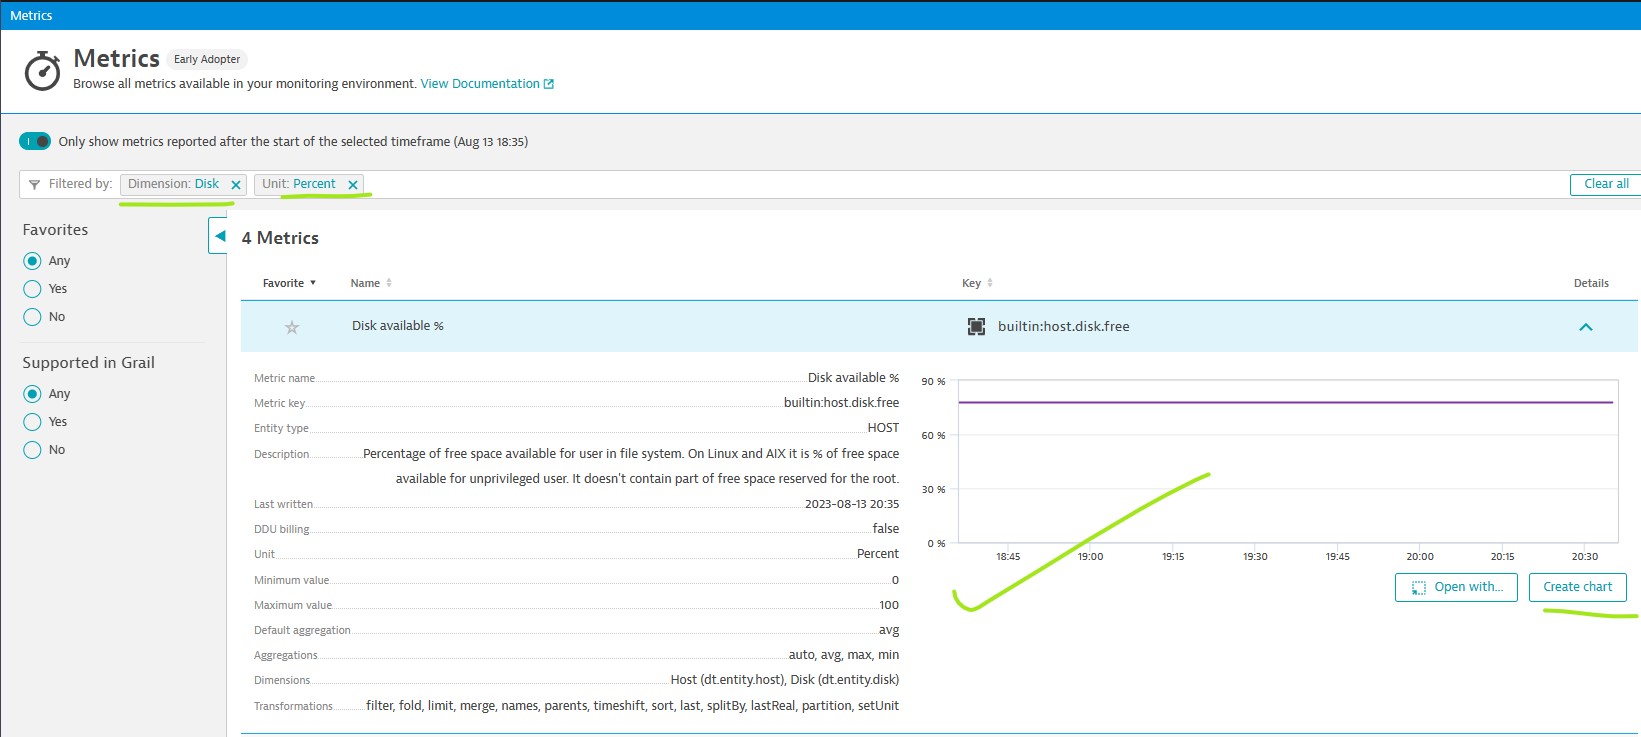
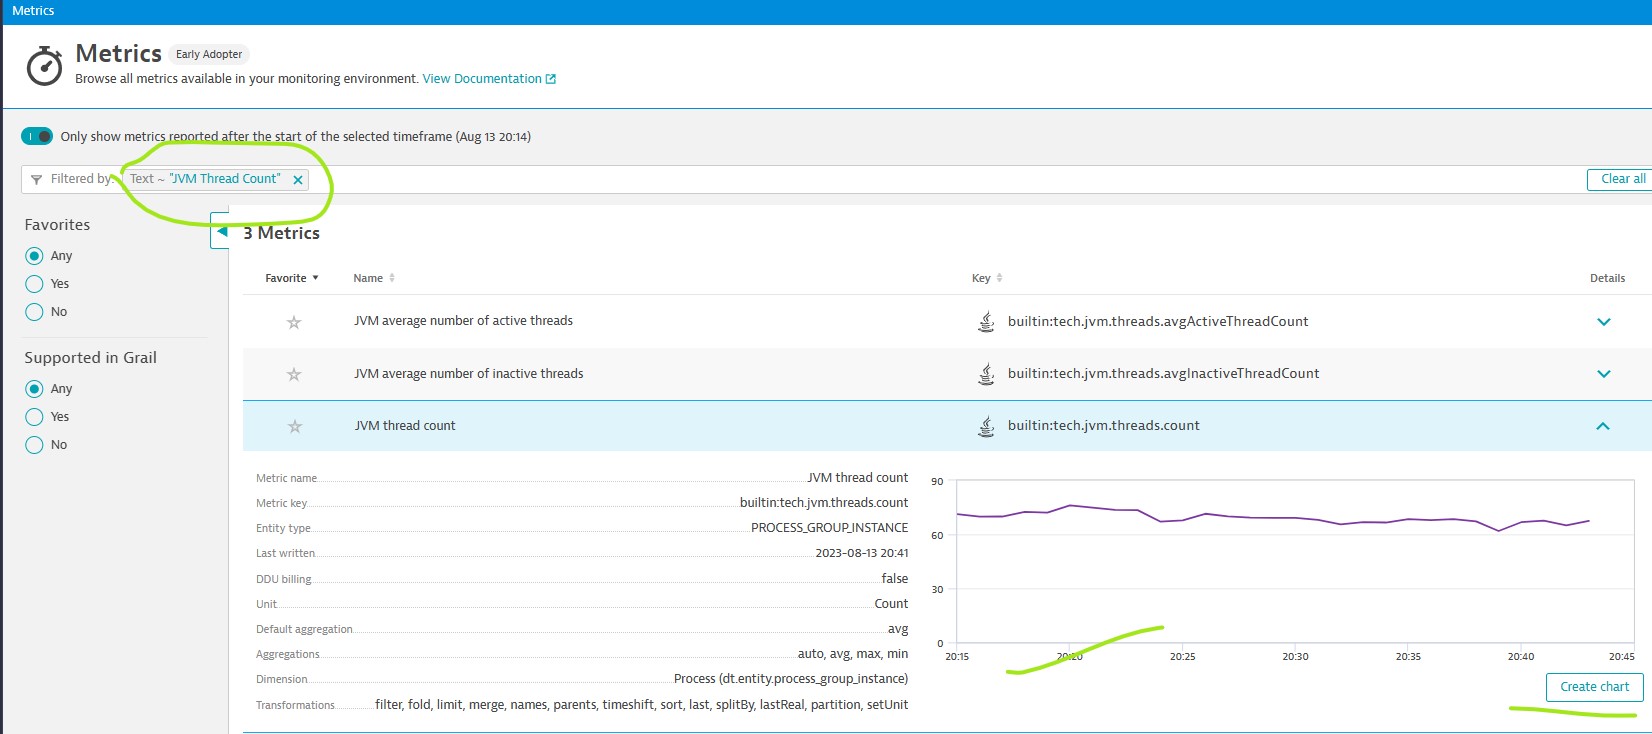
Exploring Metrics
Disk Space:
JVM Thread Count:
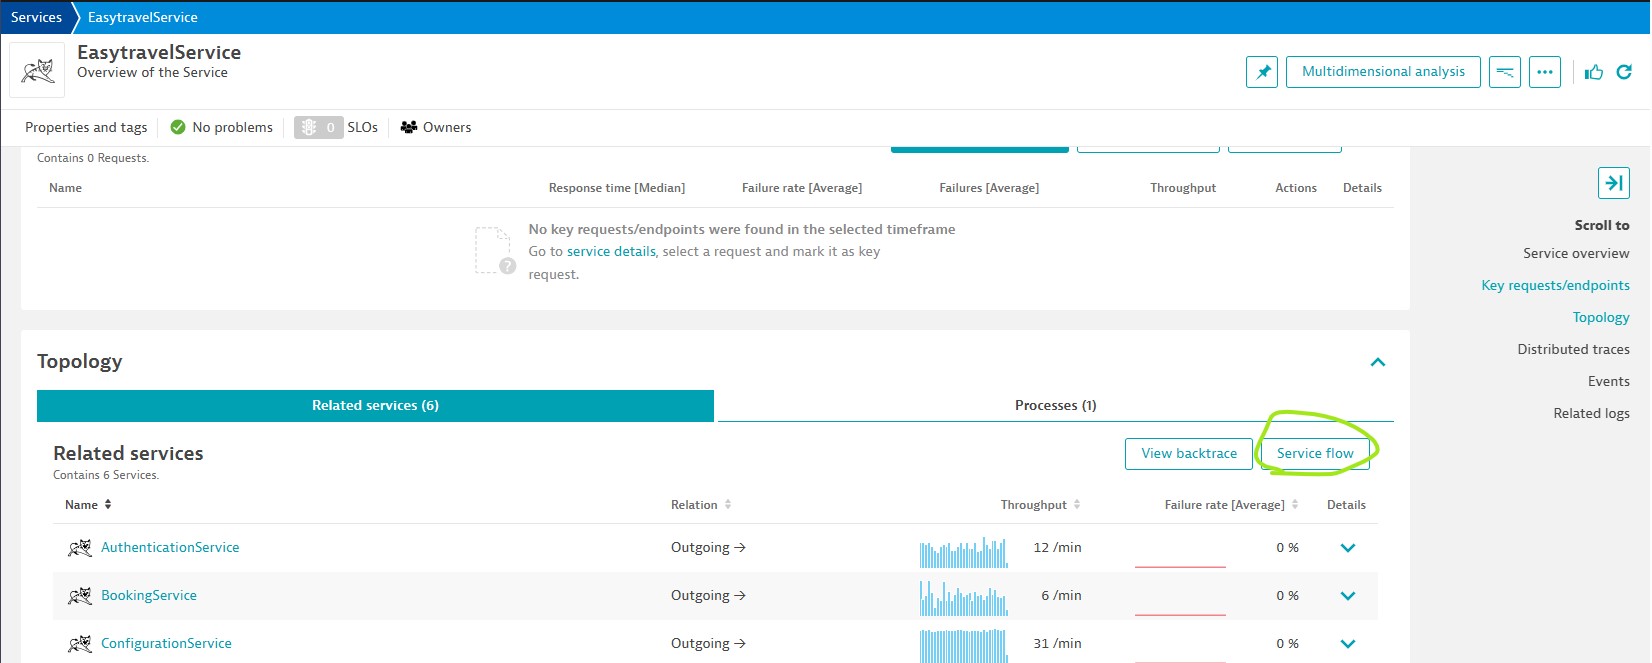
Exploring Service flow
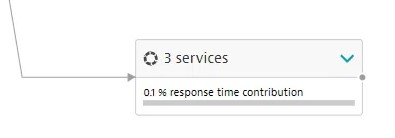
It illustrates how each components contributes to overall response time of a service. It does not necessarily show the order in which calls were made relative to one another across services.
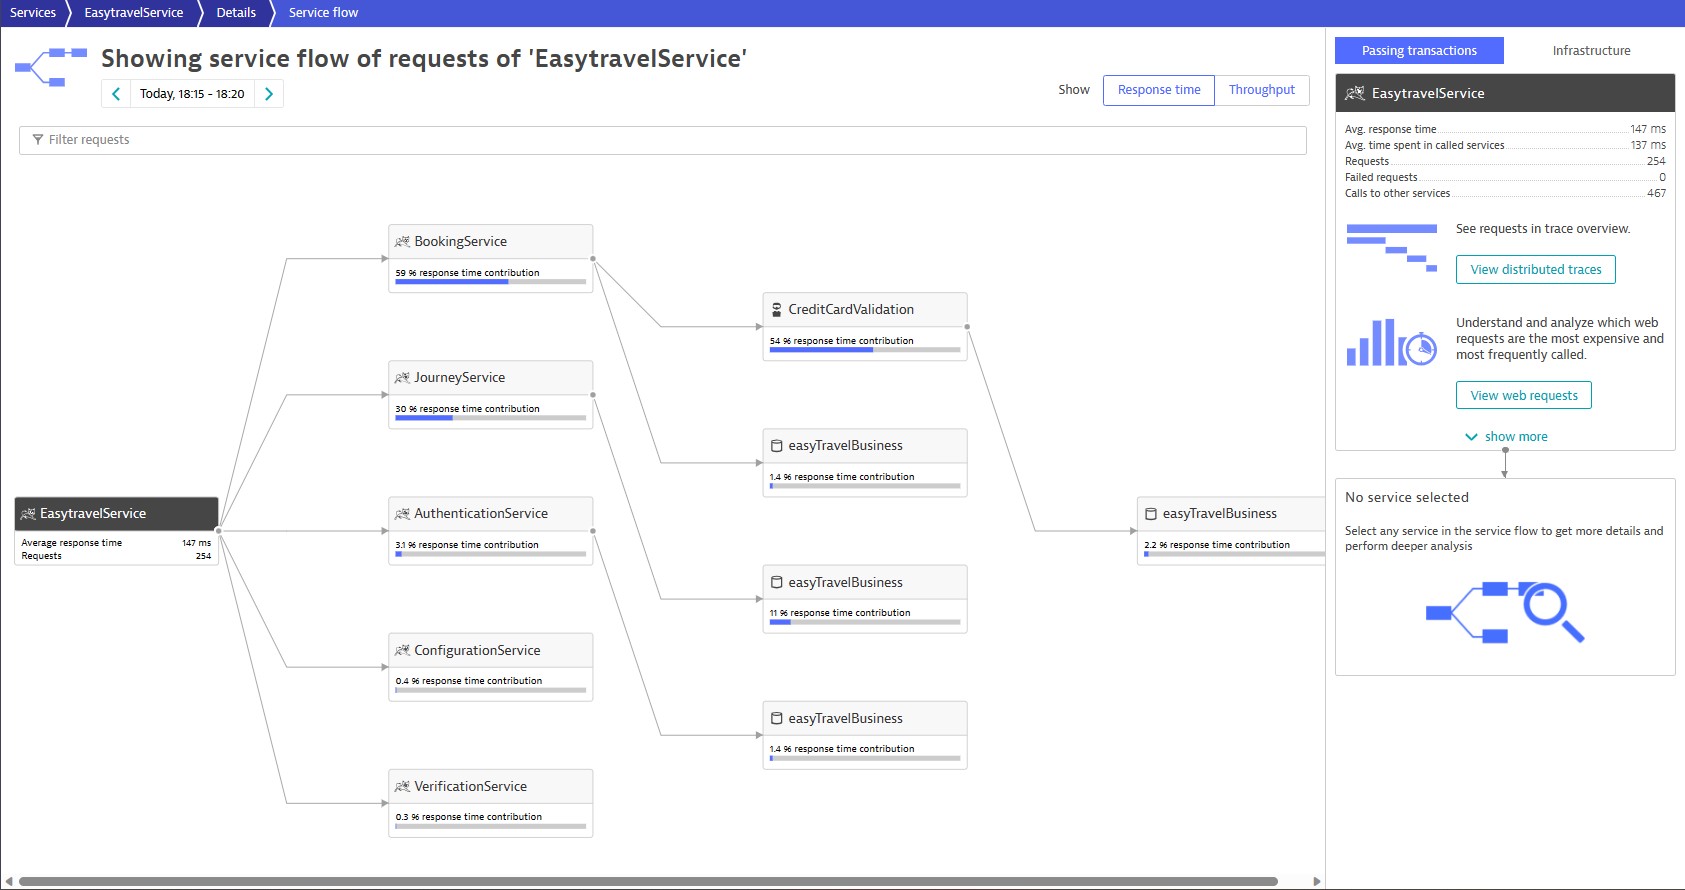
Dynatrace aggregates services with low response time contribution to improve data readability
Additional details about perticular services, select service and choose the required options for further details.

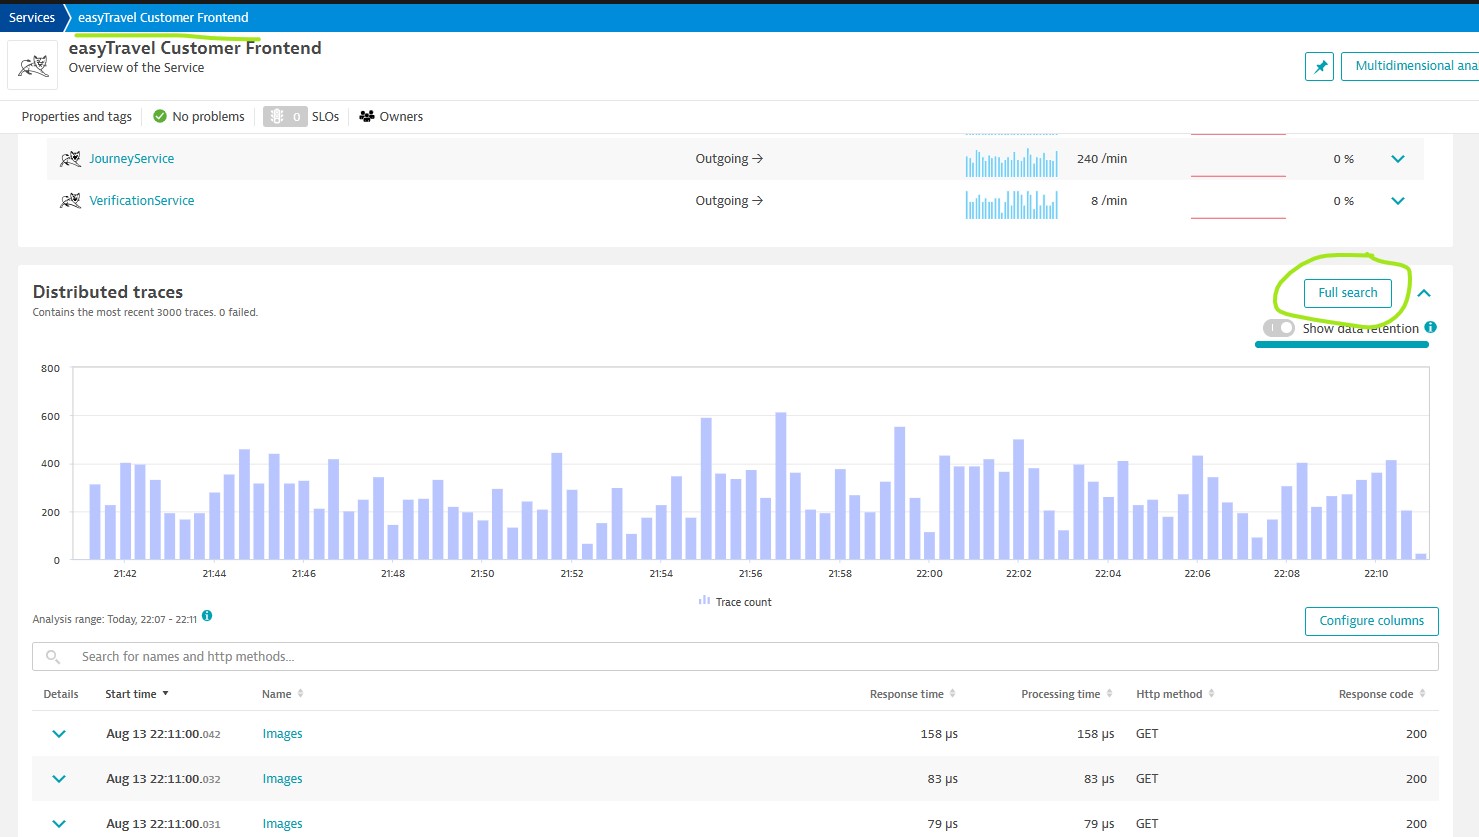
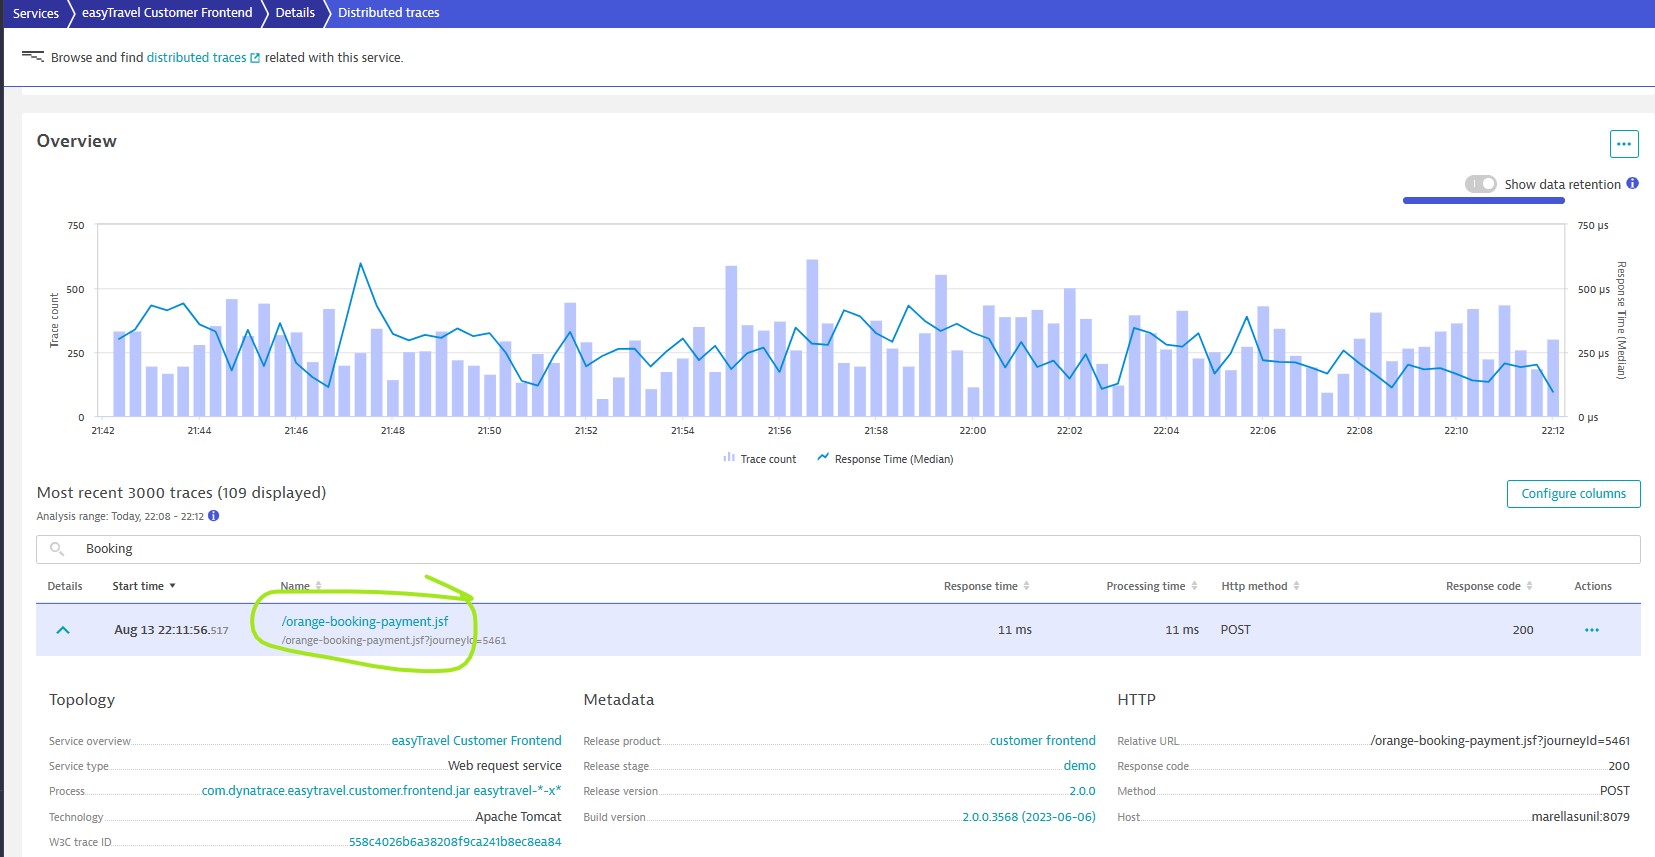
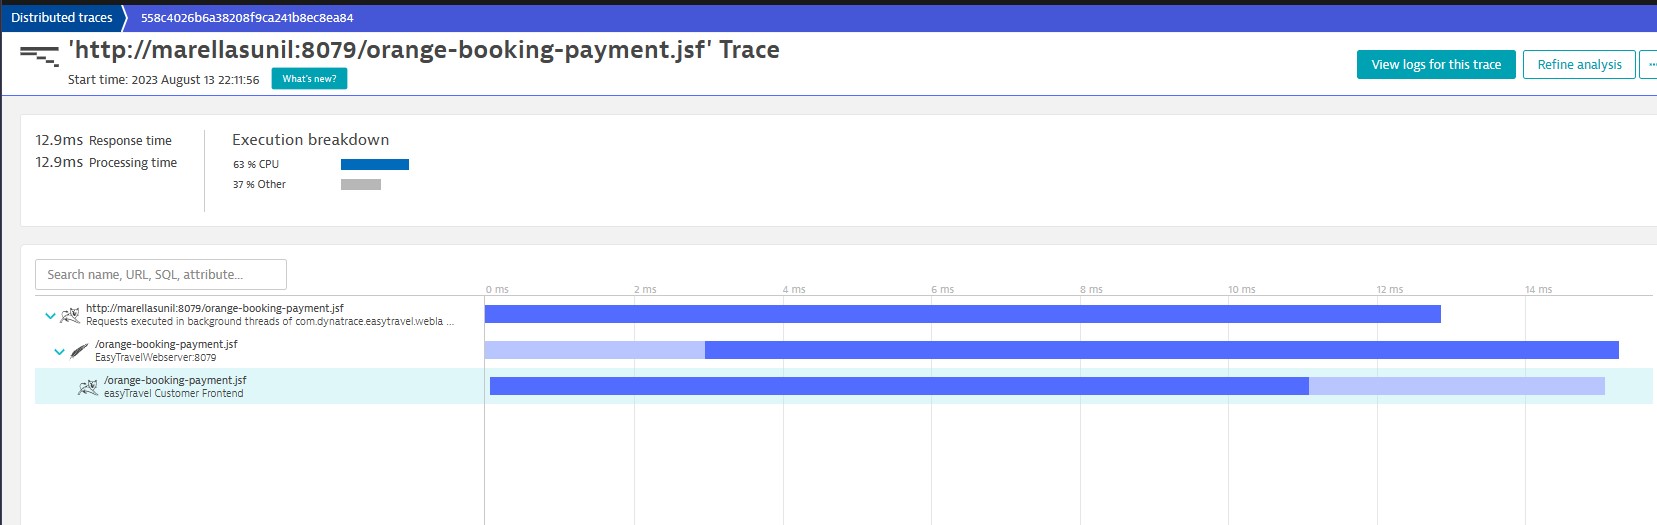
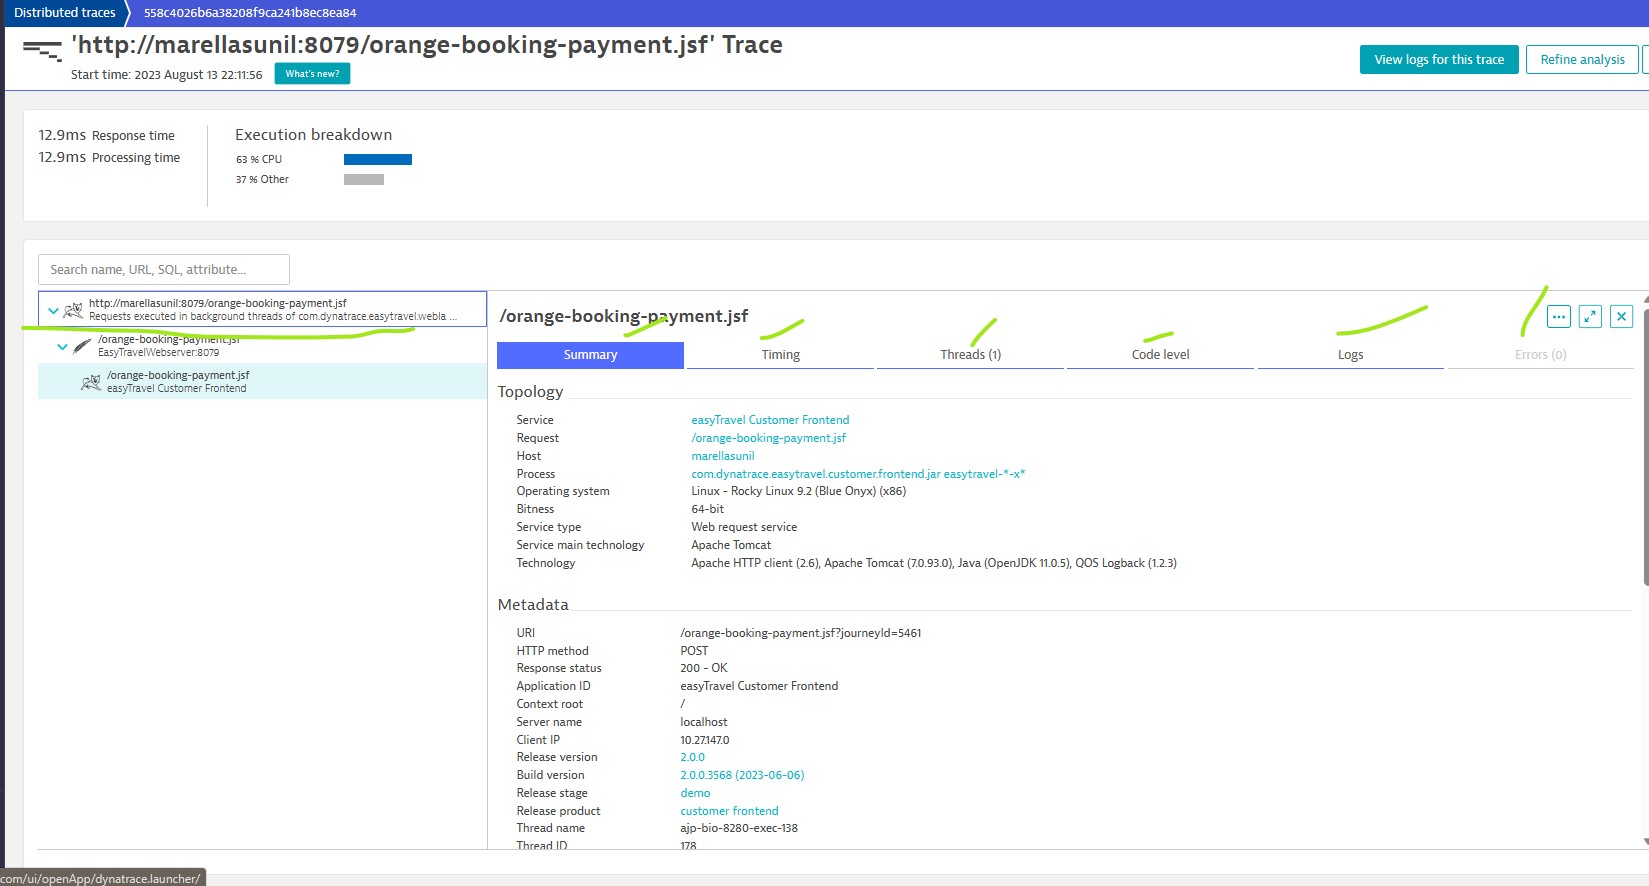
Exploring PurePaths
Purepath distributed traces combine distributed tracing with code-level visibility, topology information and metadata to provide the highest level of data granularity and fidelity.
Purepath is the execution of a single service request or the execution of a single class method or function.
Exploring Backtrace
When troubleshooting a service, it can be helpful to know the sequence of service calls that lead up to each request. Dynatrace can show you call sequences all the way back to the browser click that triggers the sequence of calls.
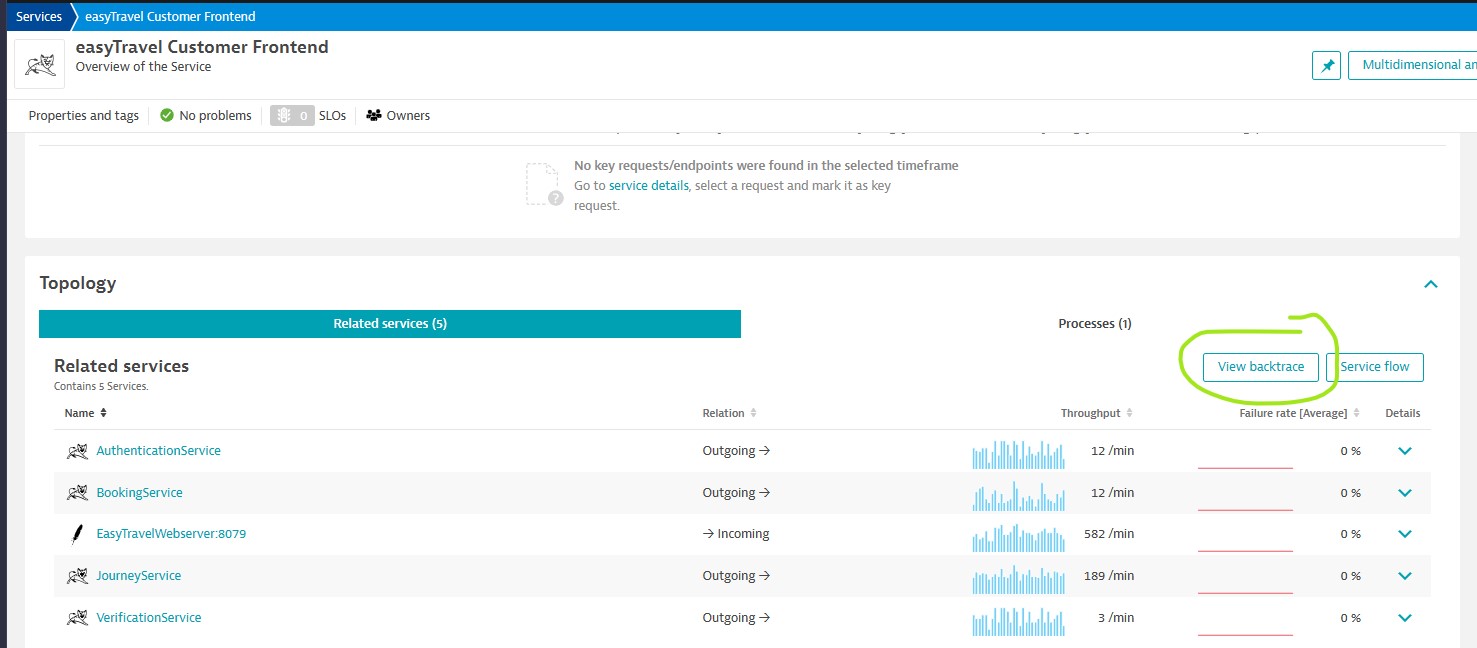
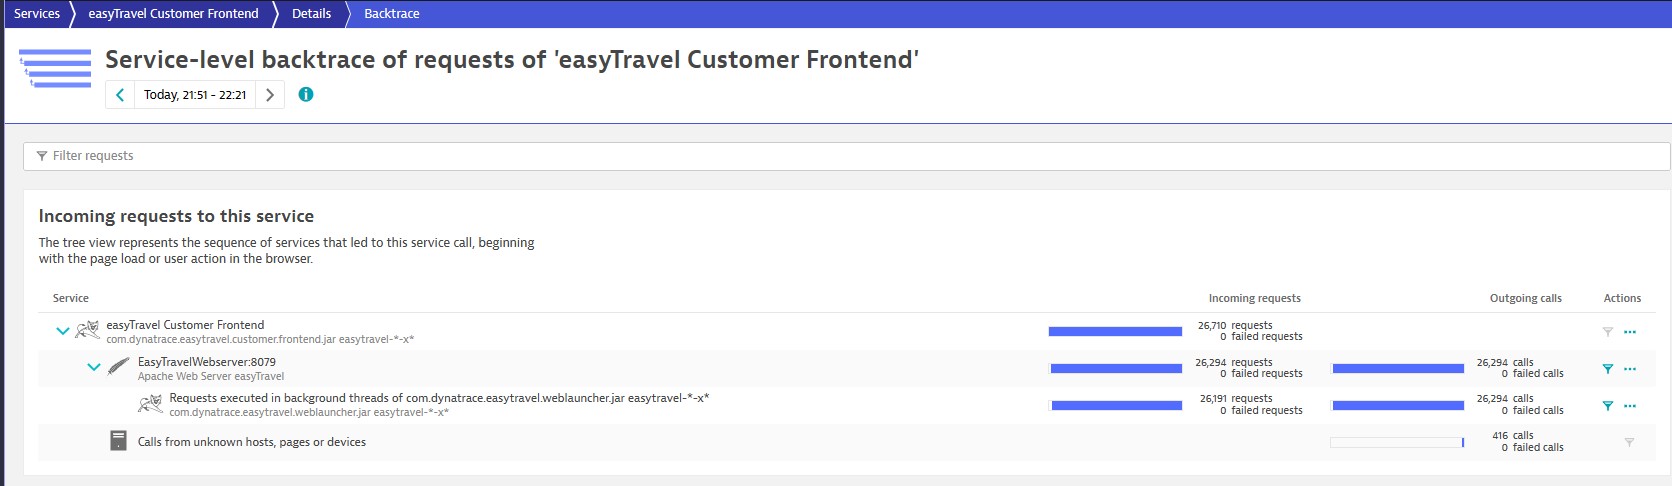
Select any service to see Requests & Instances.
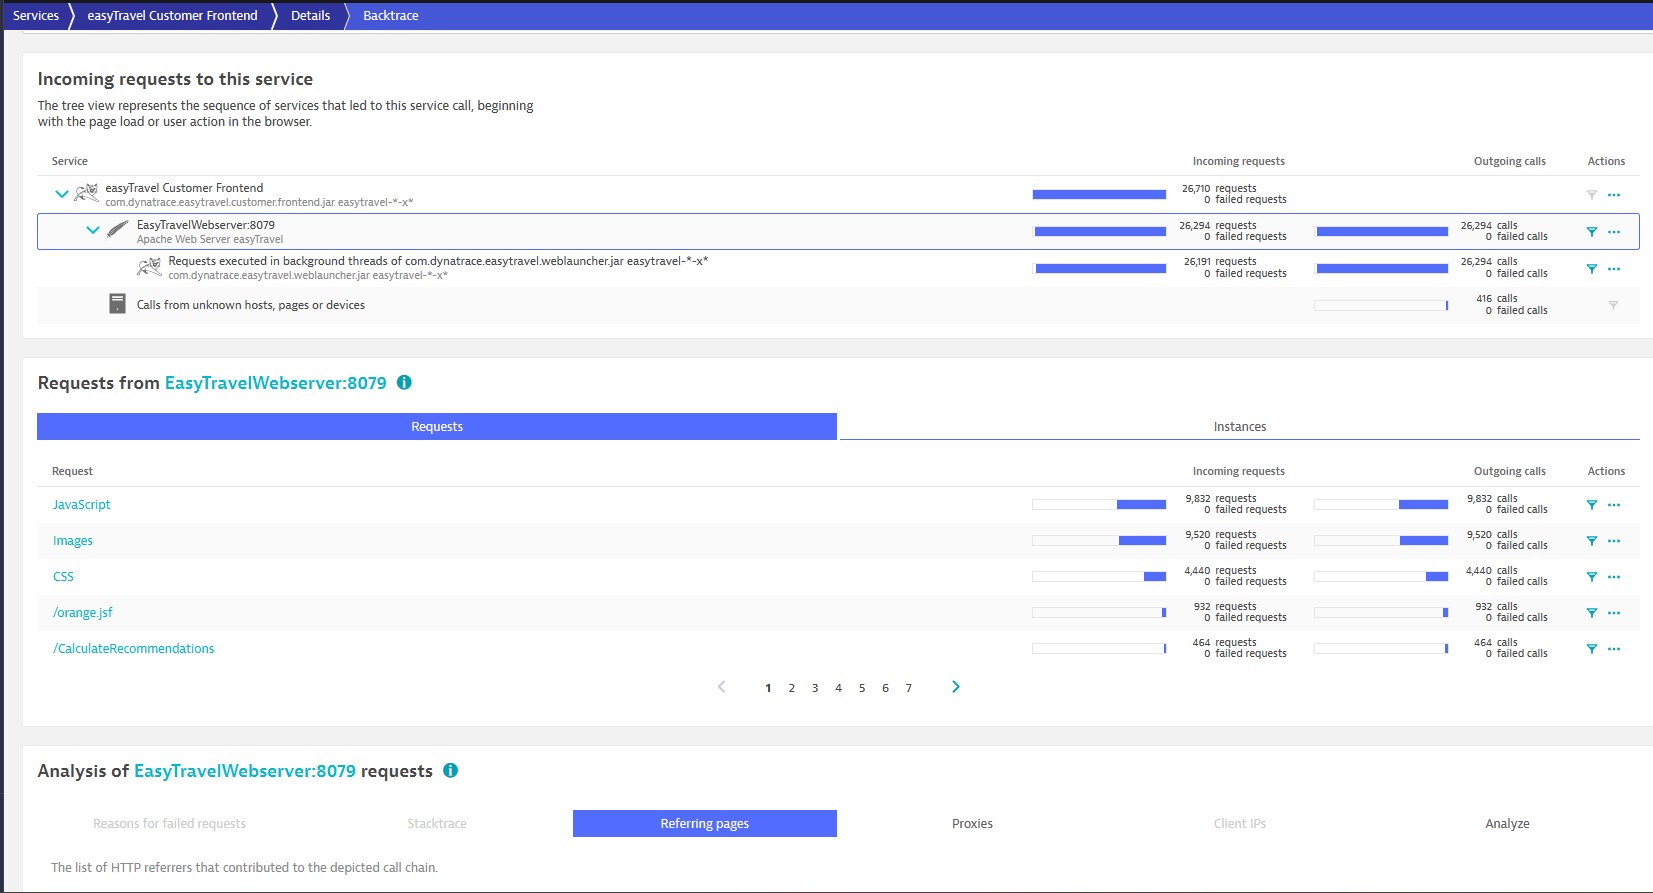
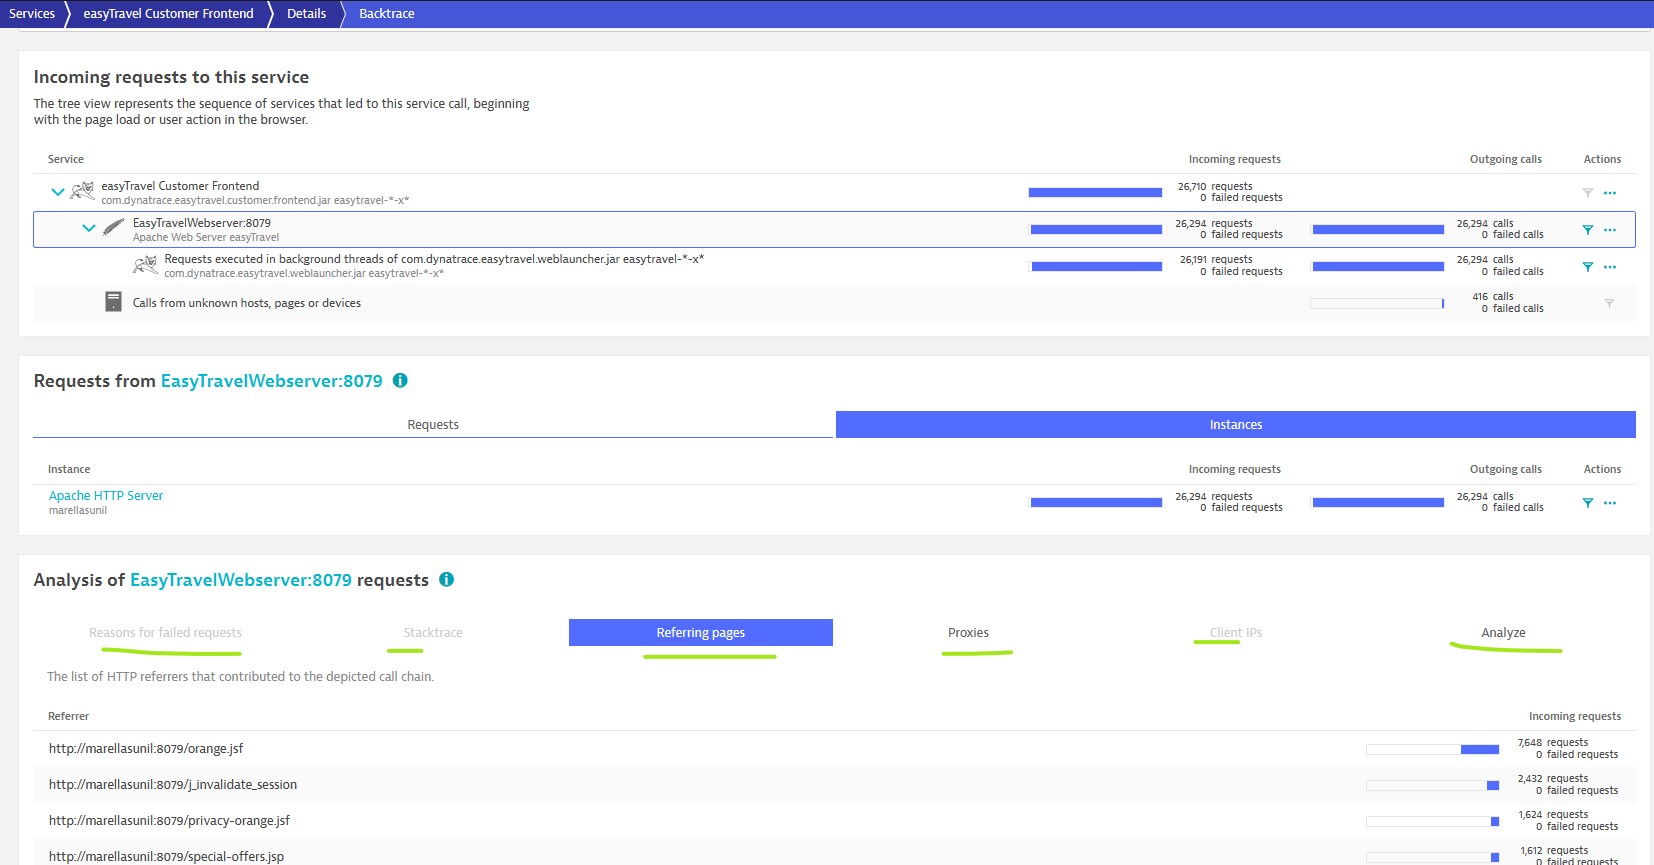
- Reasone failed request display errors and associated HTTP response code.
- Stacktrace display specific part of the code that executed the request.
- Referring page display URL that contributed to specific backtrace flow.
- Proxy tabs display any proxies / Load balancers components that handle requests.
- Client IPs display if communication initiated by a web browser.
- Analyze tab makes it easy for us to continue troubleshooting this specific set of requests with the other analysis tools offered by Dynatrace.
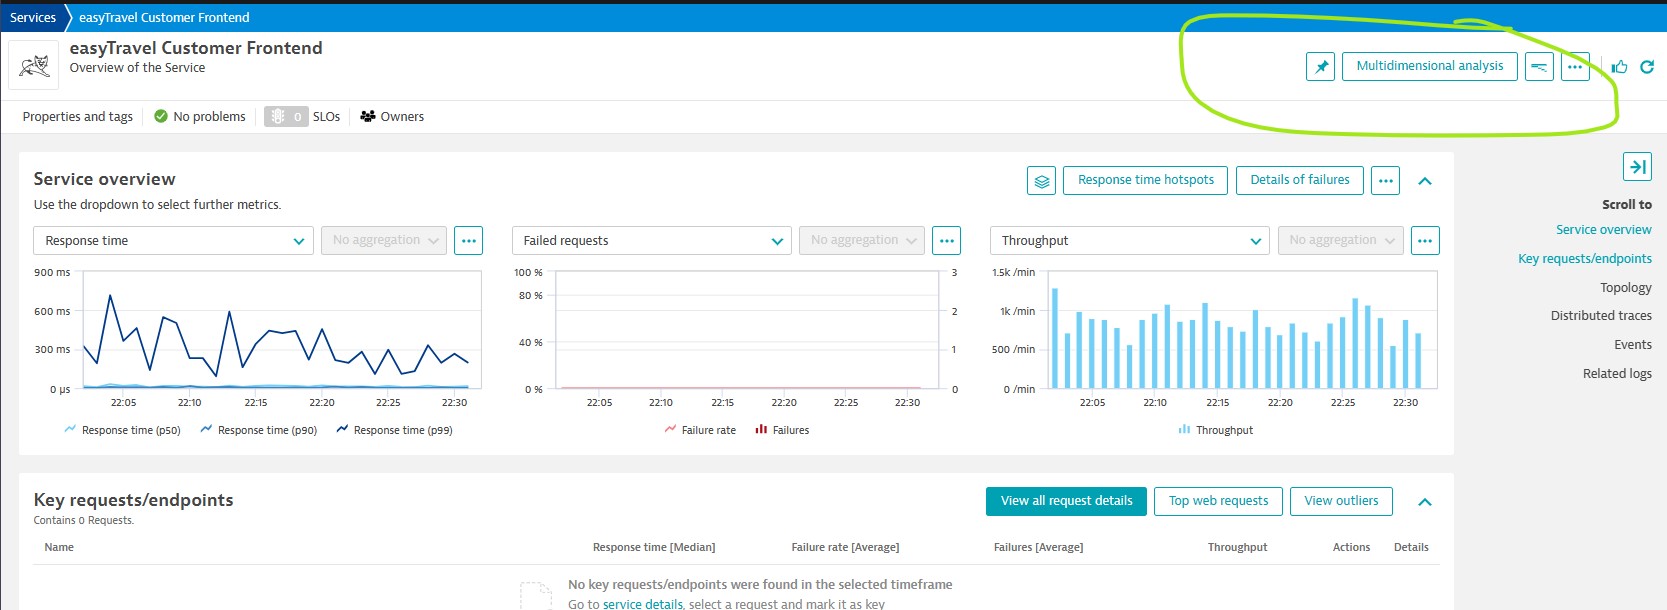
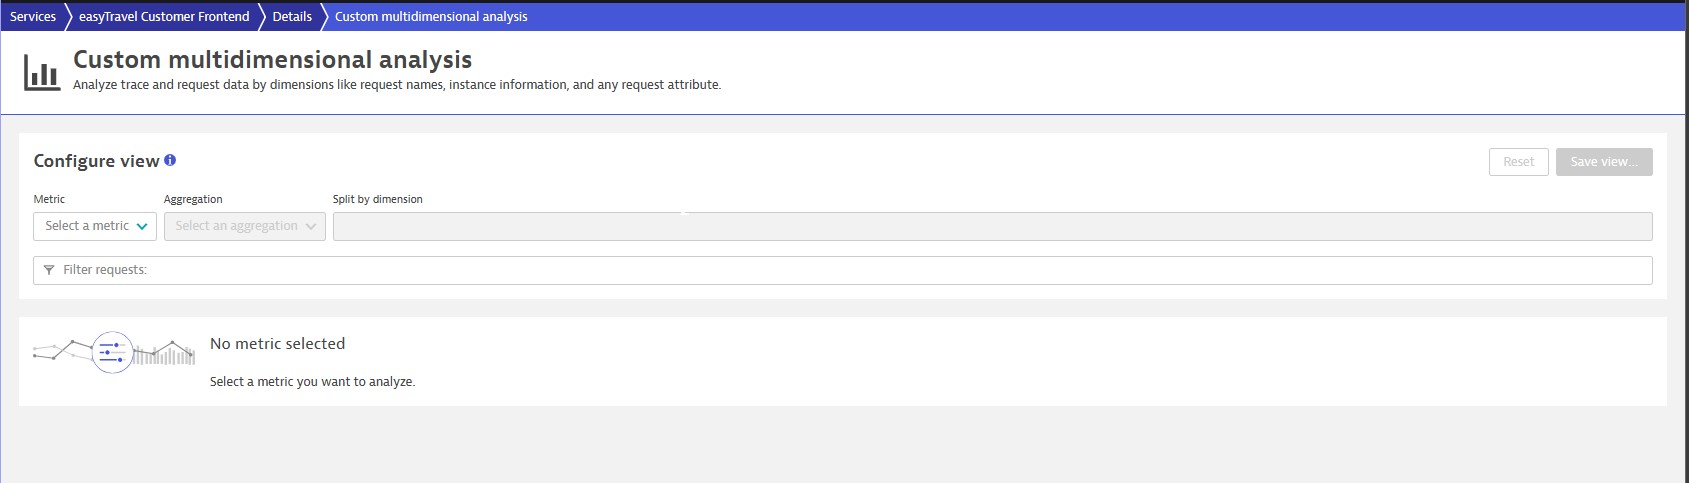
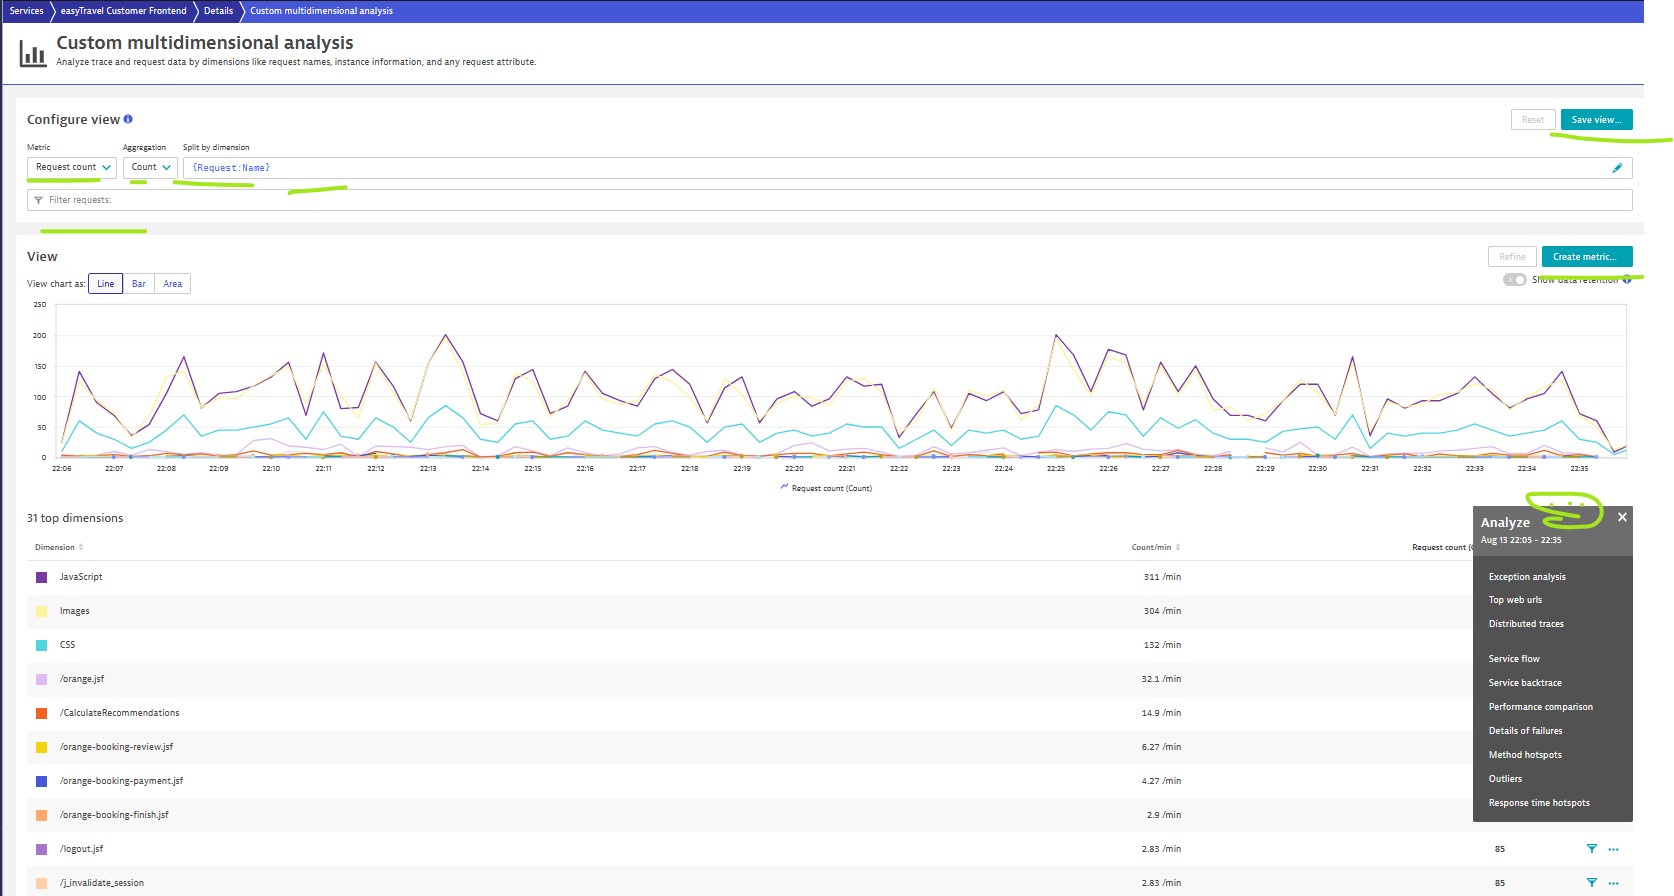
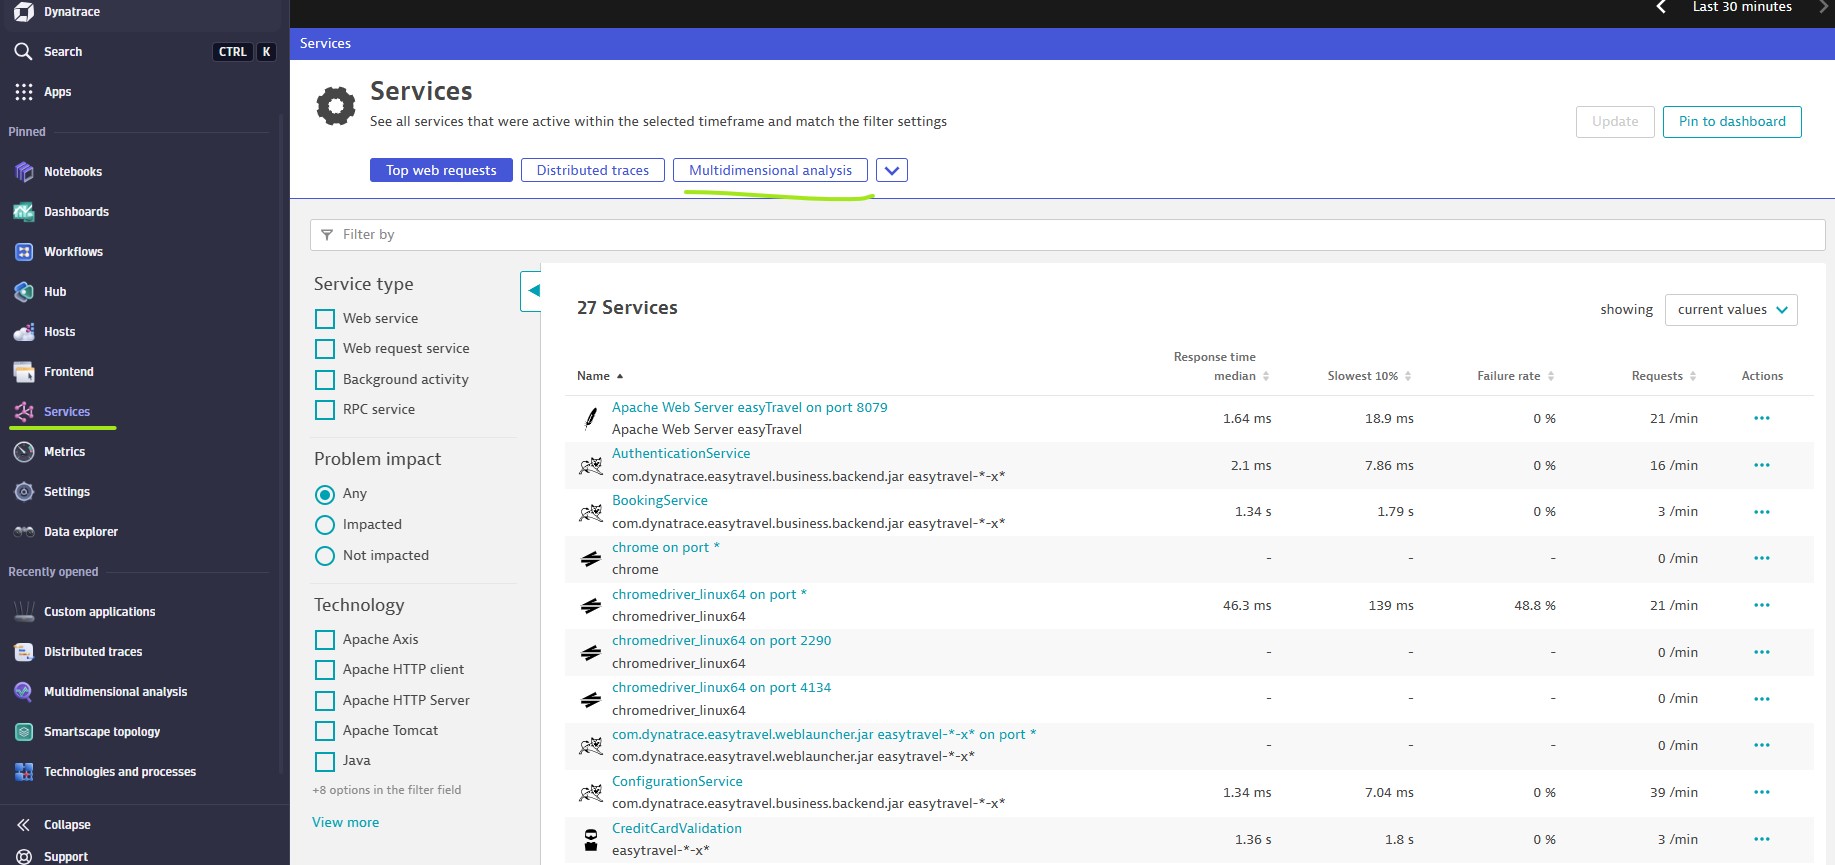
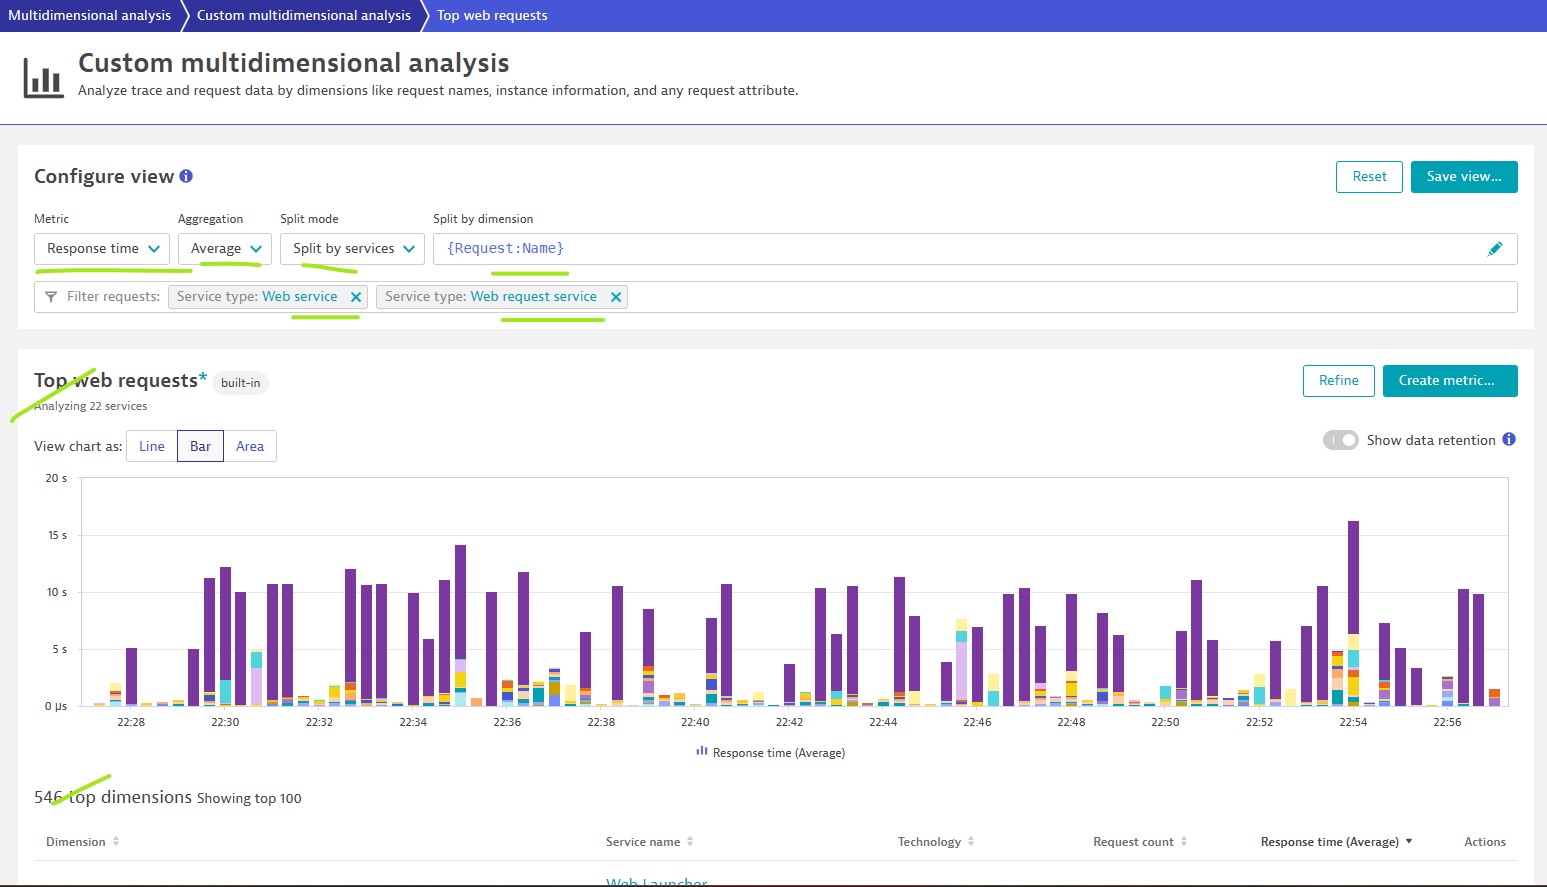
Multidimesntional Analysis
Dynatrace provide flexible views of transactions and services through the multidimensional analysis tool. This enables users to compare and contrast deep-dive details of a wide range of perspectives.
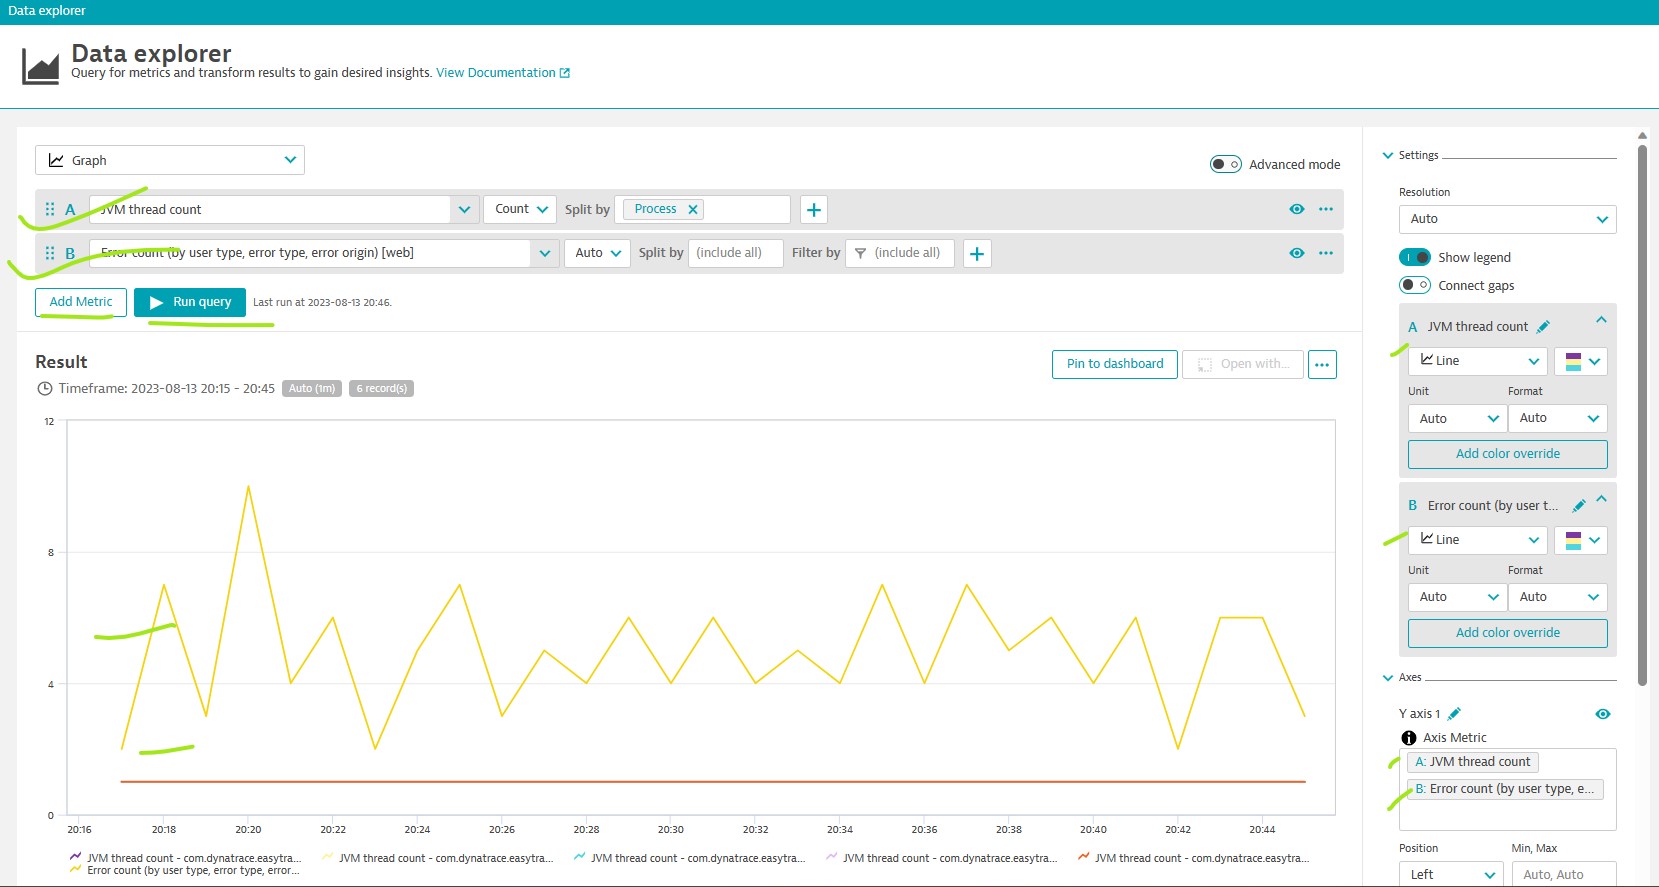
Charting with the Data Explorer
Data explorer greatly enhance abilities to query and chart metrics.

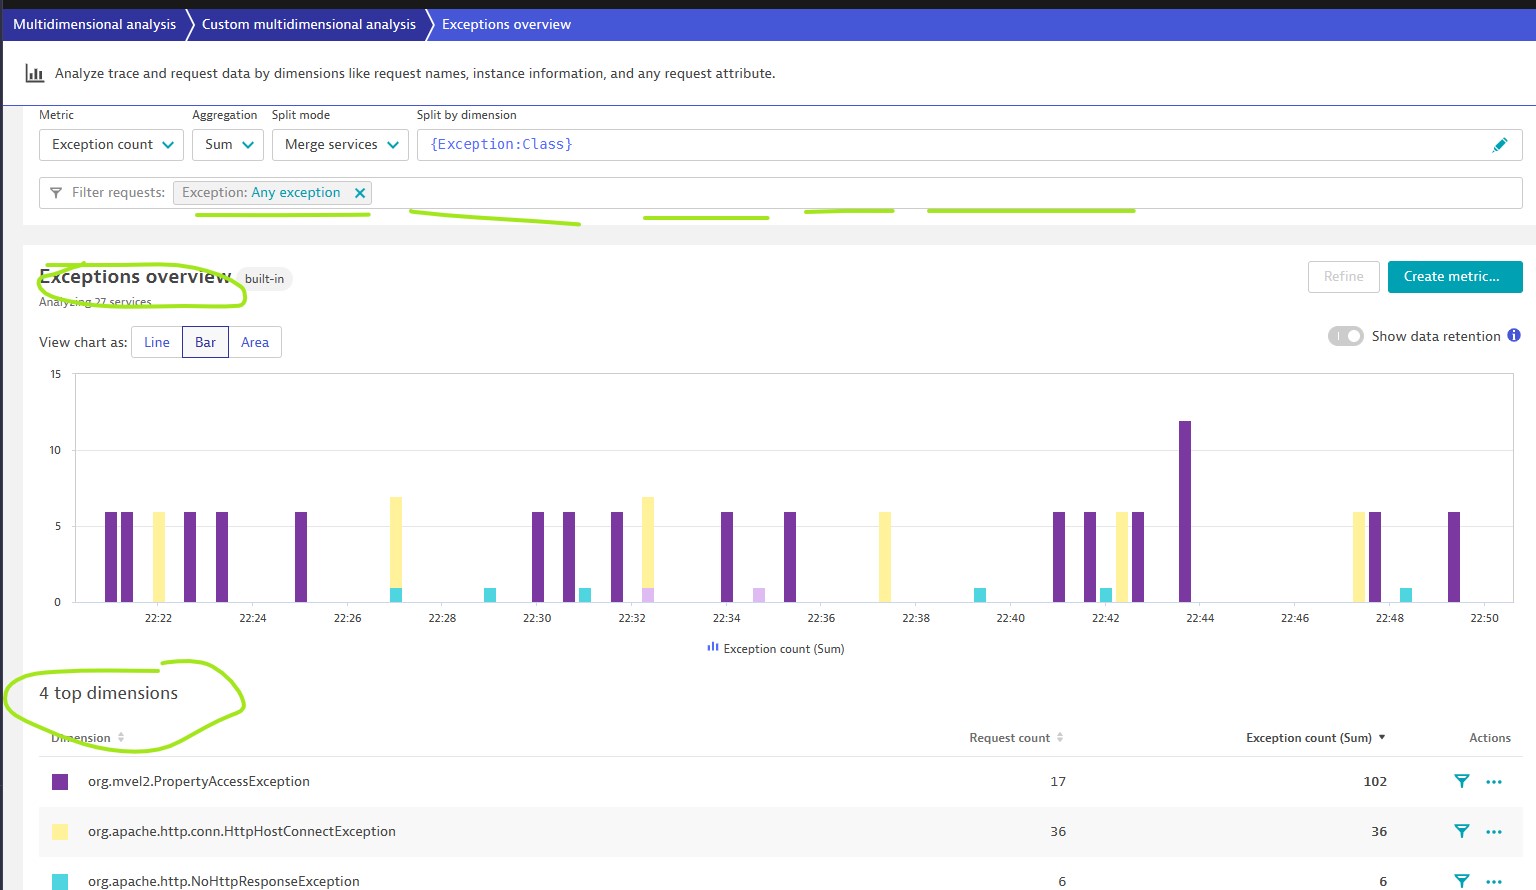
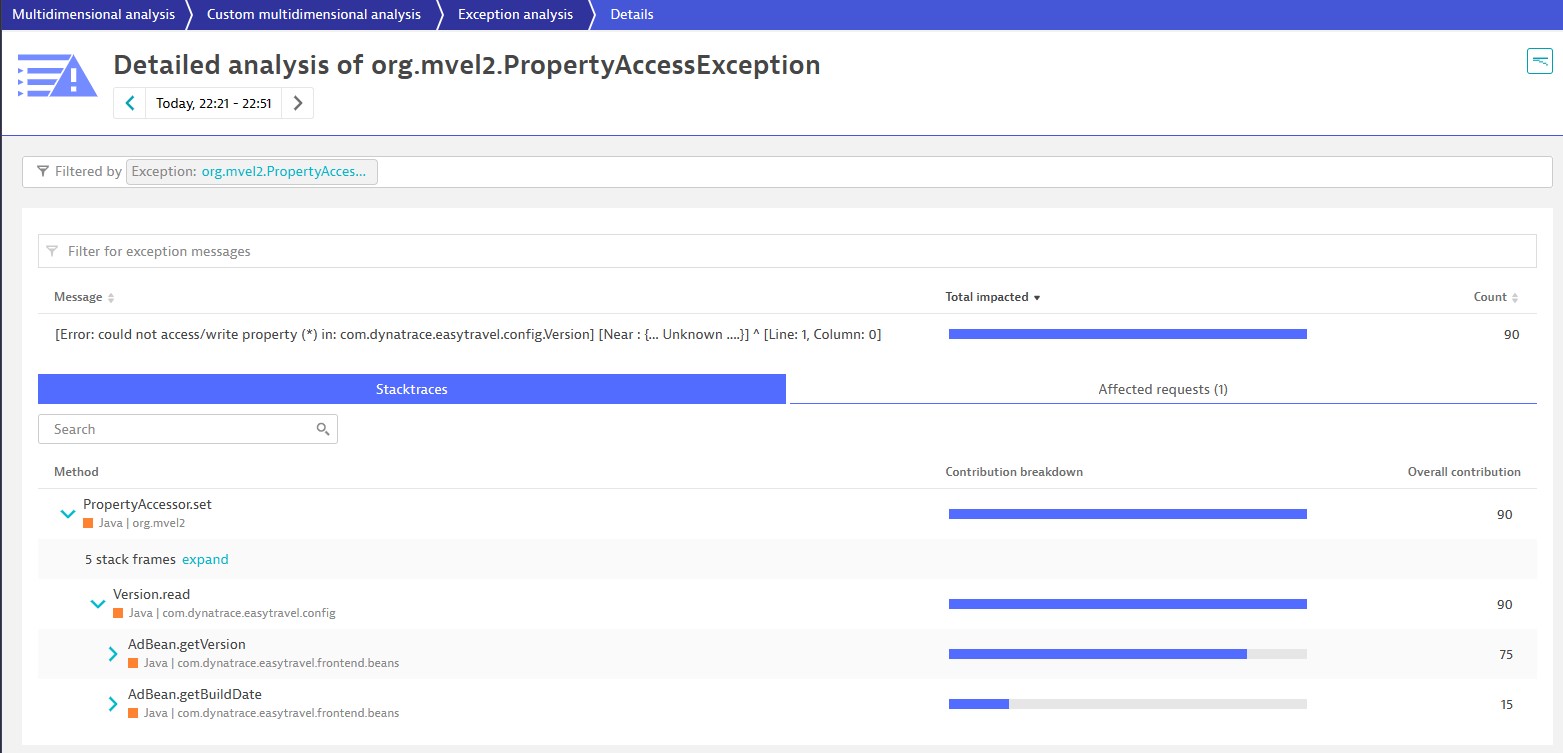
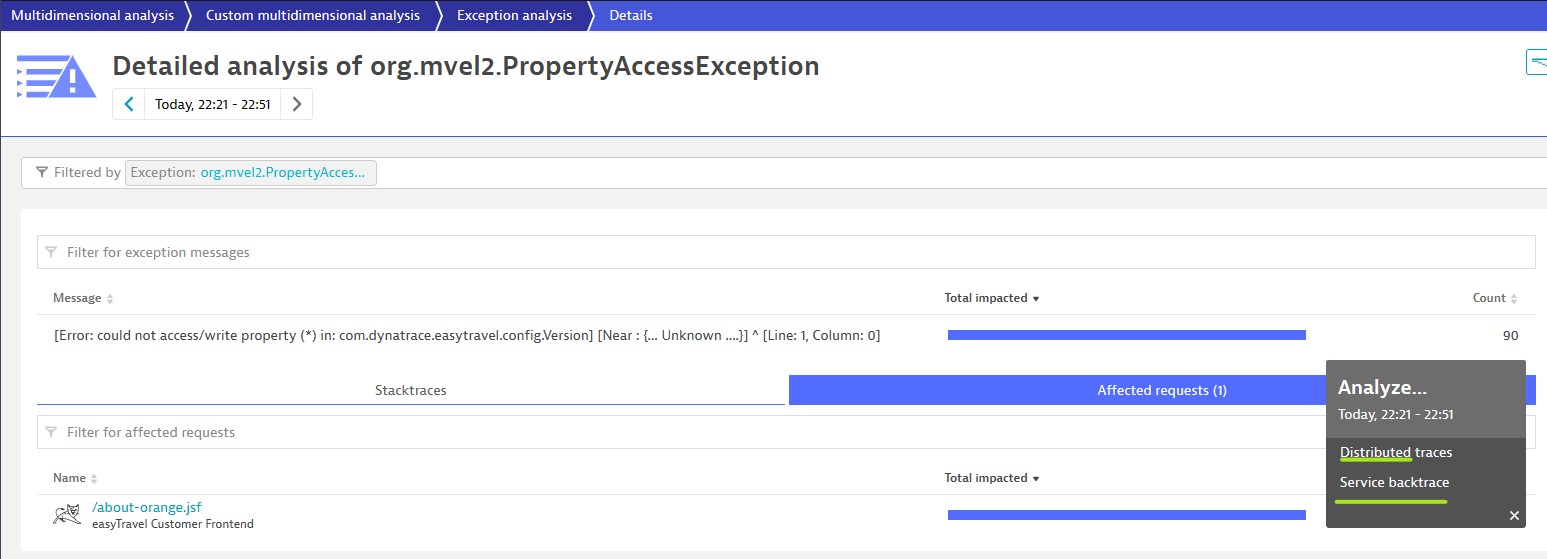
Exception Analysis
This will allow you to see which exceptions occurred during selected timeframe.


Top Web Requests
Main Page: Services
Next Page: Process Groups
Dynatrace : Main Page