MyObservability
Real User Monitoring
Dynatrace Real User Monitoring (RUM) gives you the power to know your customers by providing performance analysis in real time. With Dynatrace RUM, you have the context over time and immediate analysis to the complete picture of your end-user experience.
This includes
- All user actions taken and how the various actions impact performance.
- Identify problems or errors that occurred
- User experience ratings
- Geo location breakdowns
- gain insight into the behavior of your users and much more
Note: Dynatrace Real User Monitoring is licensed based on the consumption of user sessions.
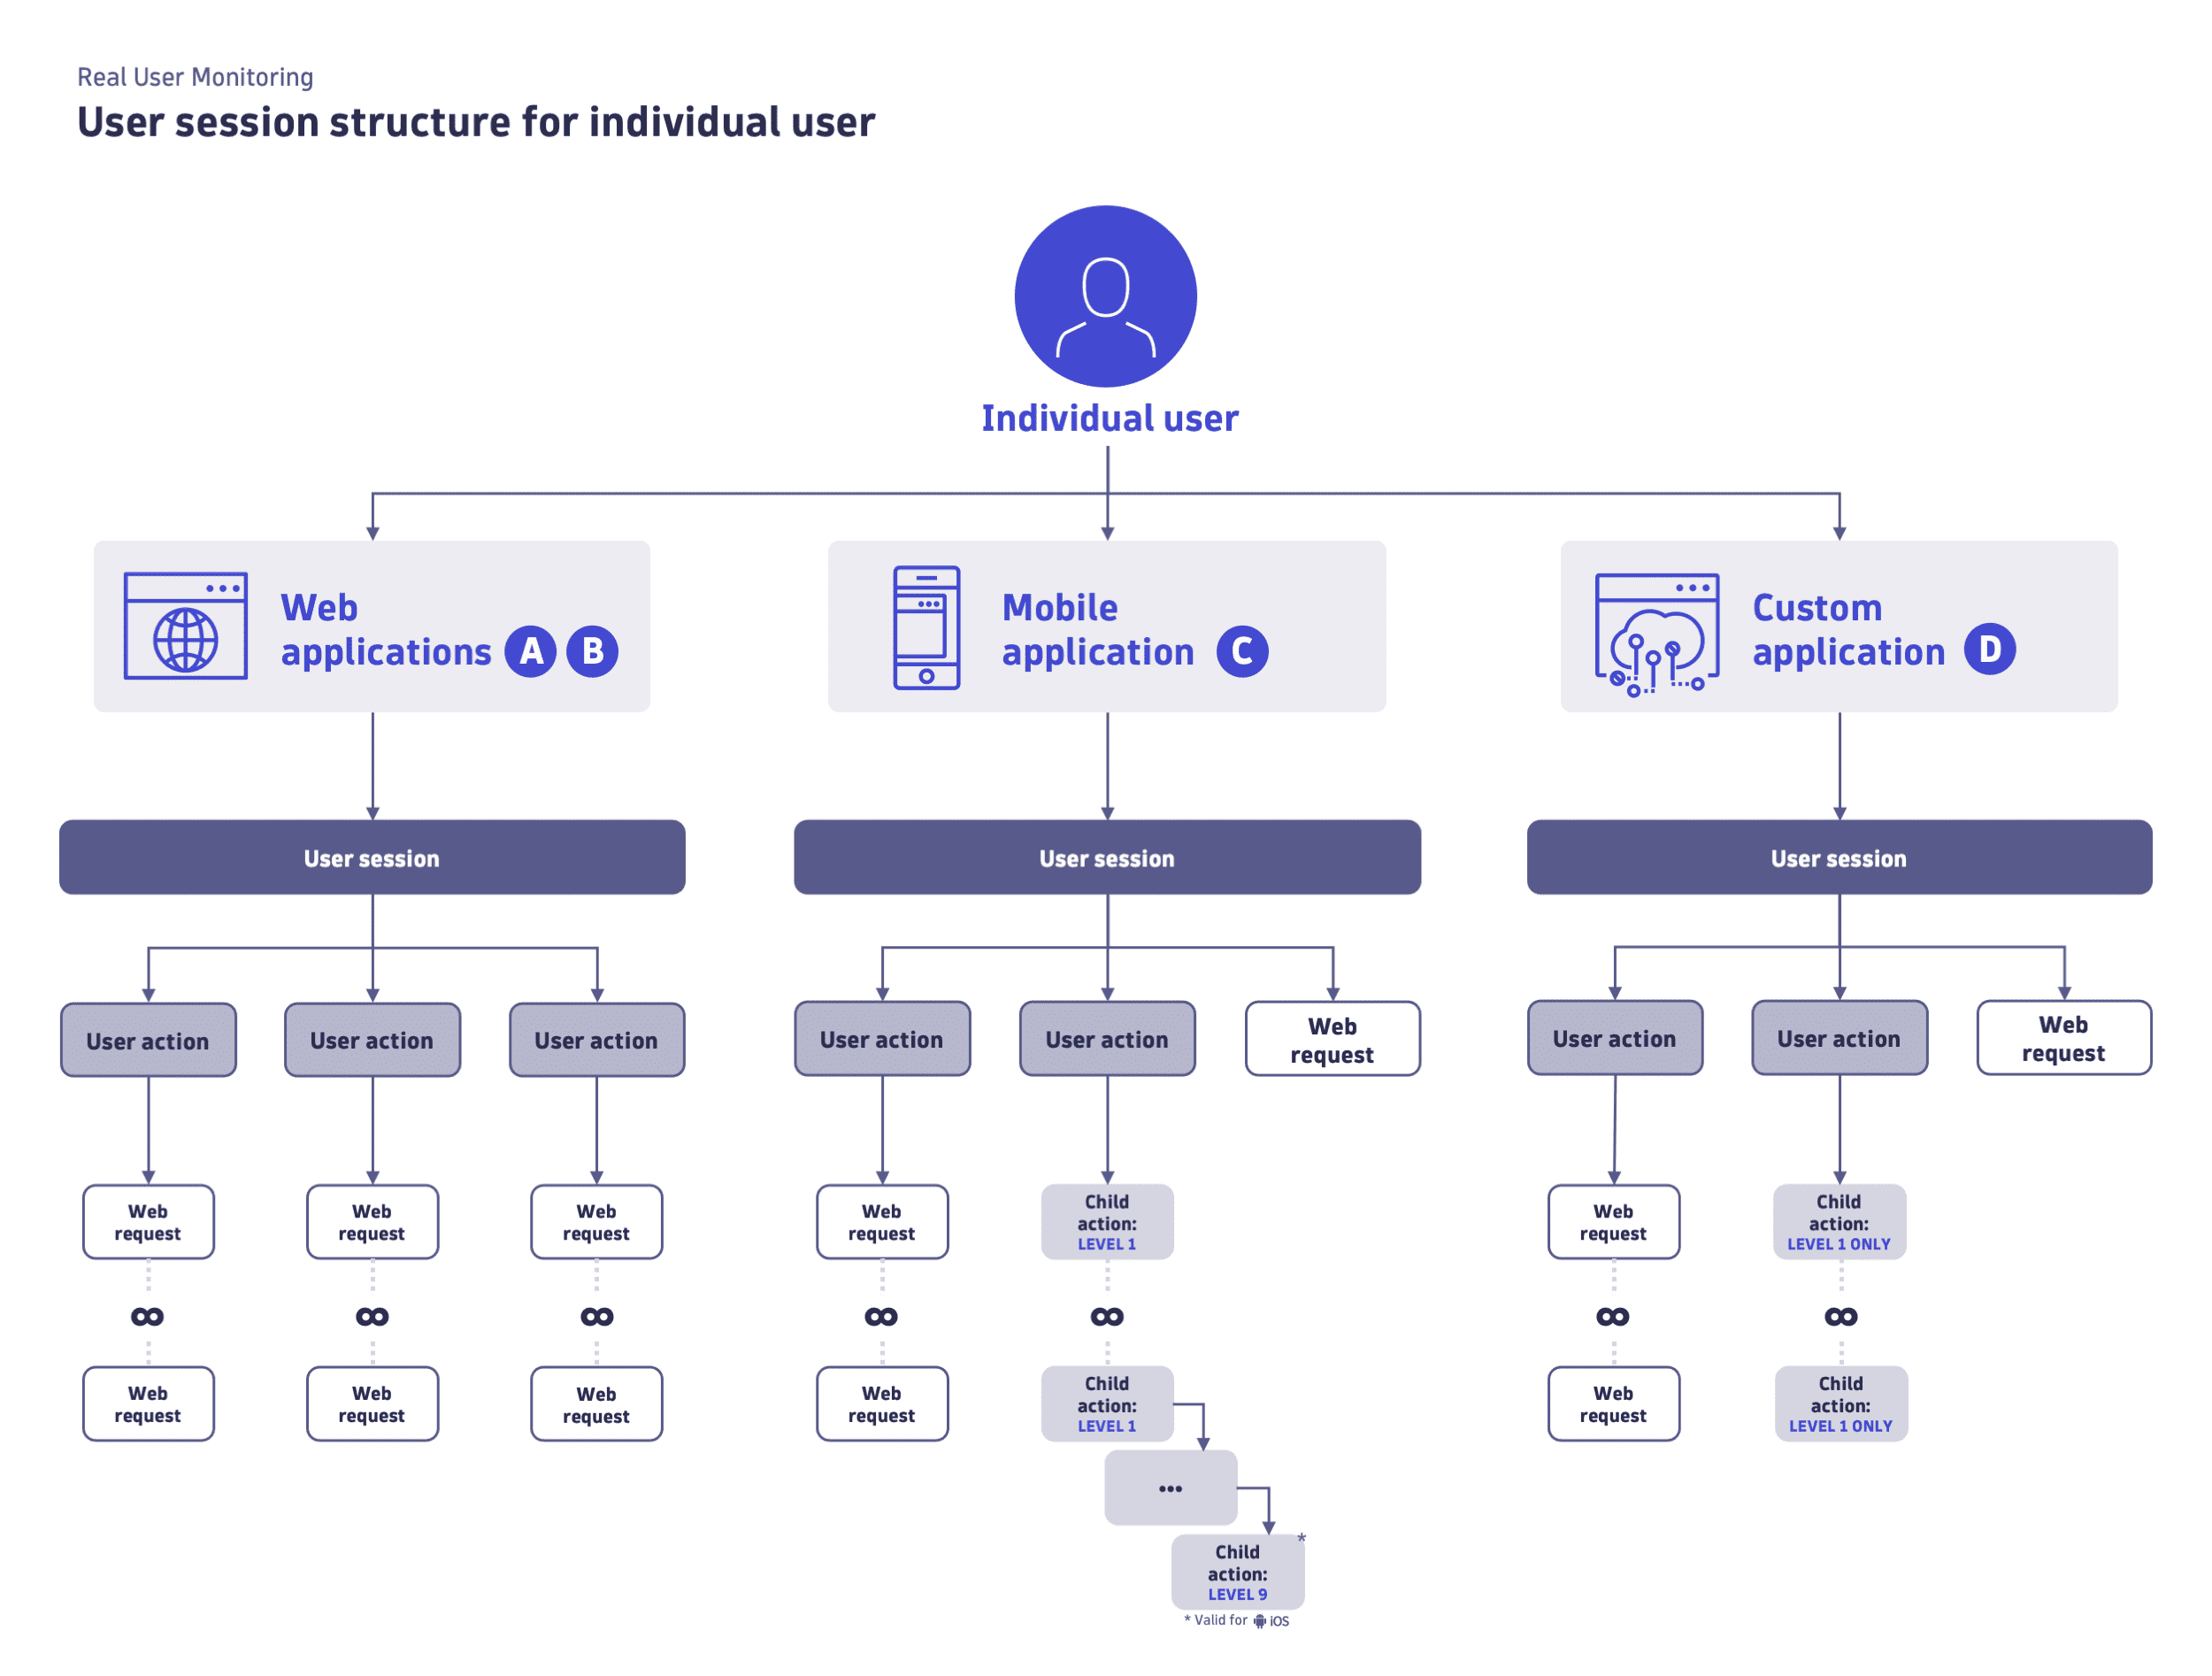
The basic concepts of RUM revolve around
-
User sessions: “user visit” performed in your application. Dynatrace captures user sessions of web, mobile, and custom applications. A user session can span multiple applications.
-
User actions: A user action is an interaction with an end-user interface that involves a call to a web server, which can potentially have multiple nested calls. It is a transformation from one view to another view that is triggered by a user input, for example, a page load, click, or touch.
- Action types for web applications
- Load actions: A load action is defined as an actual page loading in your browser. During this action type, many resources are loaded, including images, HTML, and CSS.
- XHR actions: If user interaction leads to XmlHttpRequests or fetch() calls, an XHR action is created.
- Custom actions: Rather than relying on default user action generation, you may want to fine-tune your Real User Monitoring by adding additional user actions directly into your application’s HTML.
- Action types for web applications

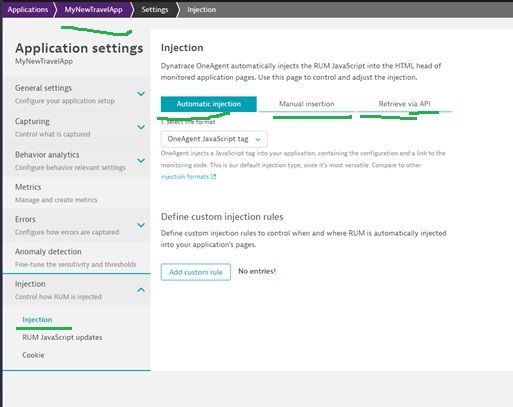
RUM JavaSctipt Injection
- Automatic Injection: If you install OneAgent on web server, Dynatrace automatically monitor Web Application.
- Manual Injection/Agentless monitoring
- Retrieve via REST API: Use the Dynatrace API to insert the RUM JavaScript via build scripts.
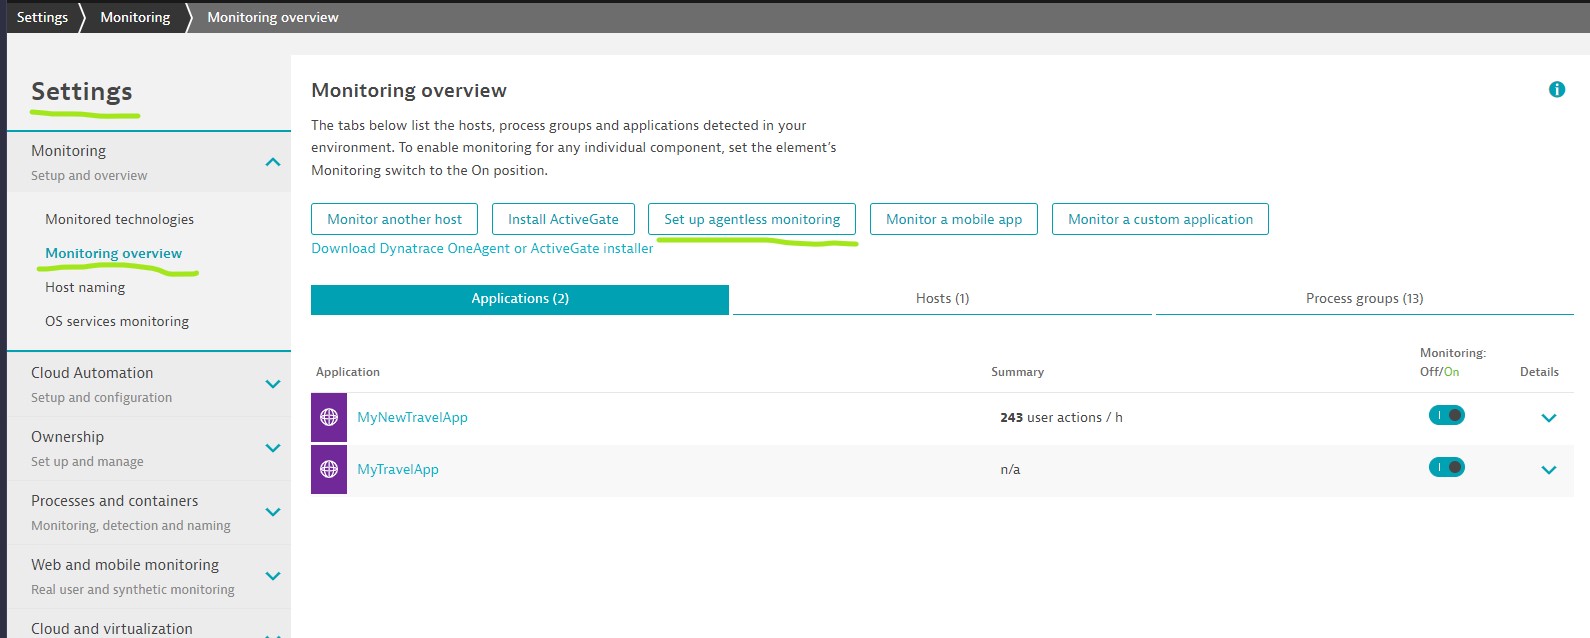
Agentless monitoring
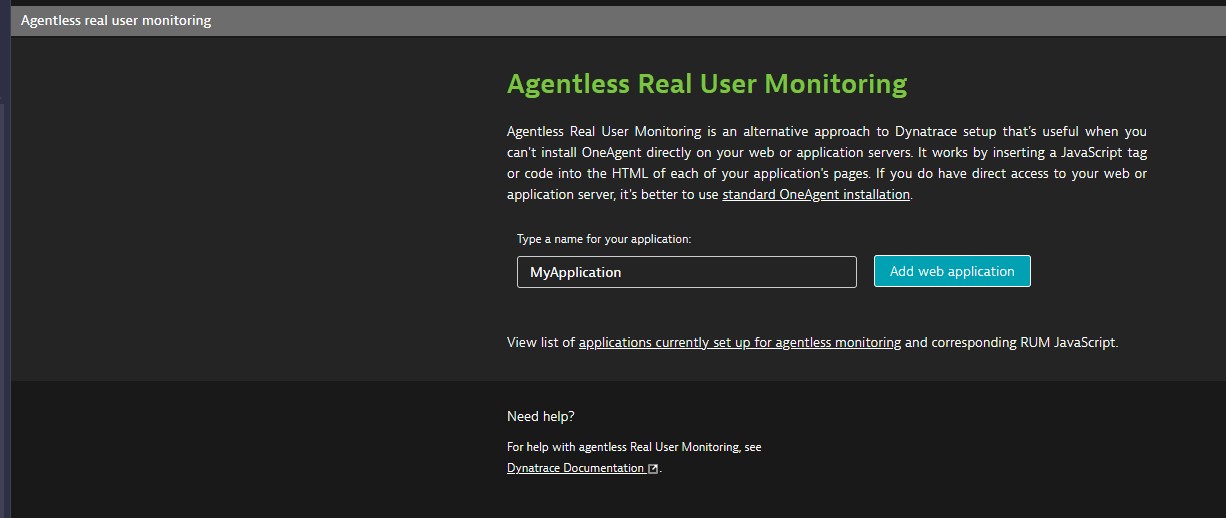
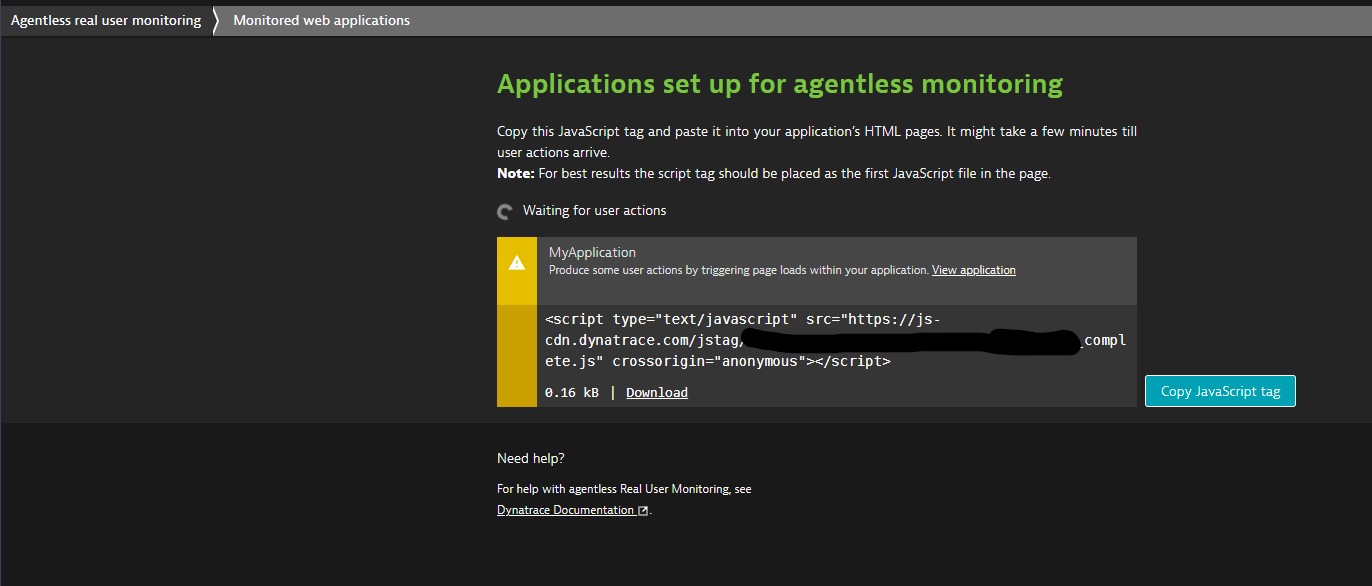
- Copy JavaScript tag and paste it into your application’s HTML pages. It might take a few minutes till user actions arrive.
Note: For best results the script tag should be placed as the first JavaScript file in the page.
RUM Application definition
- If your web applications are running on systems where you can install OneAgent, Dynatrace automatically injects the RUM JavaScript into the HTML pages.
- For mobile and custom applications, the definition is generated when you create the application and start setting up the Dynatrace monitoring. These application types are not monitored in an automated way.
Supported Application types
-
Web applications
- Dynatrace RUM Javascript - JavaScript-enabled browser (mobile or desktop)
- Inject RUM Javascript automatically by one agent
- Manually inject for agentless monitoring
- Use Dynatrace browser extension - For SaaS/3rd party applications.
- Dynatrace RUM Javascript - JavaScript-enabled browser (mobile or desktop)
-
Mobile applications
- Native mobile application on iOS or Android.
- OneAgent for iOS or Android.
- For hybrid applications, the browser part is monitored by the RUM JavaScript
- Native mobile application on iOS or Android.
-
Custom applications
- Any digital touchpoint a customer wants to monitor—from rich client applications over applications running in a car up to IoT applications with user interactions.
- Injection is done by the customer using Dynatrace OpenKit for their technology.
- Any digital touchpoint a customer wants to monitor—from rich client applications over applications running in a car up to IoT applications with user interactions.
Application Management
Follow Application Management for setup & more information.
Analyzing RUM
In the below section,
- Analyzing Application User Behavior
- User Session Segmentation
- Analyzing User Sessions - Advanced USQL
- Session Replay
Analyzing Application User Behavior
User behavior analytics provides fast insights into how your application is used so you can focus on
- Most relevant areas of your application
- Track adoption of new features
- See where drop-offs and bounces occur.
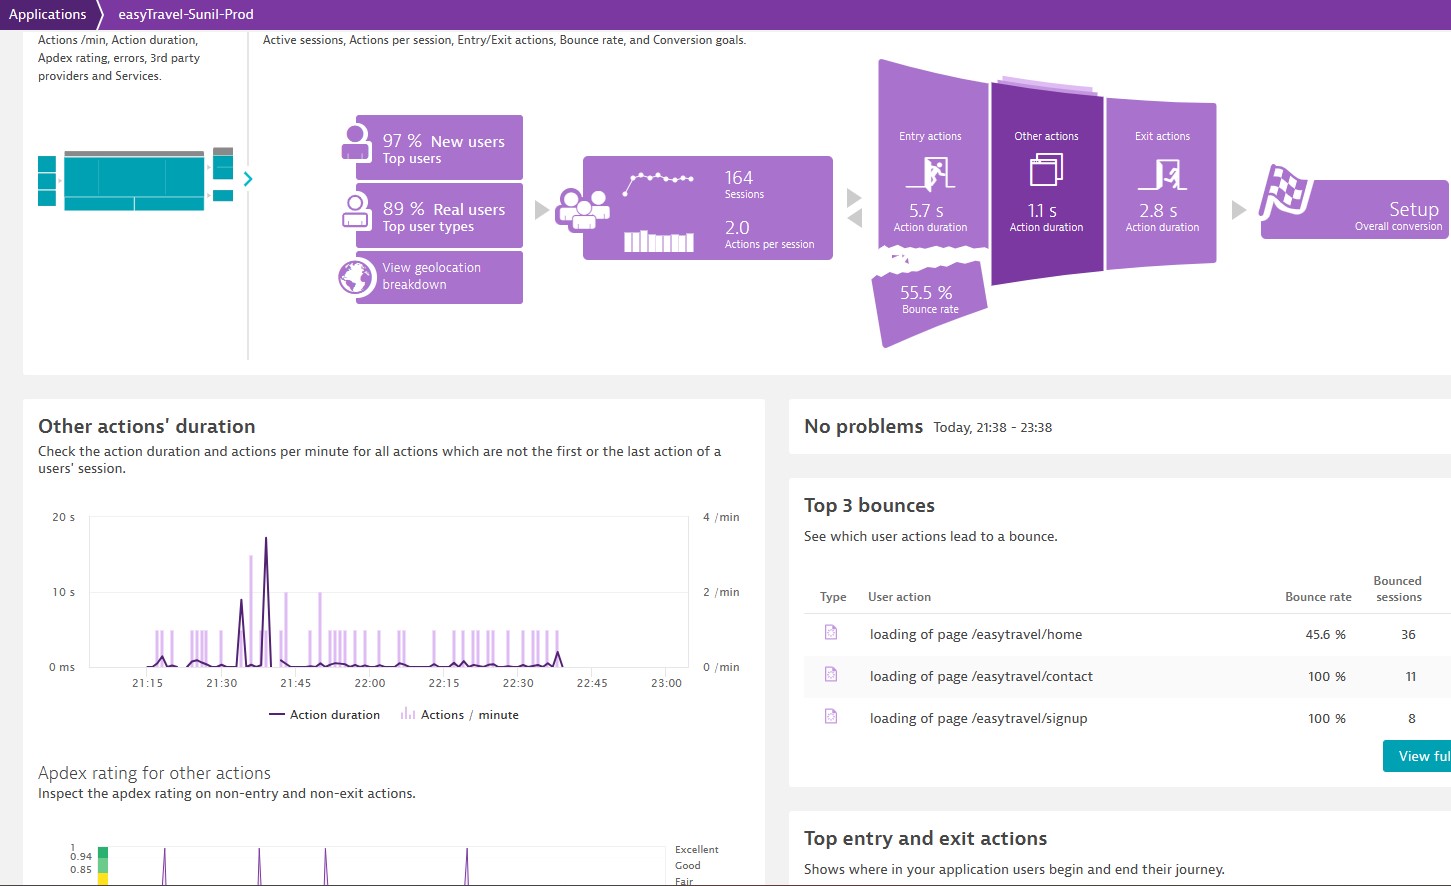
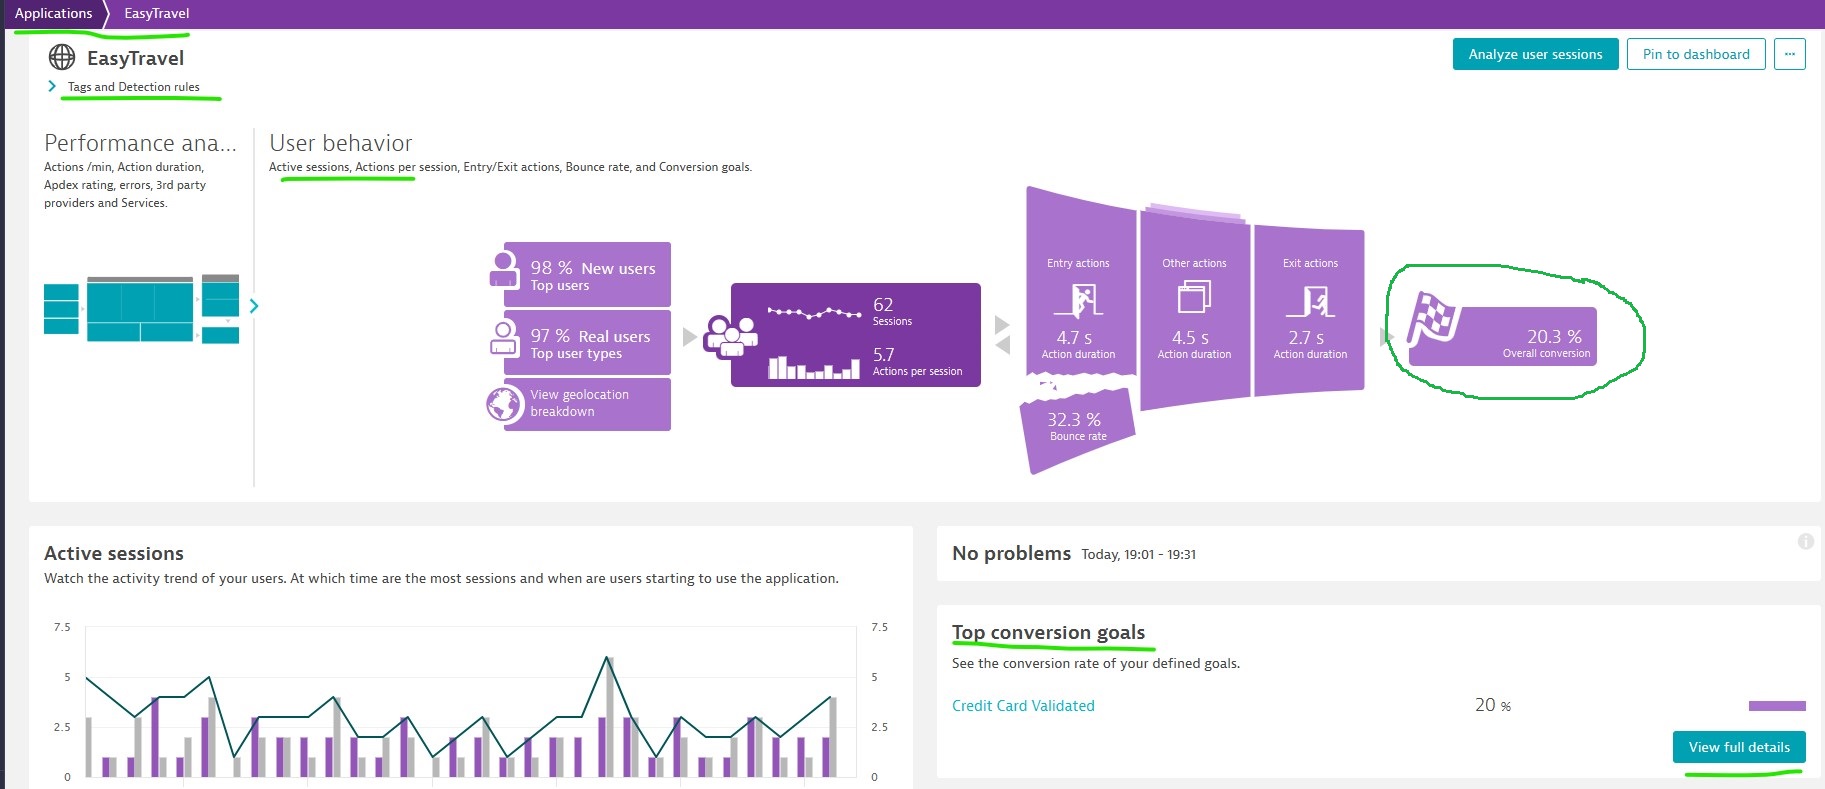
Each application have user behavior section,
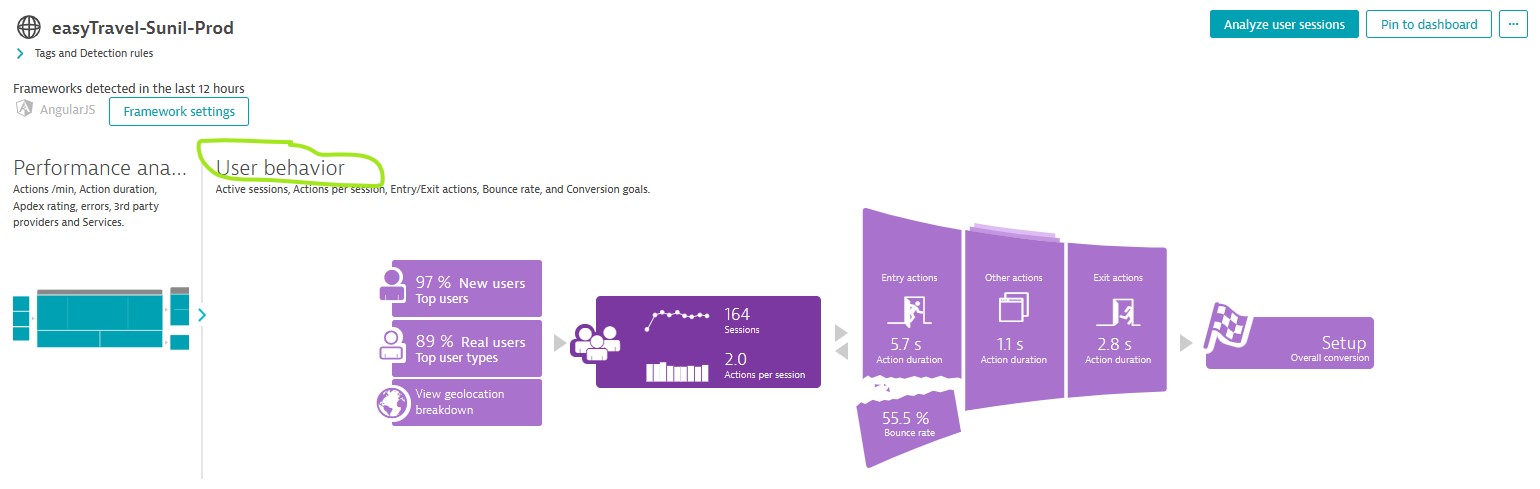
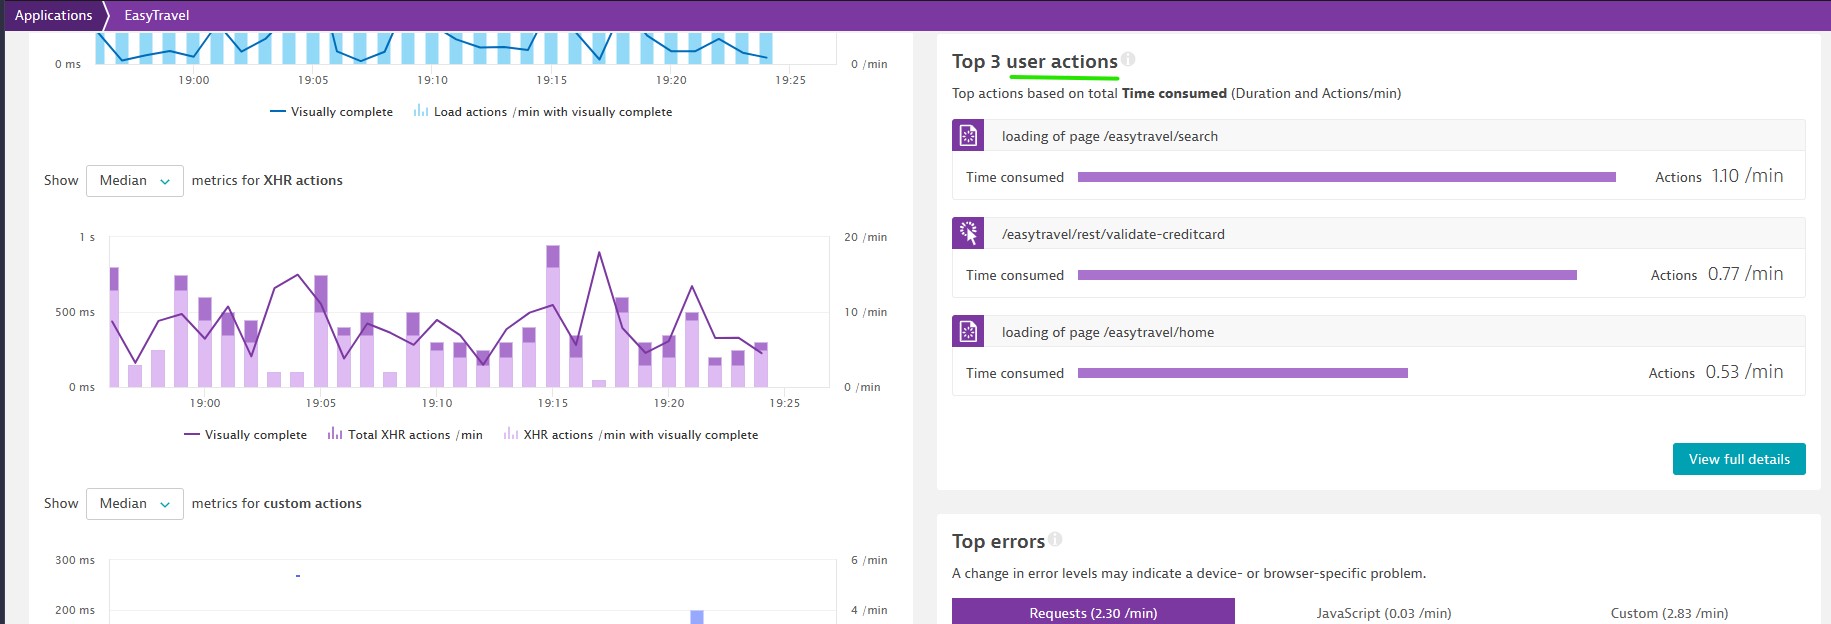
Below behavioral analytics provide insights into the most important actions and can guide the optimization of your application.
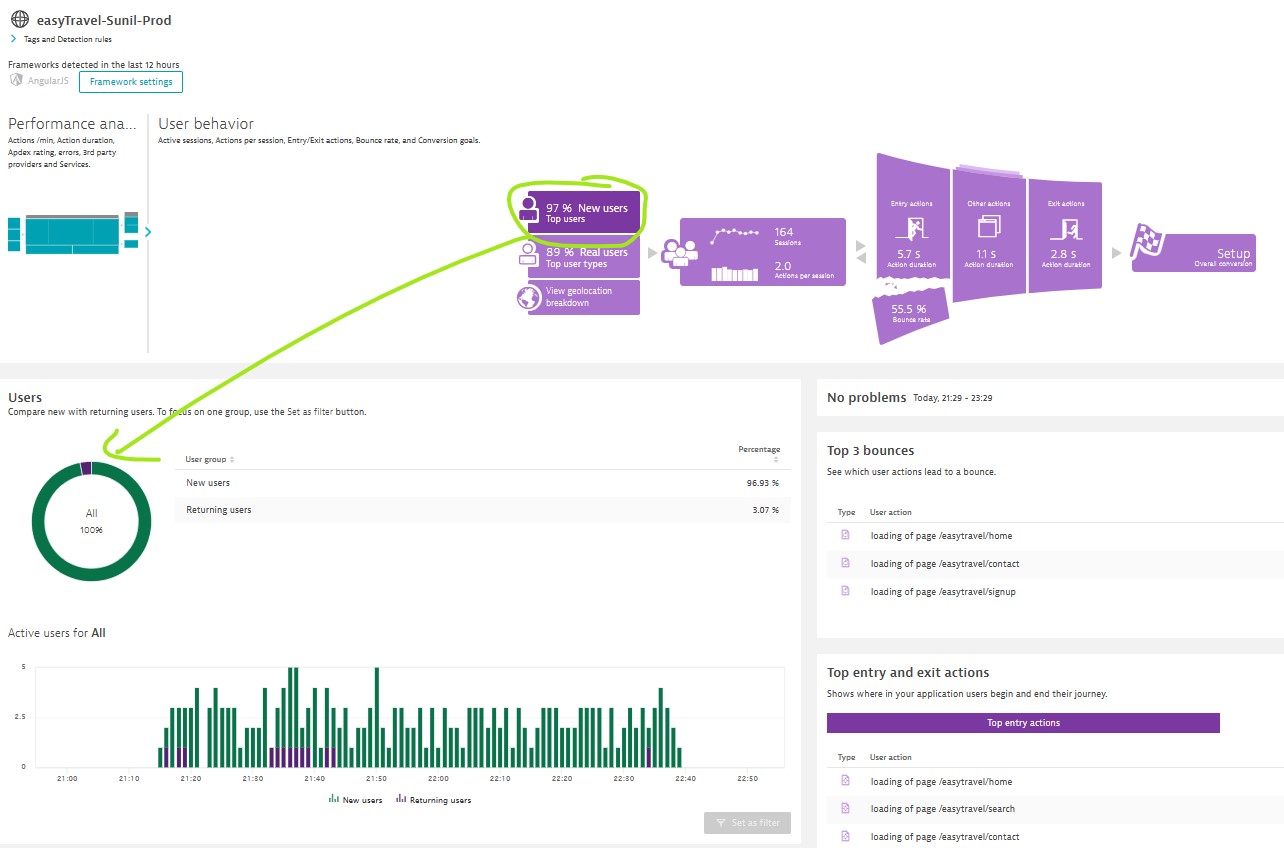
- Users: Dynatrace list user type whether the user is new or return user. Returning users are determined by a cookie valid for 2 years. Cookie settings can be interfering with data privacy settings.
If no return users are shown, something could be interfering with cookies, such as data privacy settings.
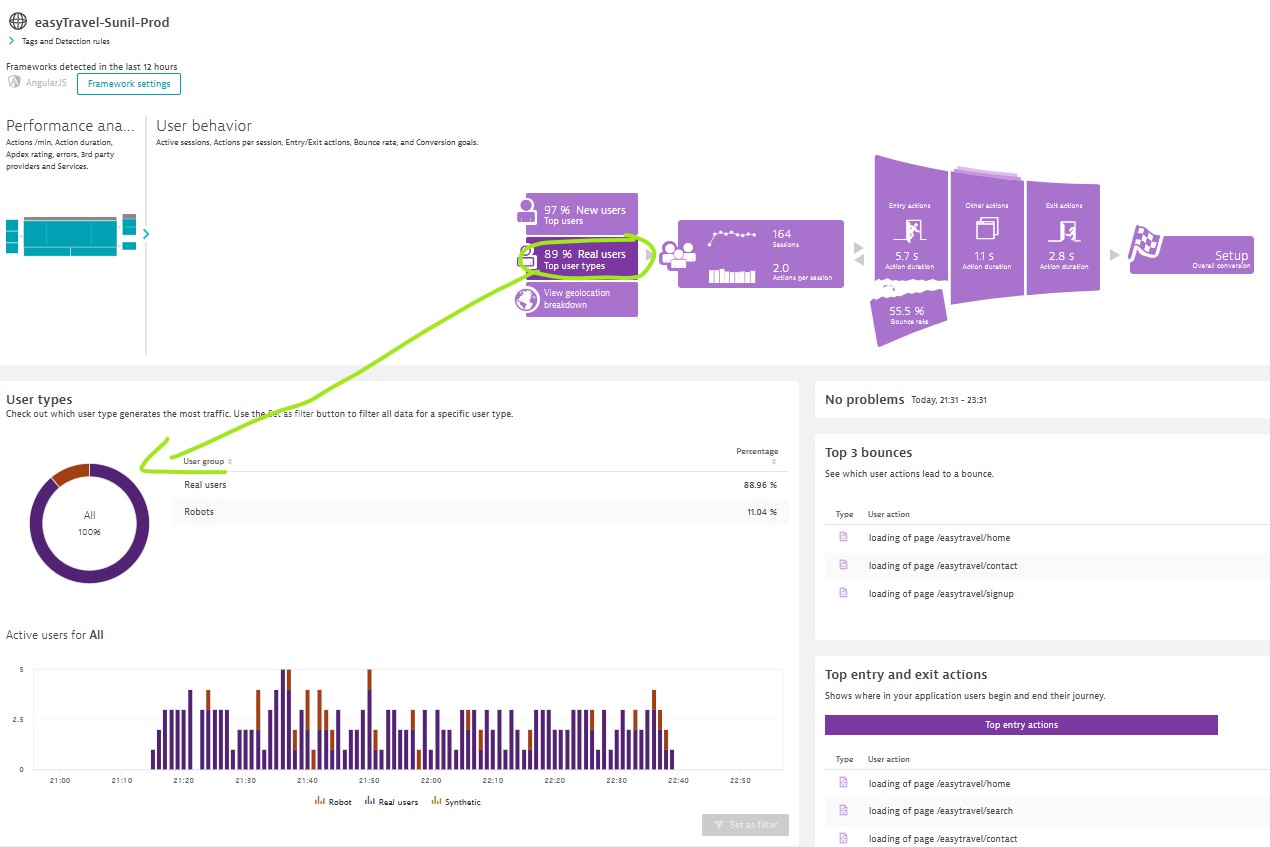
-
User type: List no of real users or robots.
-
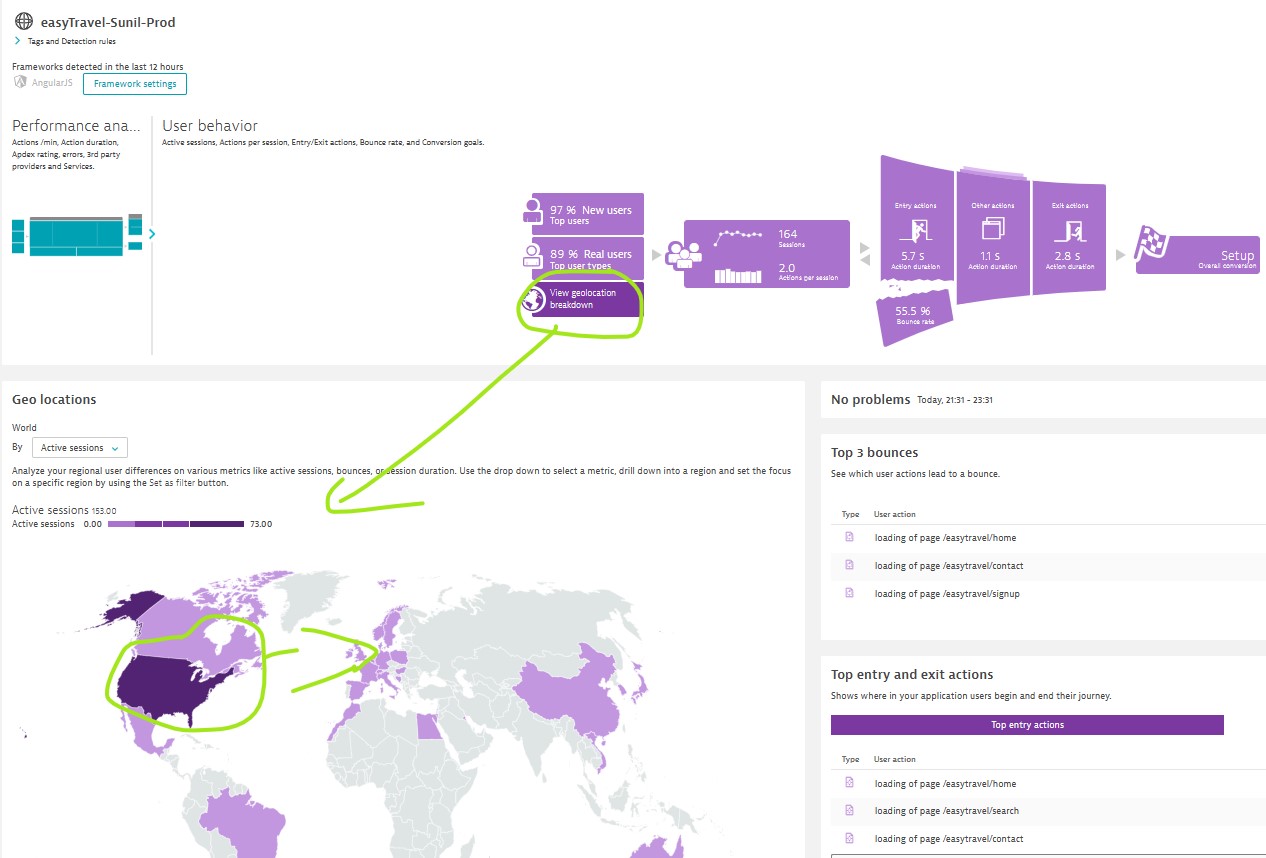
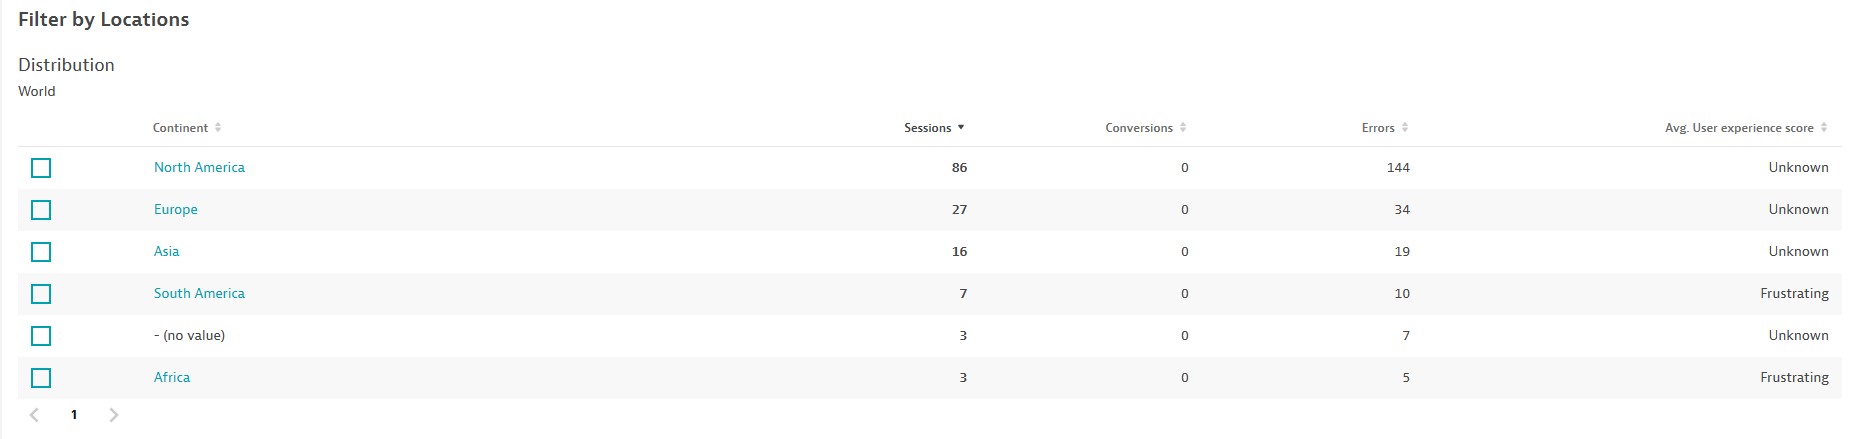
Geolocation breakdown: Analyze your regional user differences on various metrics like active sessions, bounces, or session duration. Drill down into a region and set the focus on a specific region.
-
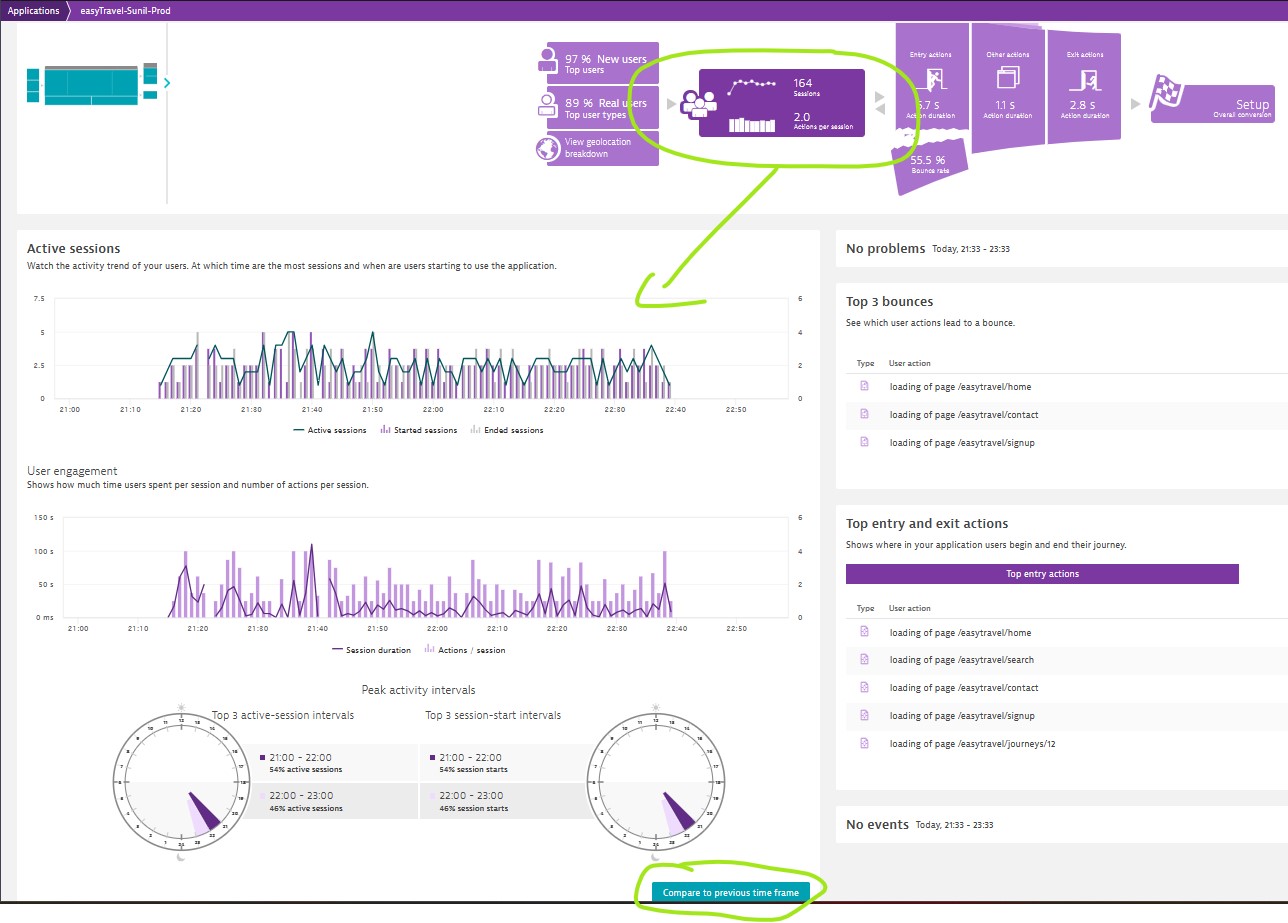
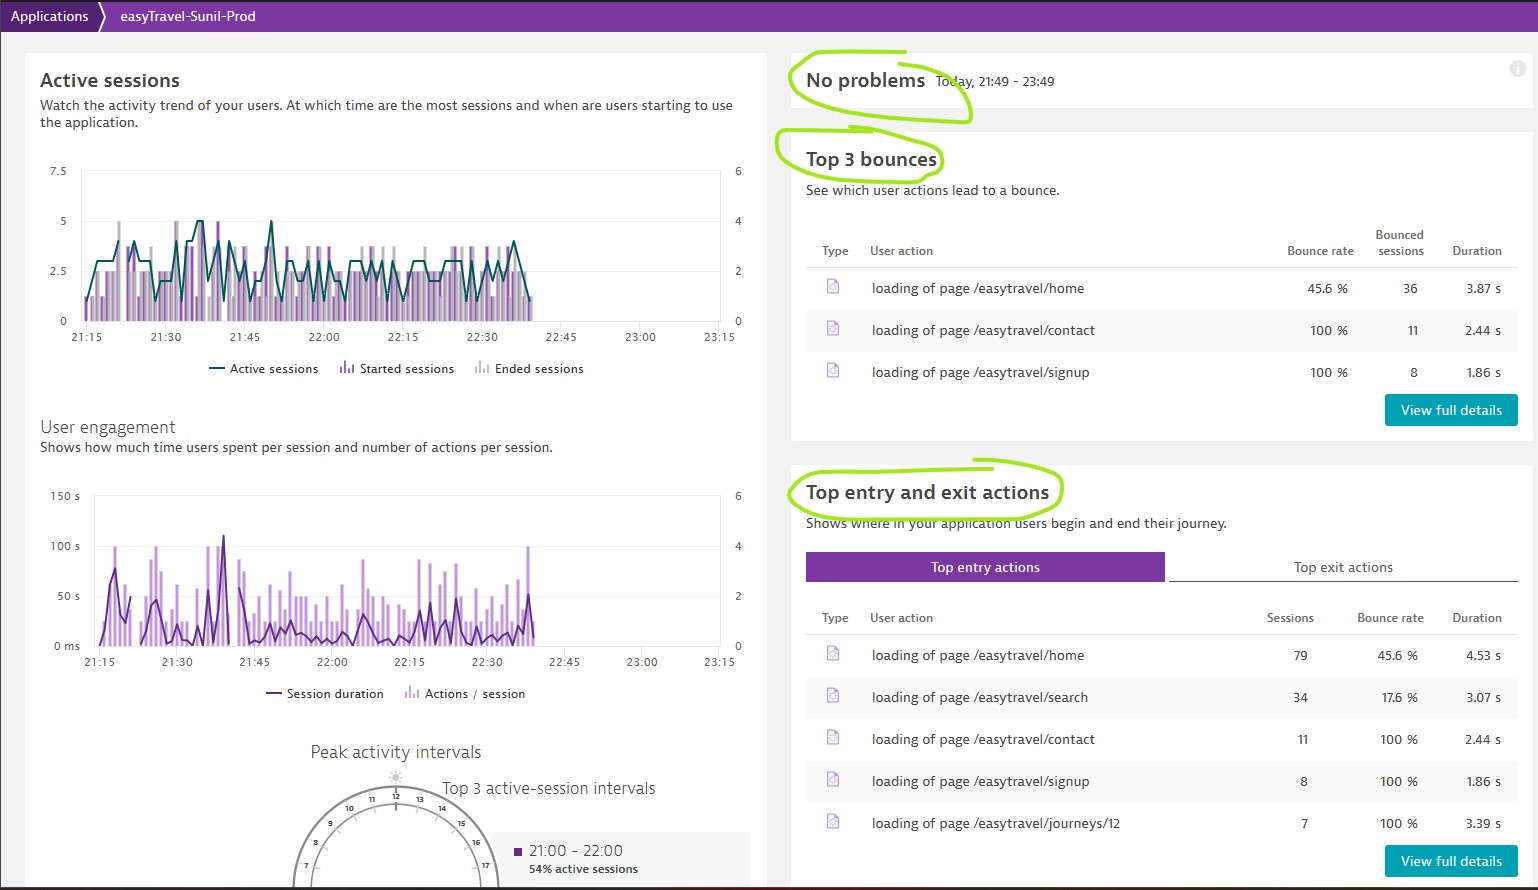
Active sessions & User engagement : At which time are the most sessions and when are users starting to use the application User engagement, Shows how much time users spent per session and number of actions per session. Compare the duration of entry actions and their Apdex rating in diverse timeframes in order to notice discrepancies of your entry pages in the course of time.
-
Entry actions’ duration: Watch the trend of the first page load or XHR action of a session as these are often the landing pages of your application. The duration of your entry actions tells you about their quality.
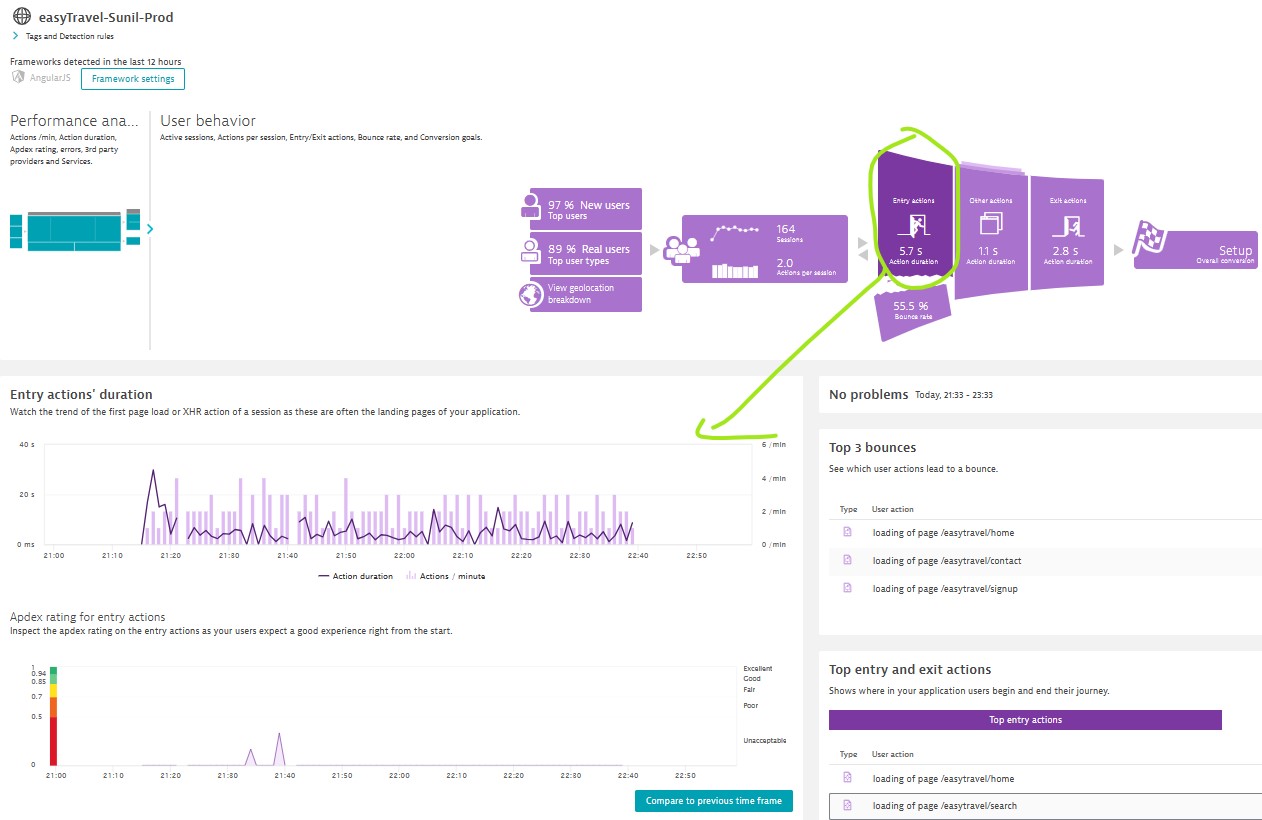
A negative customer experience can lead to a higher bounce rate. Thats why it is important to watch the action duration and Apdex trends of the entry actions.
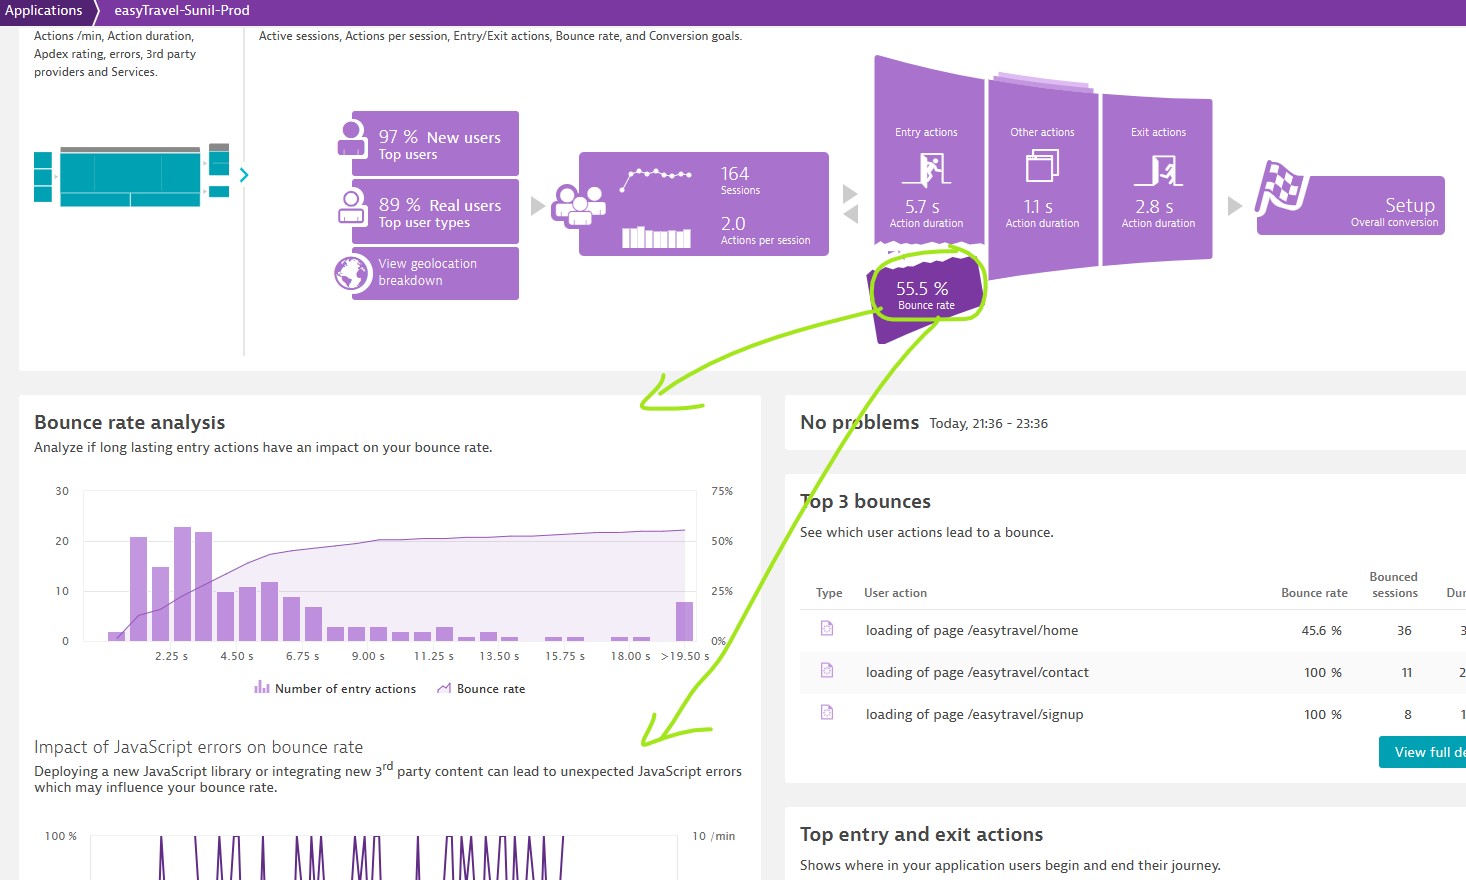
Bounce rate analysis tells you when users leave your site or if higher numbers of JavaScript errors correlate with higher bounce rates.
-
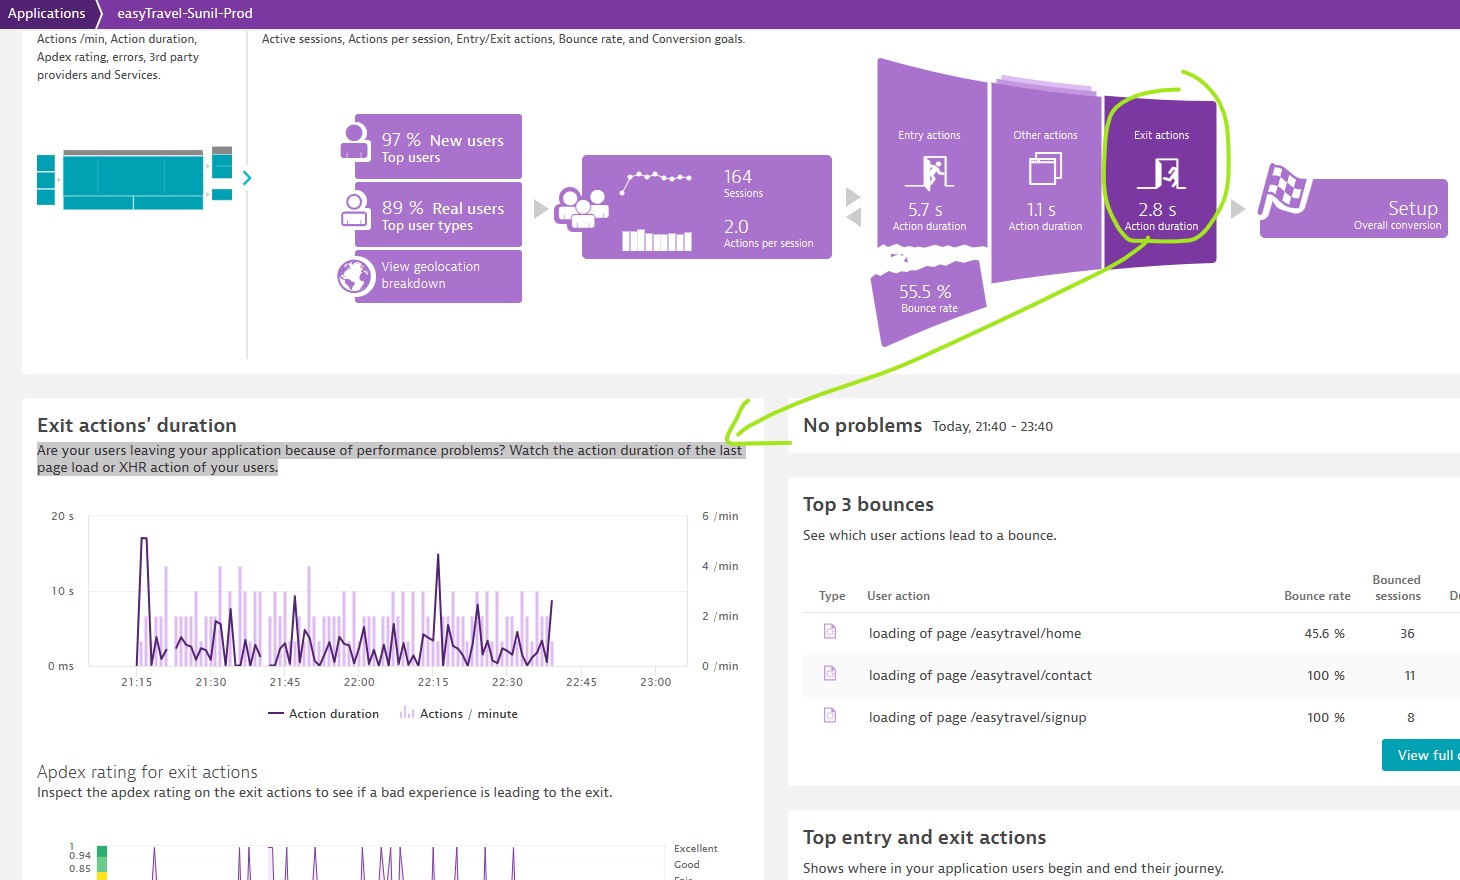
Other actions: check duration of actions occuring between entry and exit actions.
-
Exit actions: If users exiting application at places you did not intend, this exit data might reveal that those pages are lacking in engagement and need to be improved.
-
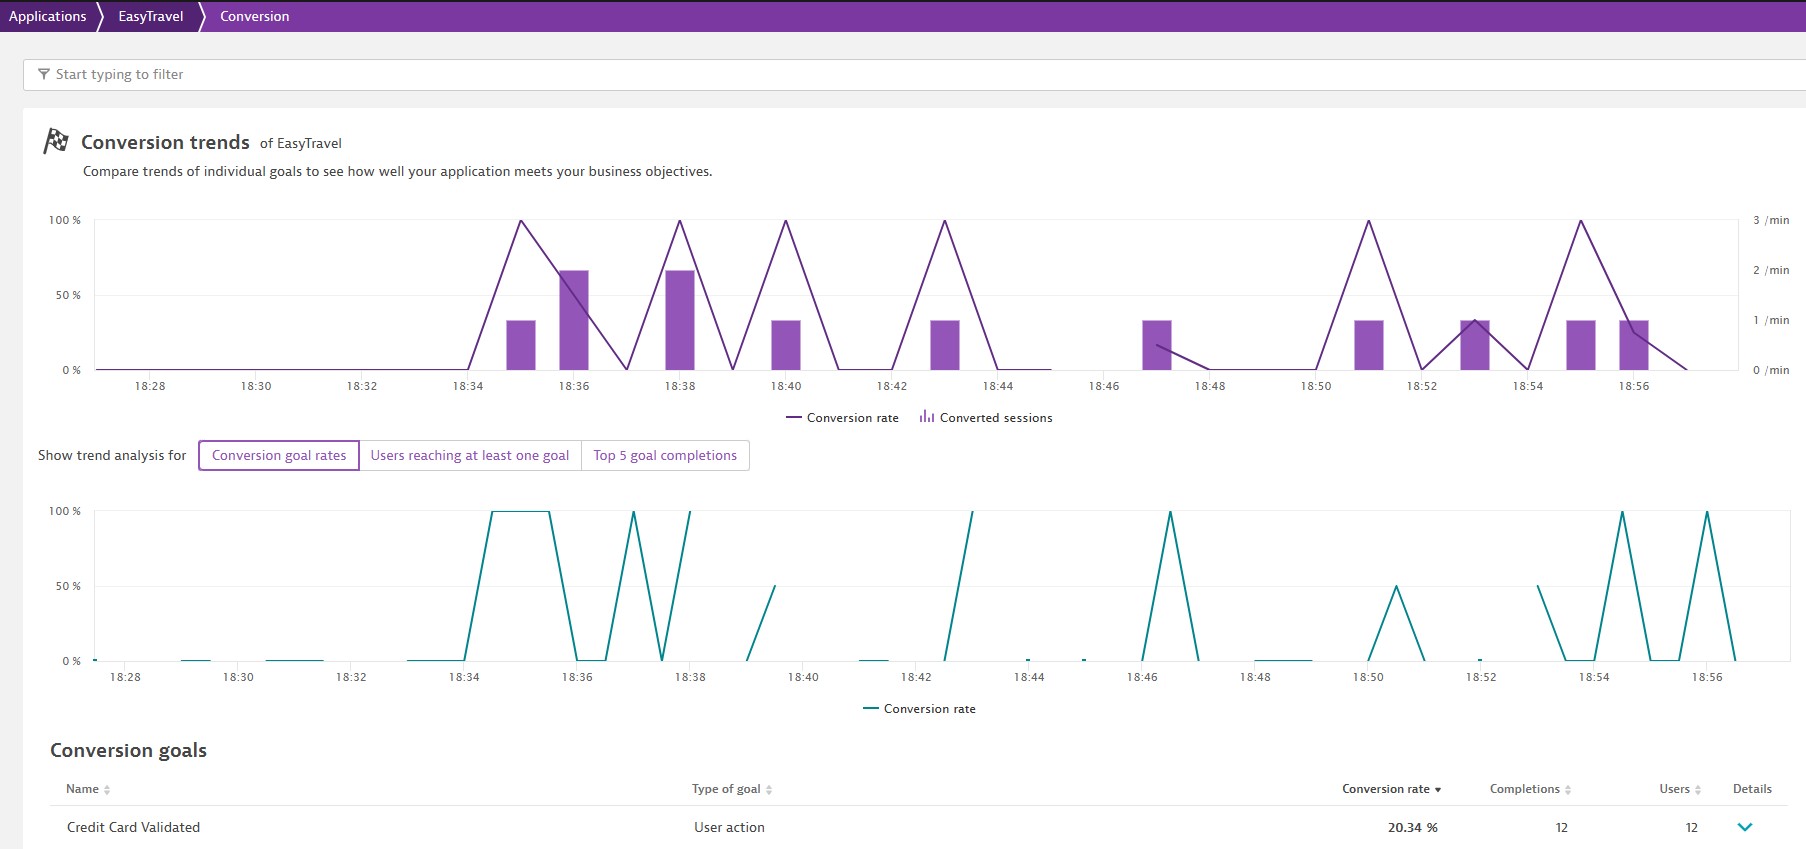
conversion goals: you can define most important actions within your application to monitor carefully.
-
Problems, Top 3 bounces & Top entry and exit actions
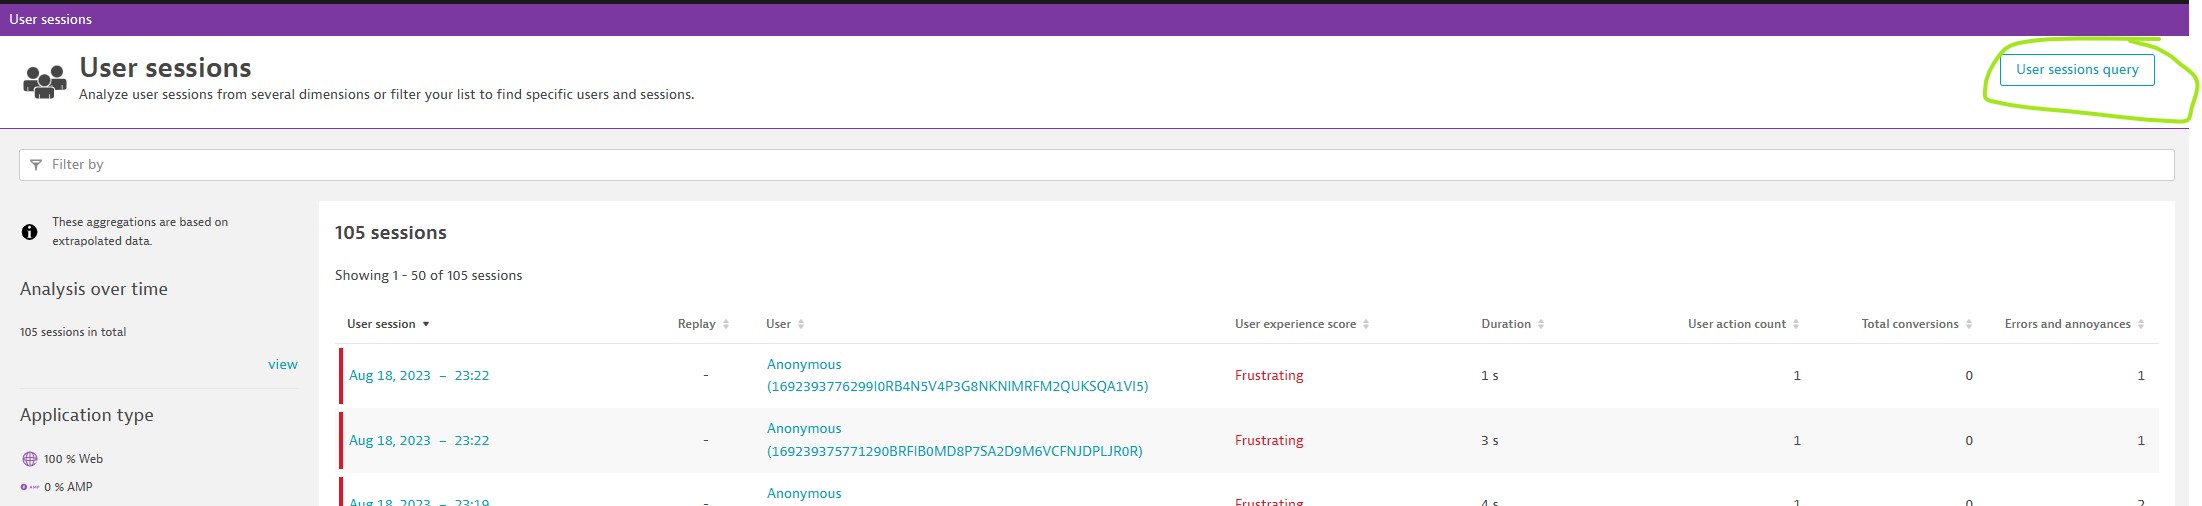
User Session Segmentation
Dynatrace shows detailed infographics that show both Real & Synthetic user transactions
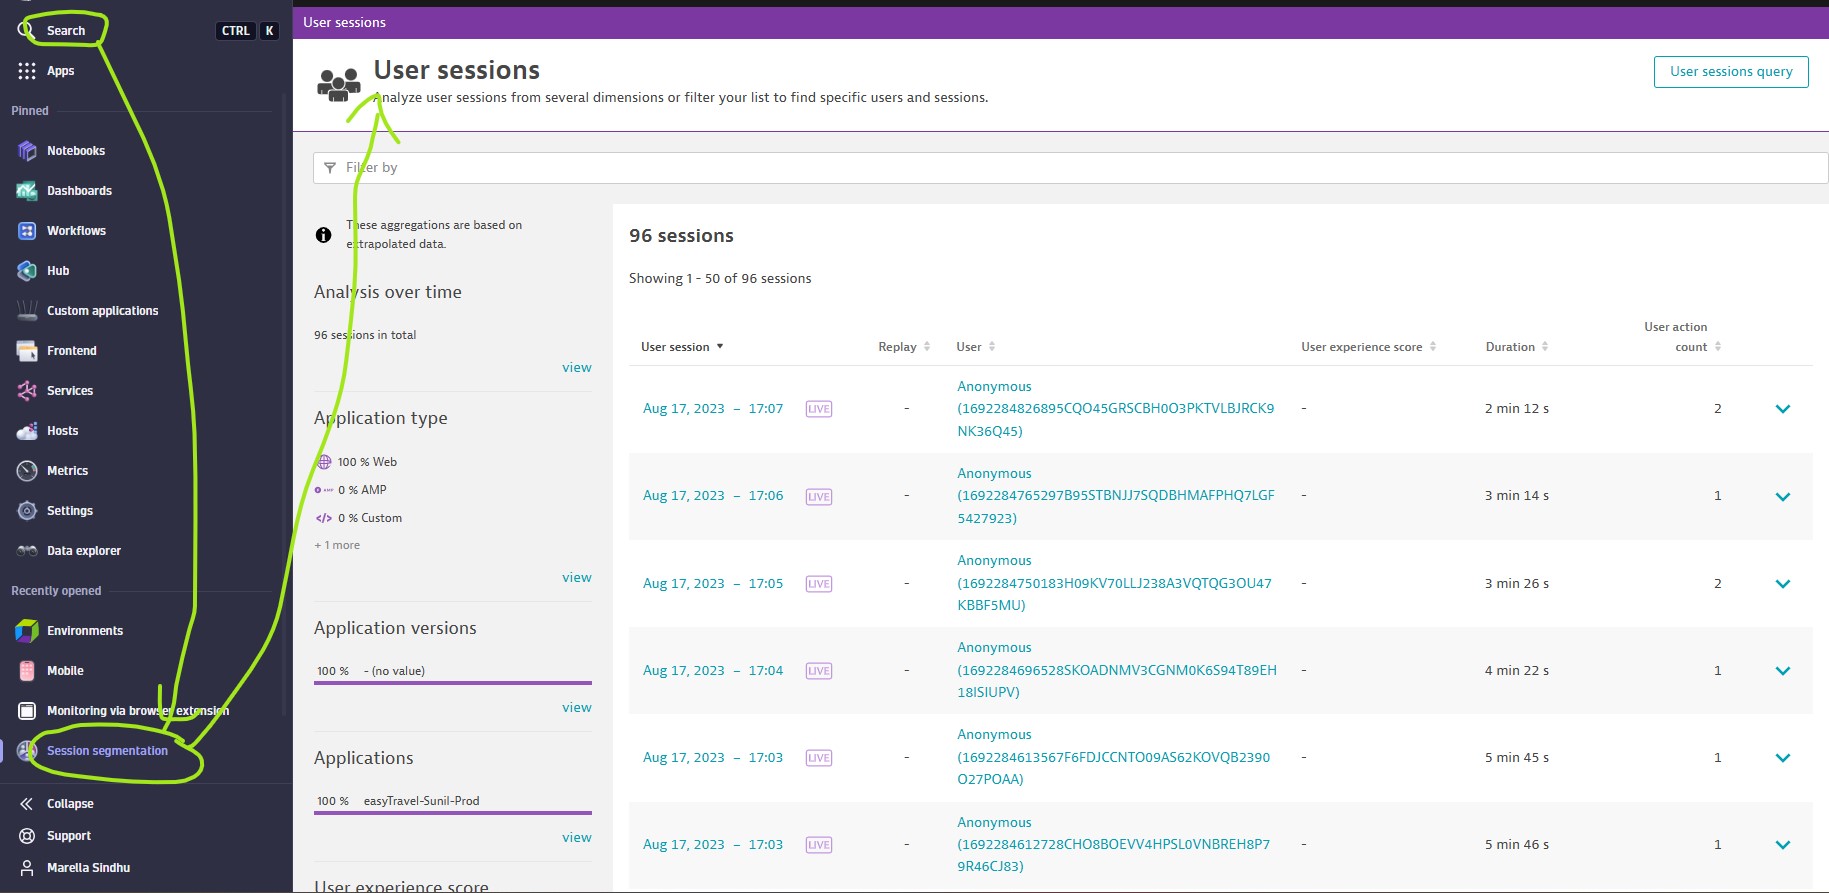
- Analysis over time - How many users over the selected time
- Application type - Web/mobile/custom sessions
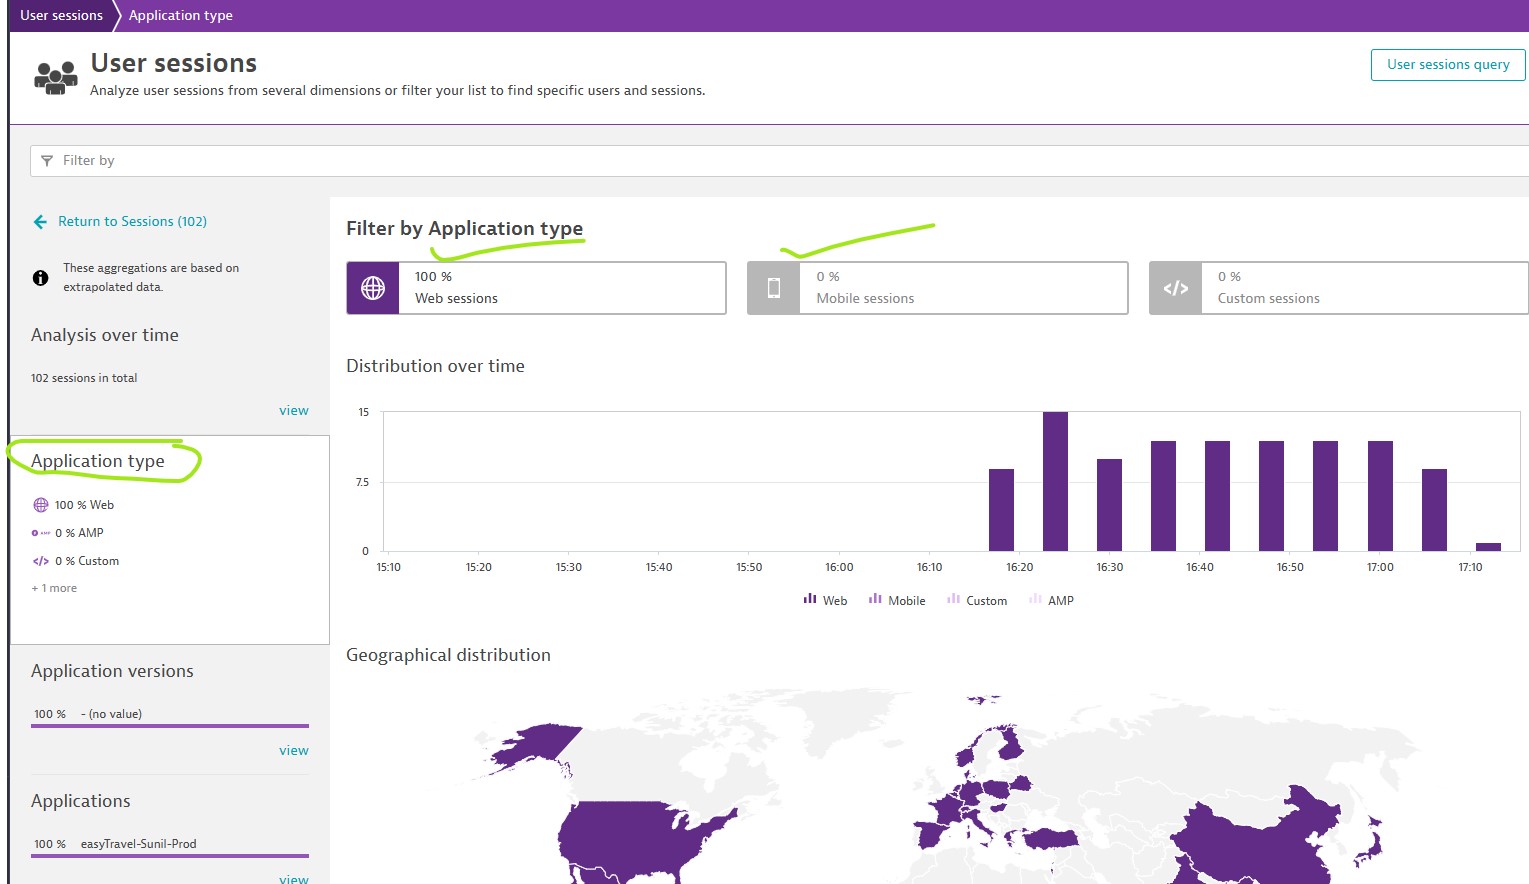
- Application version - Live & completed sessions
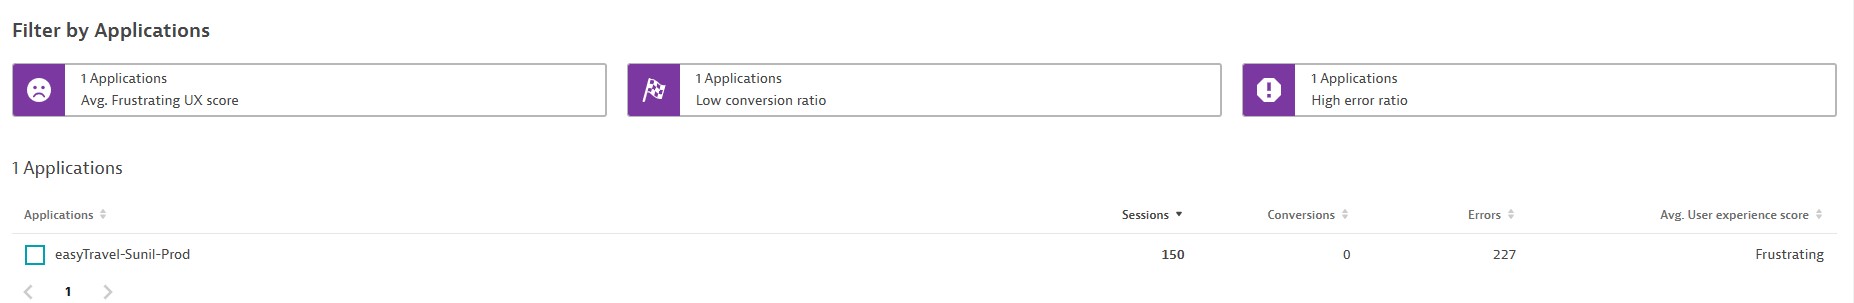
- Applications
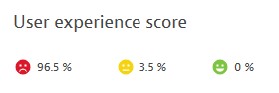
- User experience score
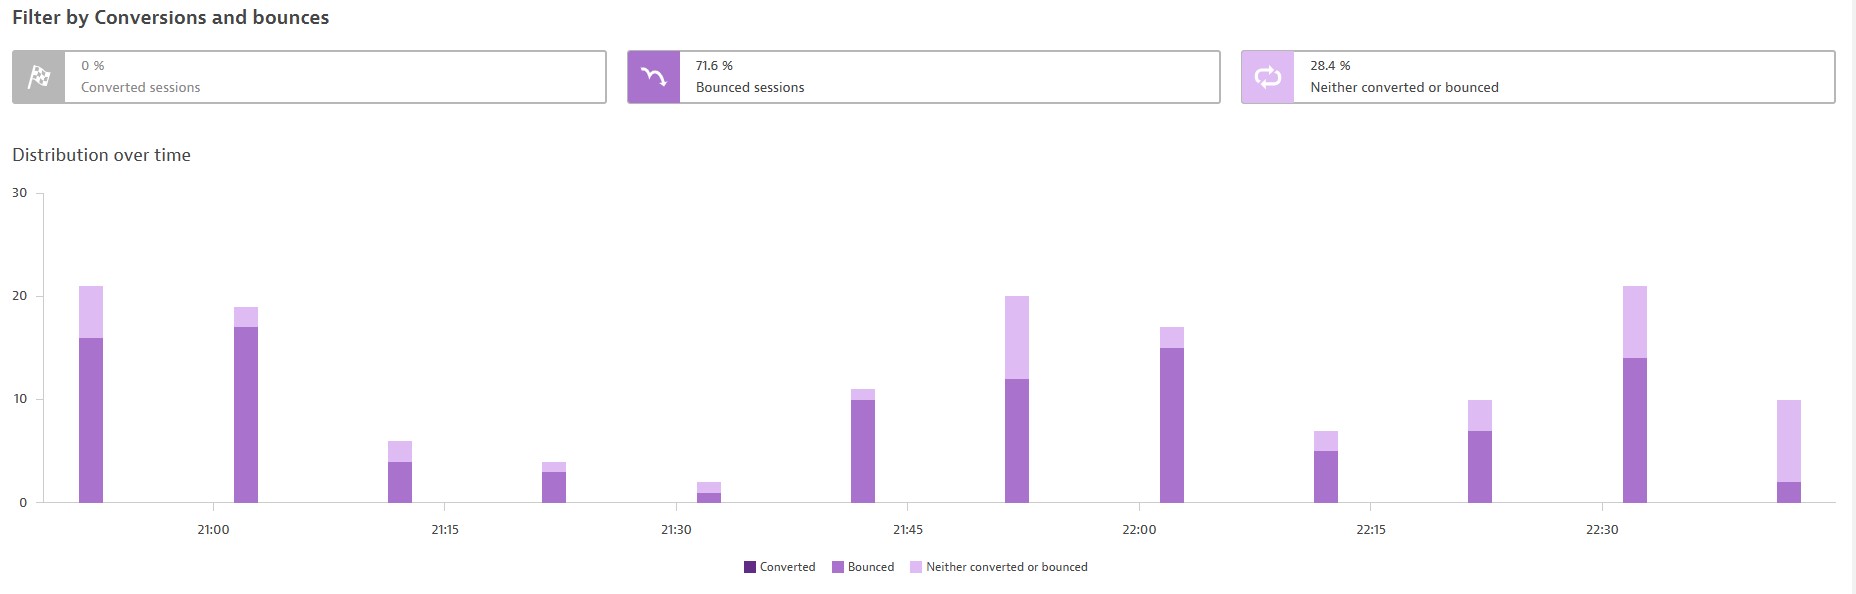
- Conversions and bounces
- Users: % of New / Returning users
- Browsers: Browser details
- Internet service provider
- Operating systems
- Locations
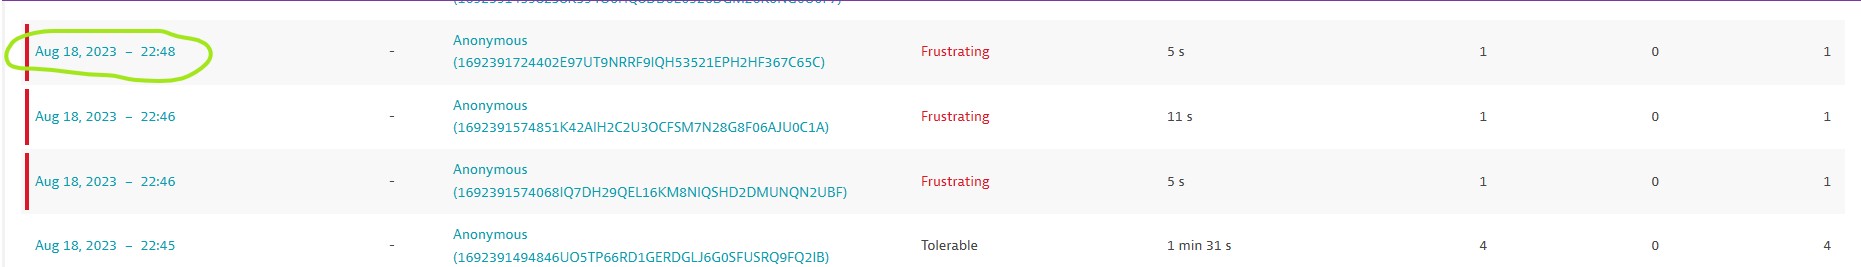
Session Details:
Select User session to see session details.
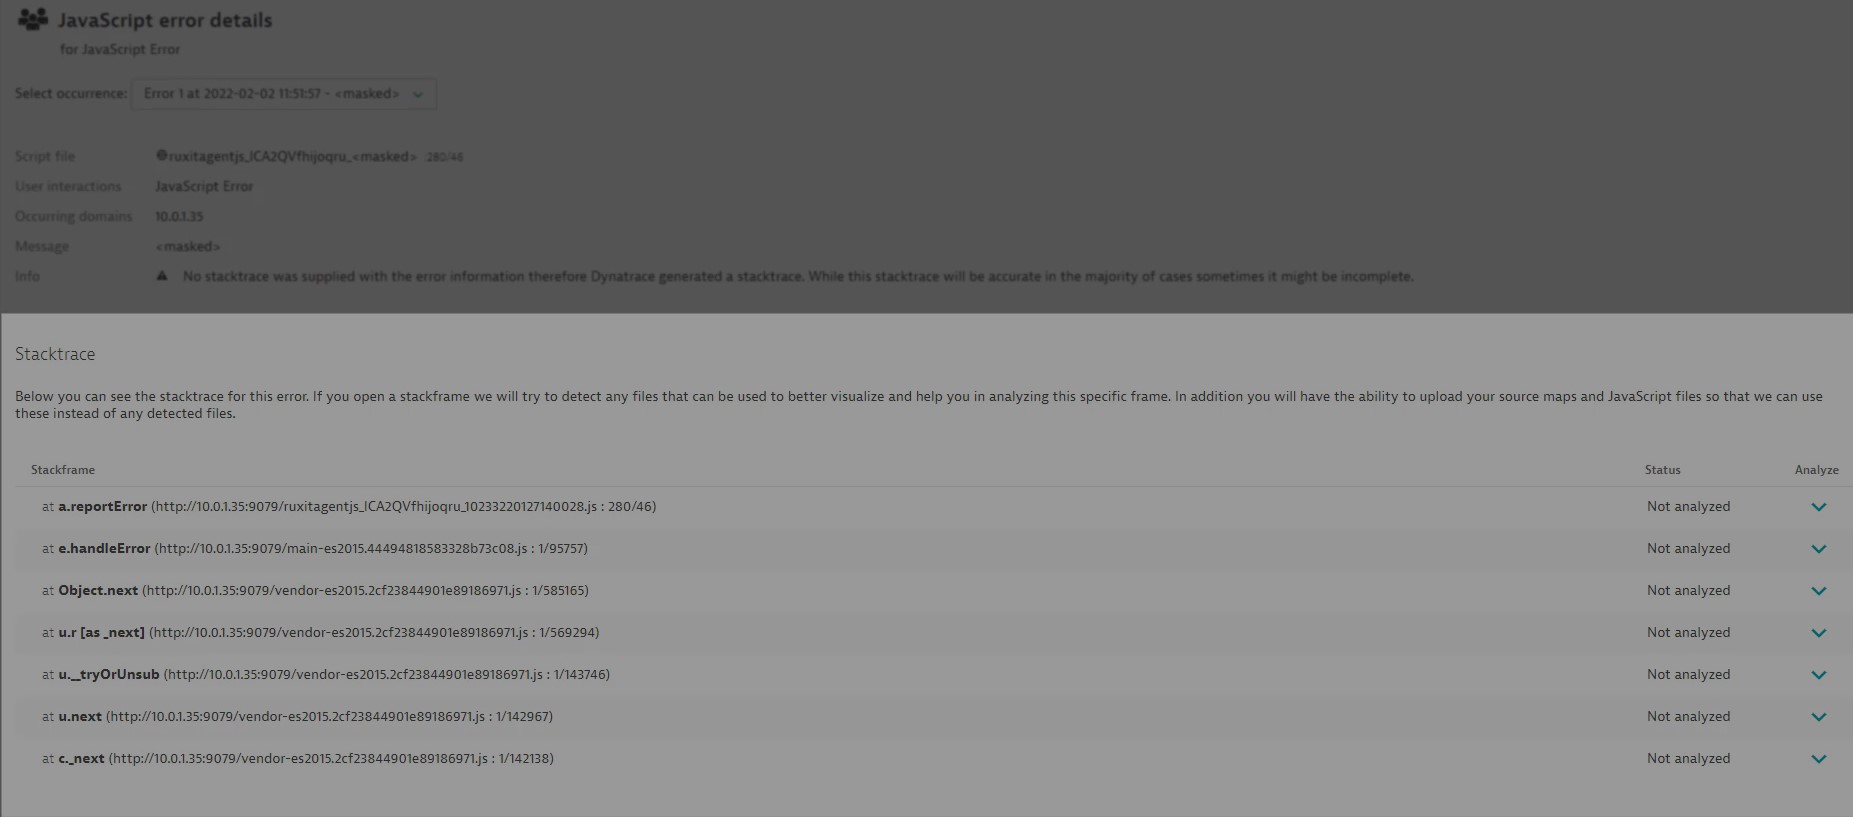
 You can see error details if any
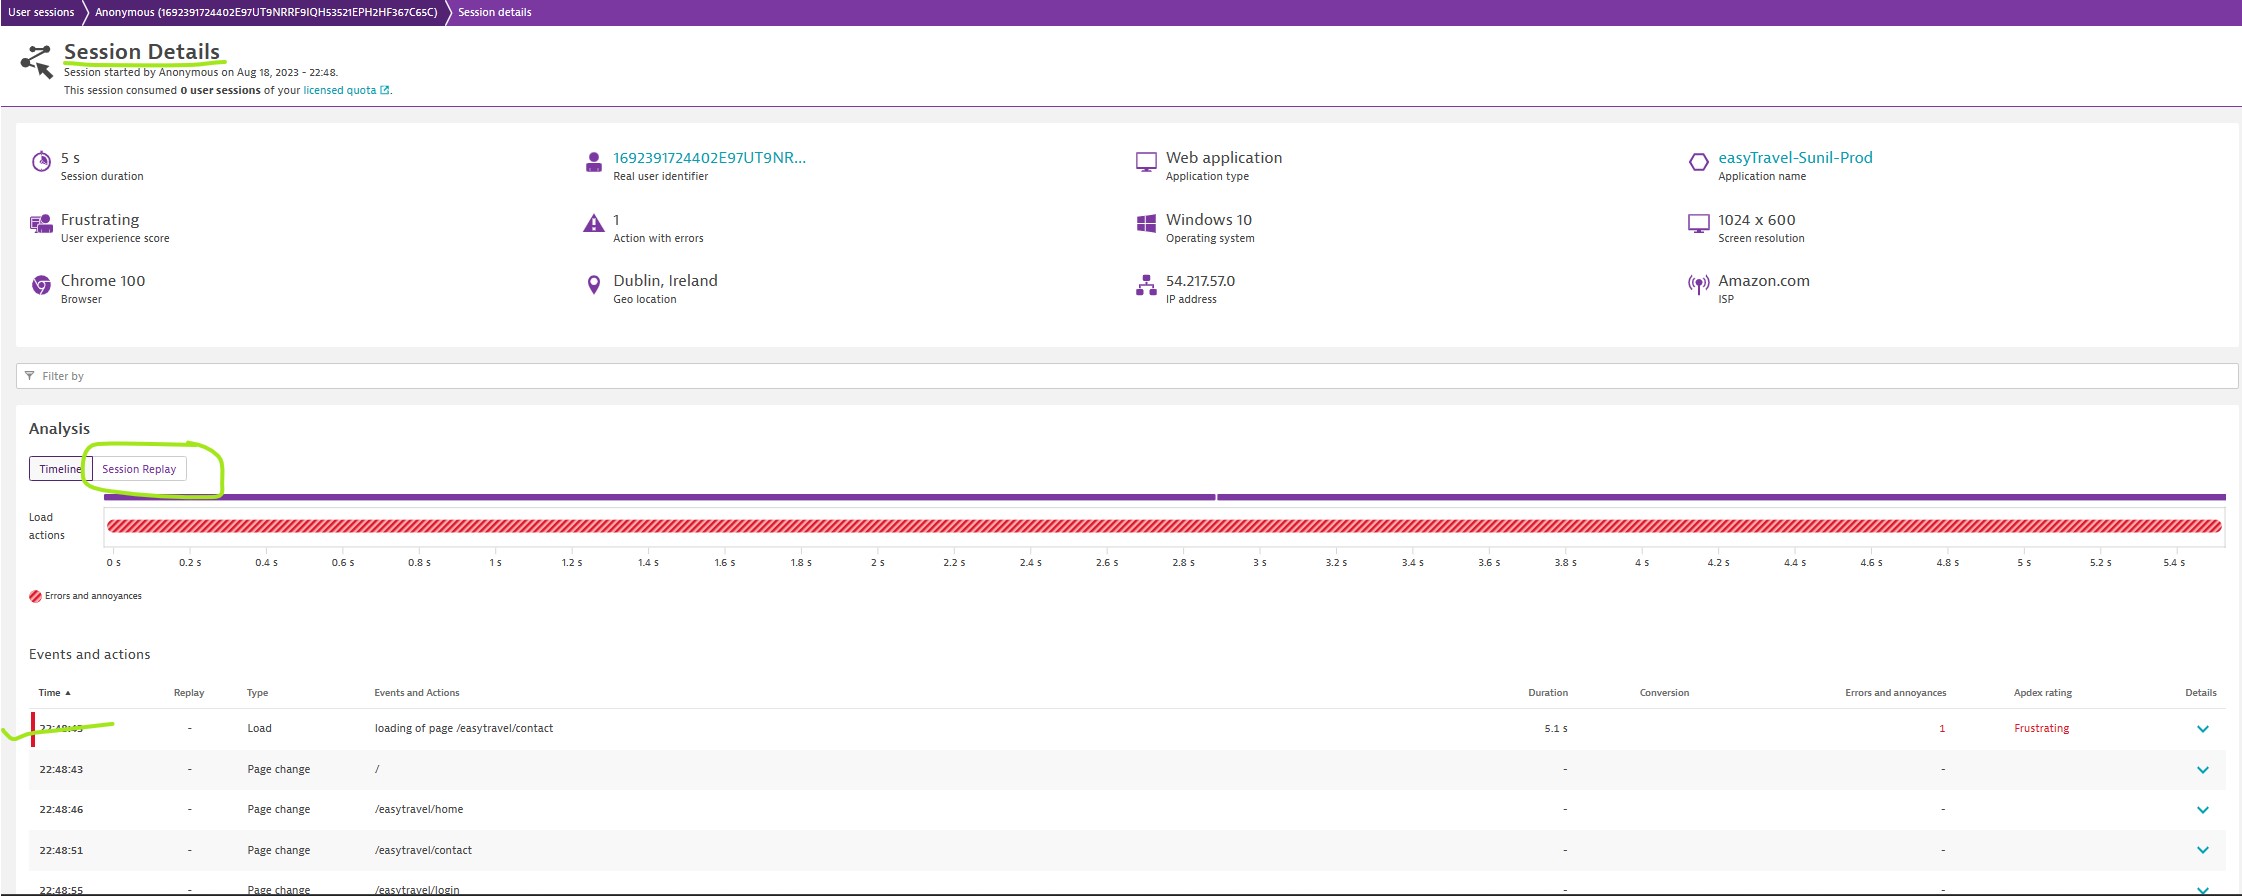
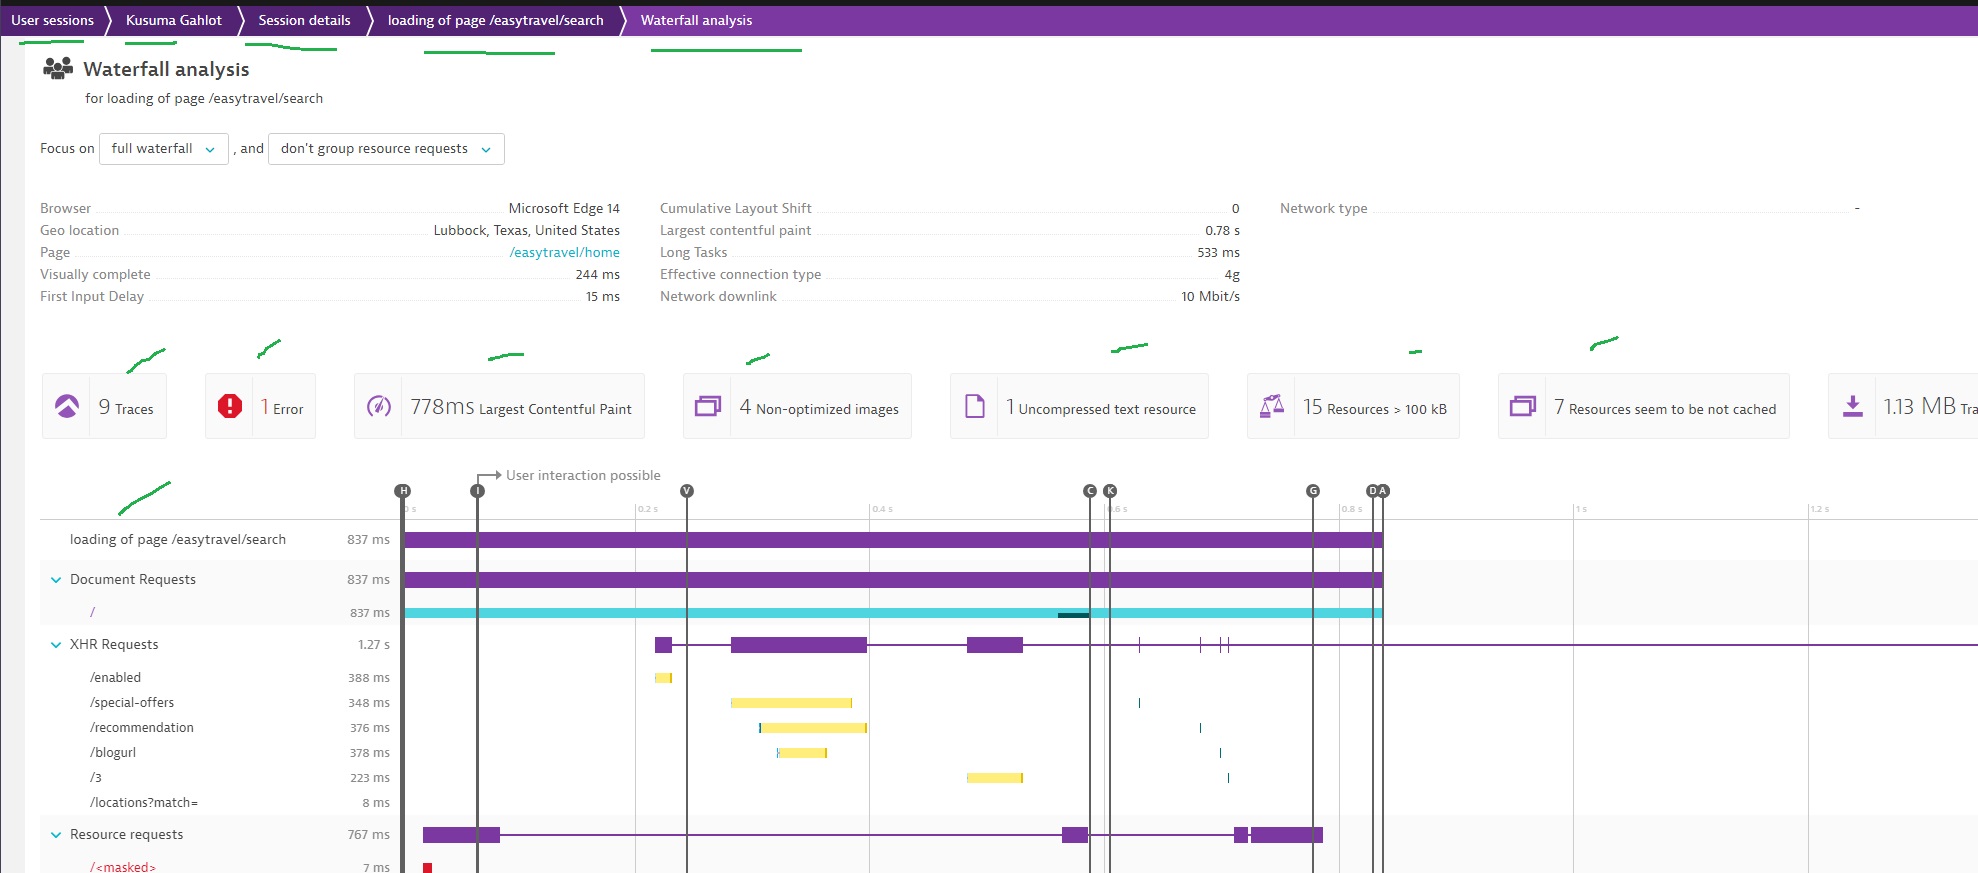
Waterfall Analysis
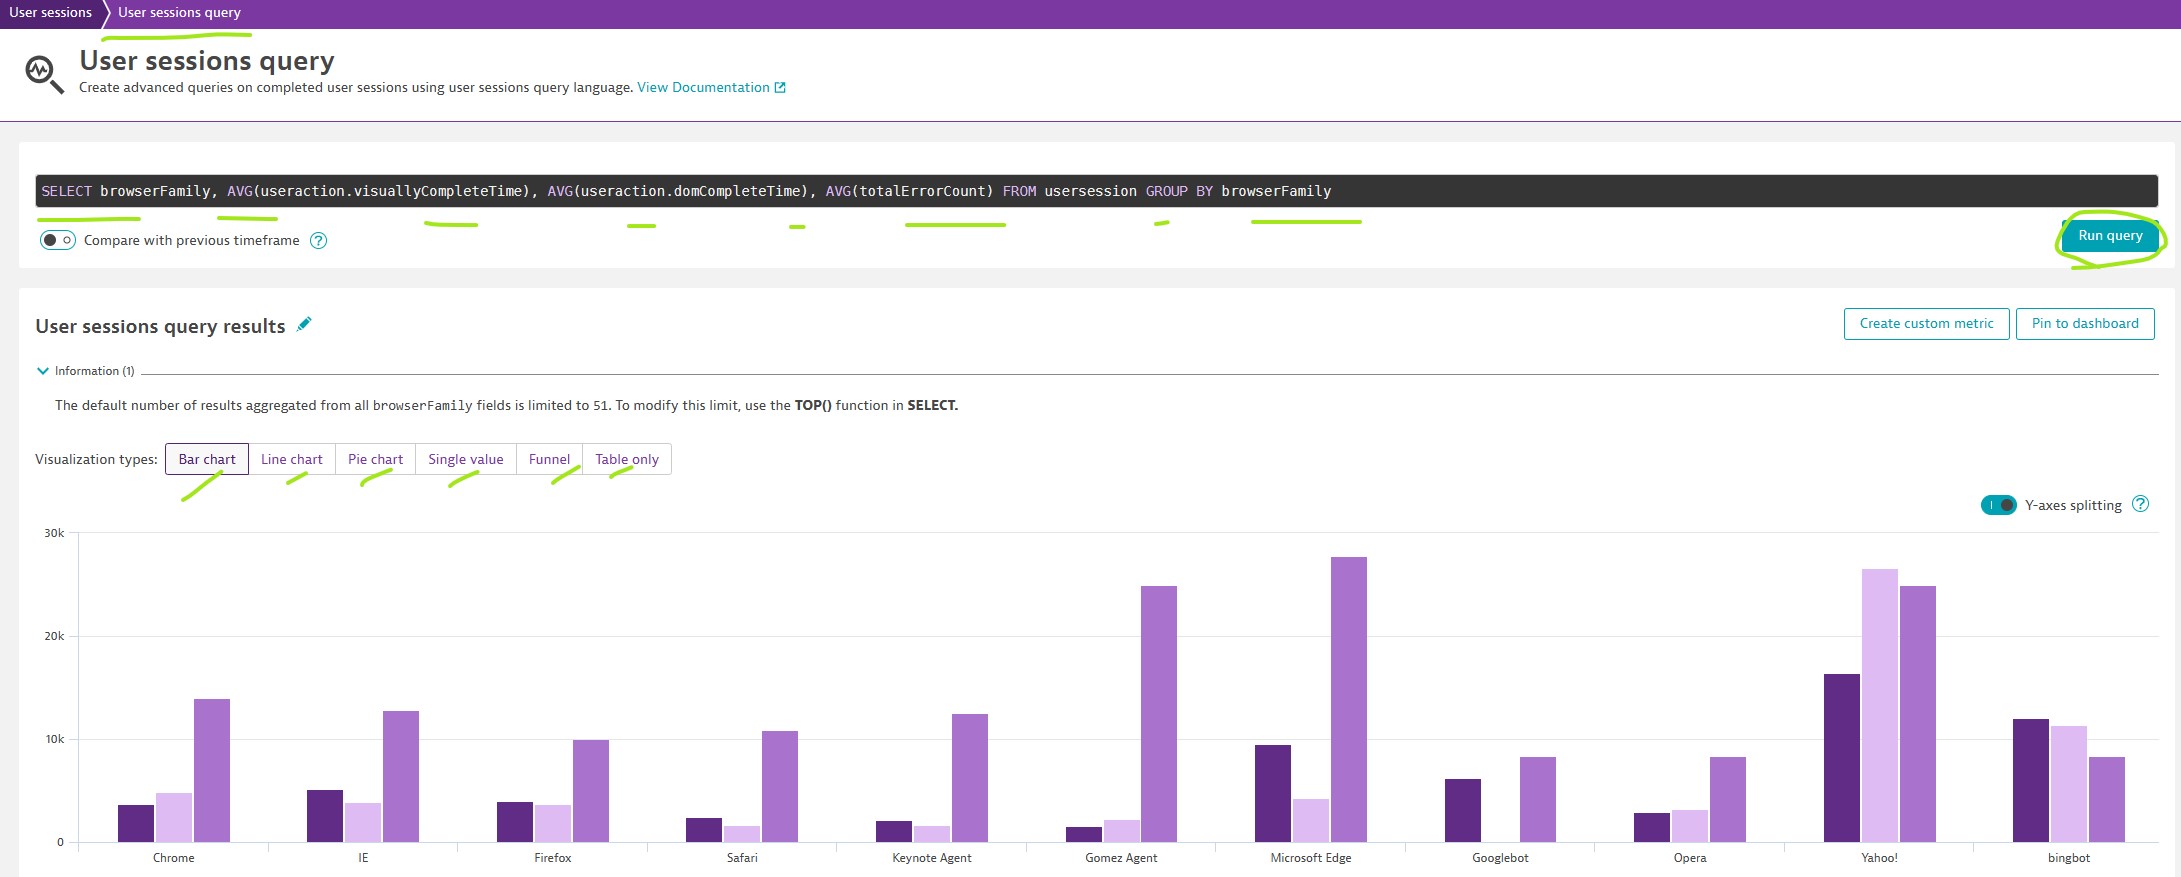
Analyzing User Sessions - Advanced USQL
Session Replay
Session Replay will playing the script back as it was recorded allows jumping to a particular spot, showing inactivity and speed up the function.
To enable Session Replay for web applications, From the application settings, select General settings > Enablement and cost control, Turn on Enable Session Replay and configure.
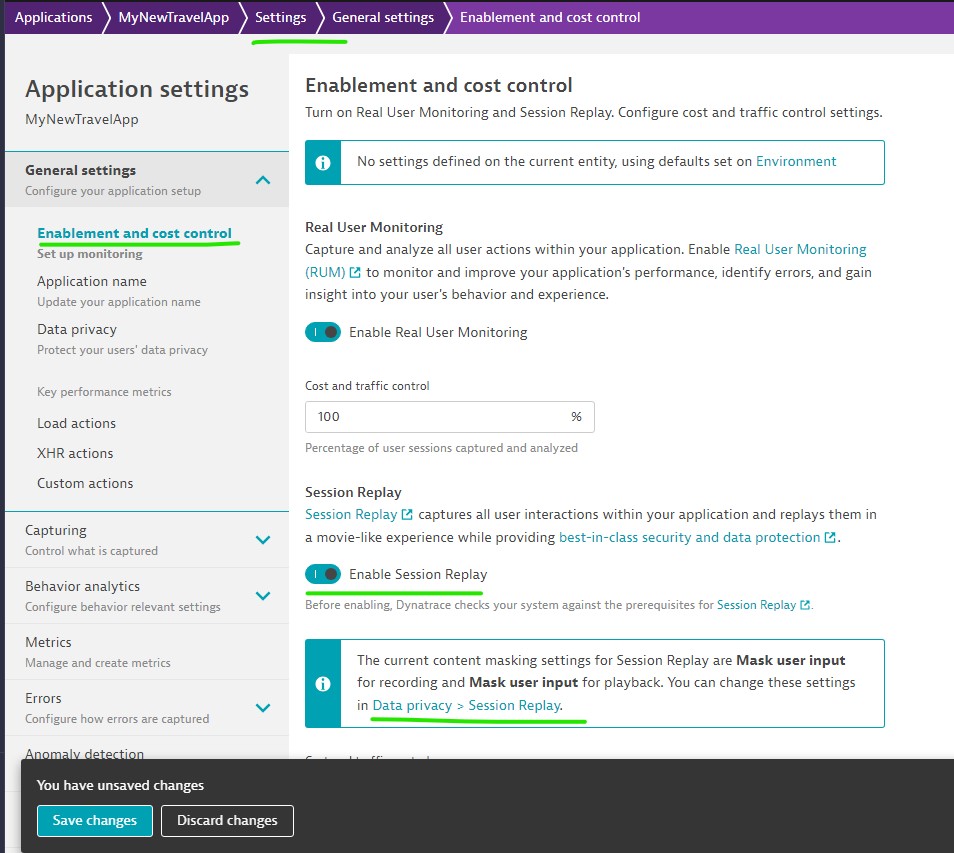
Use “Data Privacy -> Session Replay” for protecting sensitive data.
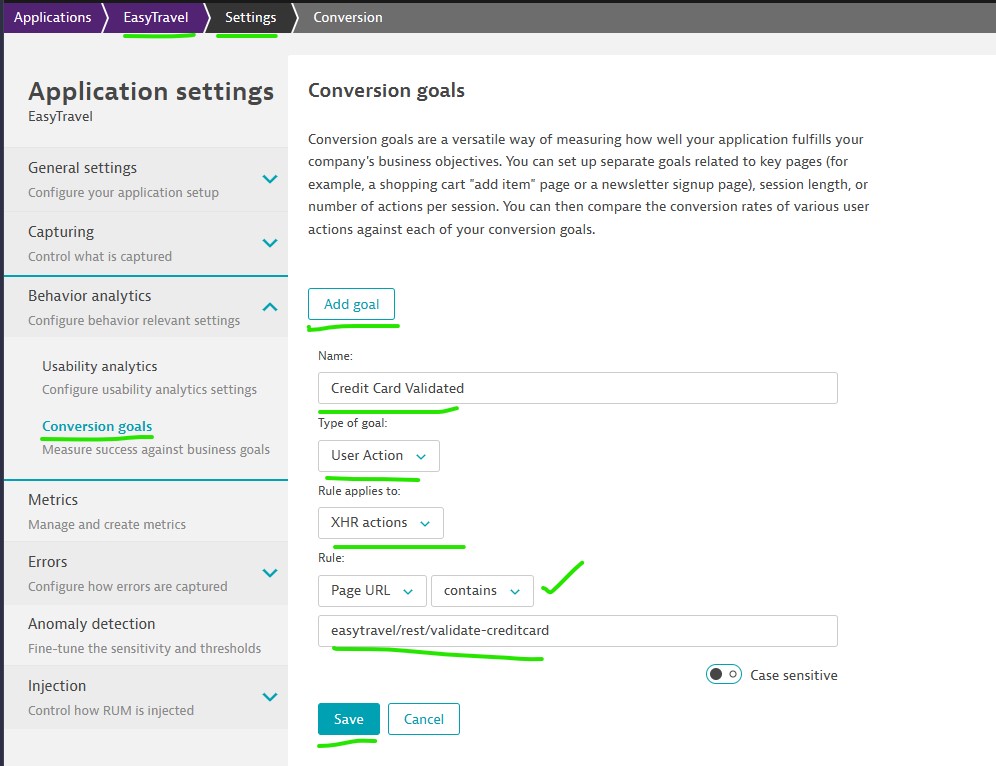
Conversion goals
Define conversion goals for specific user actions to understand how successfully you’re meeting your conversion milestones—for example, successful checkouts, newsletter signups, or demo signups.
You can add goals for reaching specific user actions or destination URLs and also for session information, for example, sessions with more than 10 user actions. For this example, a user would need to complete at least 10 user actions in a single session to reach this conversion goal.
Next Page: RUM Management
Main Page: Digital Experience Monitoring
Dynatrace : Main Page