MyObservability
Manual Instrumentation
To facilitate the instrumentation of applications even more, you can manually instrument your applications by coding against the OpenTelemetry APIs.
To apply a more granular configuration to the already existing agent you can use the opentelemetry-instrumentation-annotations library.
Also some language do not support auto instrumentation.
Steps:
- Import the OpenTelemetry API and SDK
- Configure the OpenTelemetry API
- Configure the OpenTelemetry SDK
- Create Telemetry Data
- Export Data
Manual Instrumentation - Tracing
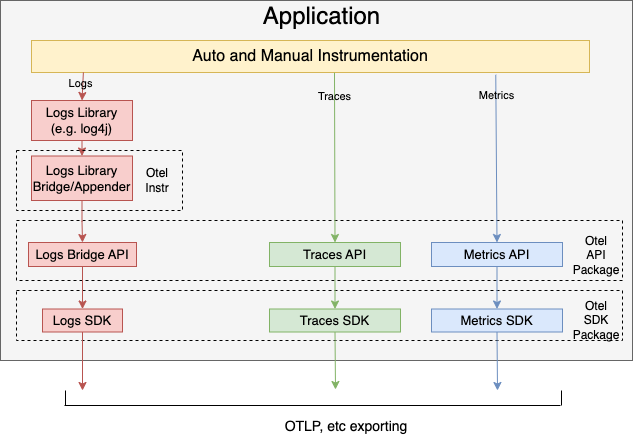
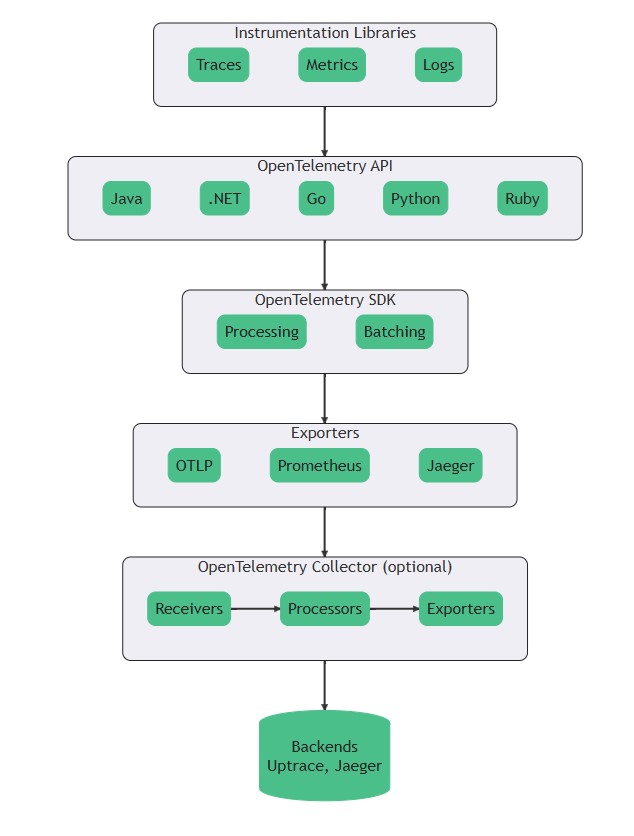
Big Picture: OpenTelemetry Tracing Pipeline
- OpenTelemetry Tracing API
- OpenTelemetry SDK
- Telemetry Generation
- TraceProvider
- Tracer
- Tracing Pipeline
- SpanProcessor
- SpanExporter
- Telemetry Generation
OpenTelemetry Tracing API
The API is what you use in your code to generate trace data. It’s just interfaces (no logic) that define how you:
- Create spans
- Set attributes
- Link spans
- Propagate context
Ex:
Tracer tracer = GlobalOpenTelemetry.getTracer("my-app");

Span span = tracer.spanBuilder("fetchData").startSpan();
try (Scope scope = span.makeCurrent()) {
    // business logic
    span.setAttribute("user.id", "123");
} finally {
    span.end();
}
OpenTelemetry SDK
The SDK is the actual implementation of the API. It provides the logic to:
- Record spans
- Process spans (e.g., sampling, filtering)
- Export them to telemetry backends
You typically bring in this SDK in your app as a dependency.
Ex:
<dependency>
  <groupId>io.opentelemetry</groupId>
  <artifactId>opentelemetry-sdk</artifactId>
  <version>1.34.1</version>
</dependency>
- TracerProvider (SDK): It’s the factory that gives you Tracer instances. You configure it to control the tracing pipeline.
- Tracer: The Tracer is the main object your app uses to create and manage spans. Each tracer, Starts spans, Links to parent spans, Lets you manage attributes and events
- SpanProcessor: A middleware between the creation of a span and its export. You can add multiple span processors
- SimpleSpanProcessor (exports immediately).
- BatchSpanProcessor (exports in batches — better for production)
- Custom processors (e.g., for filtering, metrics enrichment)
- SpanExporter: This is the final destination handler — it sends your span data to a backend like: OpenTelemetry Collector Or / And to Grafana Tempo, Splunk Or File or console.
Next Chapter: Sampling
Main Page: Click Here