MyObservability
🟦 Manual Instrumentation - Logs
In OpenTelemetry, every piece of data that is neither a part of a distributed trace nor a metric is considered a log. For example, events are just specialized log entries.
OpenTelemetry use existing logging functionality from programming languages or existing logging libraries to integrate into unlike API & SDK implemented for tracing & metrics.
- The logging solution should be configured to send log entries, also called LogRecord, into a LogRecordExporter.
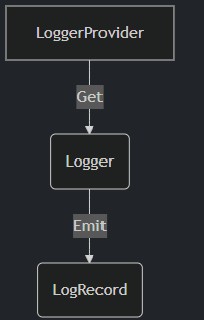
- The logging solution can use the LoggerProvider factory to create new Logger instances that are initialized once and match the application’s lifecycle.
- The created logger is responsible for creating log entries.
- When logs are created, LogRecordExporters is responsible for sending the log entries to a collector like the OpenTelemetry Collector. - The log entry, which is of type LogRecord, consists of multiple fields like timestamp, traceId, spanId, severityText, body, and others that will be discussed in the exercise for this chapter.
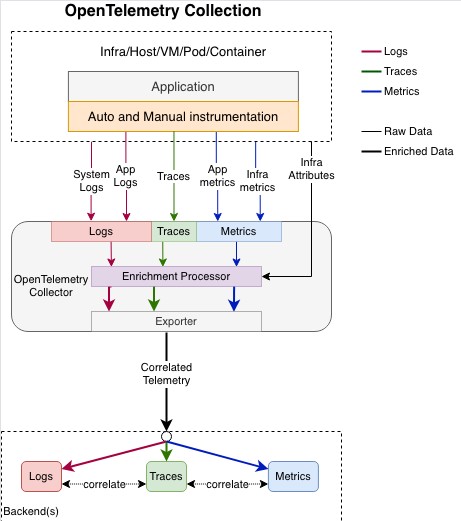
🟩 OpenTelemetry Solution for Logging
Emited logs, traces and metrics in a way that is compliant with OpenTelemetry data models, send the data through OpenTelemetry Collector, where it can be enriched and processed in a uniform manner.
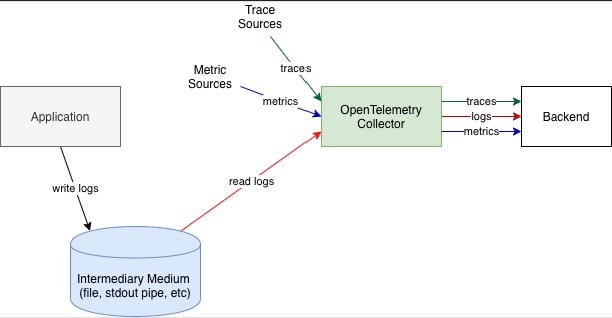
🟥 File or Stdout Logs
logs are written to files or to standard output, requires ability to read file logs, tail them, work correctly when log rotation is used. common formats that parsers need to support are: CSV, Common Log Format, Labeled Tab-separated Values (LTSV), Key/Value Pair format, JSON, etc. To support this approach OpenTelemetry recommends to collect logs using OpenTelemetry Collector
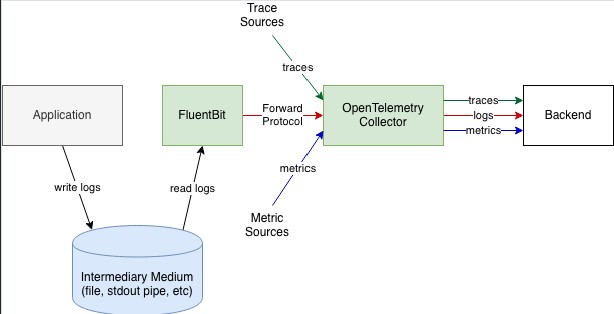
Alternatively, if the Collector does not have the necessary file reading and parsing capabilities, another log collection agent, such as FluentBit can collect the logs, then send the logs to OpenTelemetry Collector.
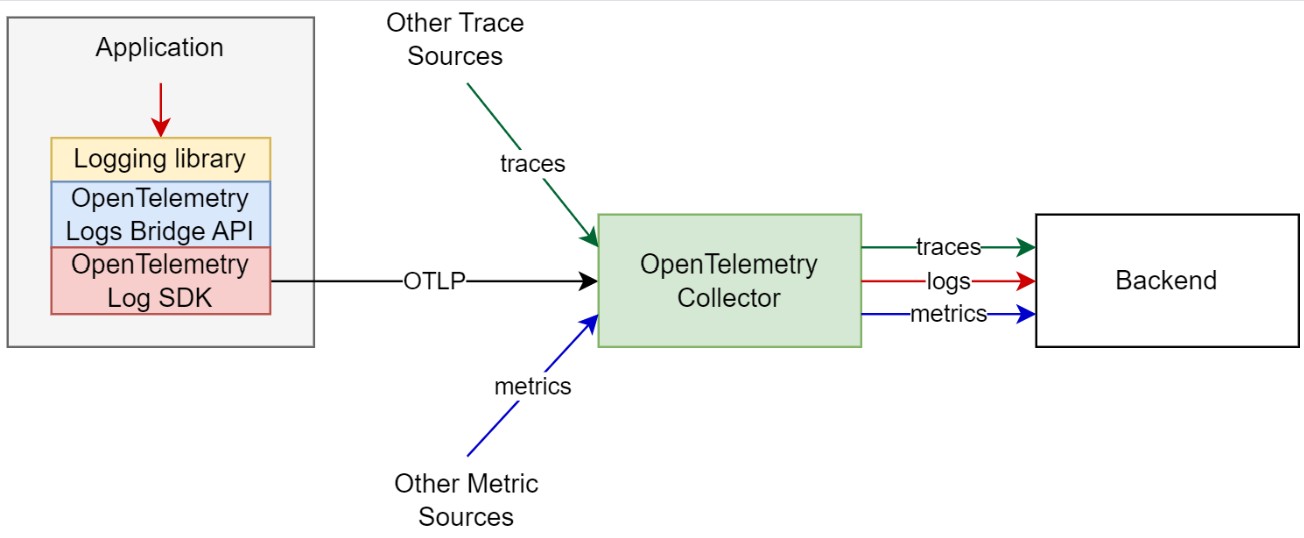
🟥 Direct to Collector
The second approach is to modify the application so that the logs are output via a network protocol, e.g. via OTLP
To facilitate both approaches described above OpenTelemetry provides a API and SDK, which can be used together with existing logging libraries to automatically inject the trace context in the emitted logs, and provide an easy way to send the logs via OTLP.
🟩 Logs API
- LoggerProvider is the entry point of the API. It provides access to Loggers.
- Logger is responsible for emitting logs as LogRecords.
Logging Manually
Step 1: Import required libraries
- LoggerProvider: creates and manages loggers. Associates logs with resources (e.g., service name). Registers one or more LogRecordProcessors to handle logs. Central place to route all log events from your app
- LoggingHandler: captures logs from Python’s logging module and routes them into OpenTelemetry
- Exporter: Takes processed logs and exports them somewhere — e.g.:
- ConsoleLogExporter: prints to the console.
- OTLPLogExporter: sends to OTLP-compatible backend (e.g., Grafana, Splunk, etc.).
- FileLogExporter: custom, for writing to file.
- LogRecordProcessor: Processes log records before exporting
- SimpleLogRecordProcessor: Processes immediately, one log at a time (good for dev).
- BatchLogRecordProcessor: Collects and processes logs in batches (better for production).
- Logs Bridge API integrate existing logging solutions with OpenTelemetry’s tracing and metric collections.
✅ Next Chapter: Sampling
✅ Main Page: Click Here