MyObservability
🟦 Manual Instrumentation
To facilitate the instrumentation of applications even more, you can manually instrument your applications by coding against the OpenTelemetry APIs.
For ex: To apply a more granular configuration to the already existing agent you can use the opentelemetry-instrumentation-annotations library for Java annotation based instrumentation helper which allows to add OpenTelemetry Spans to methods by simply annotating them. This opentelemetry-instrumentation-annotations needs to be added to the build dependencies of the application source code.
Note: Capturing traces of every request is resource-intensive, so it is recommended to use sampling to reduce overhead.
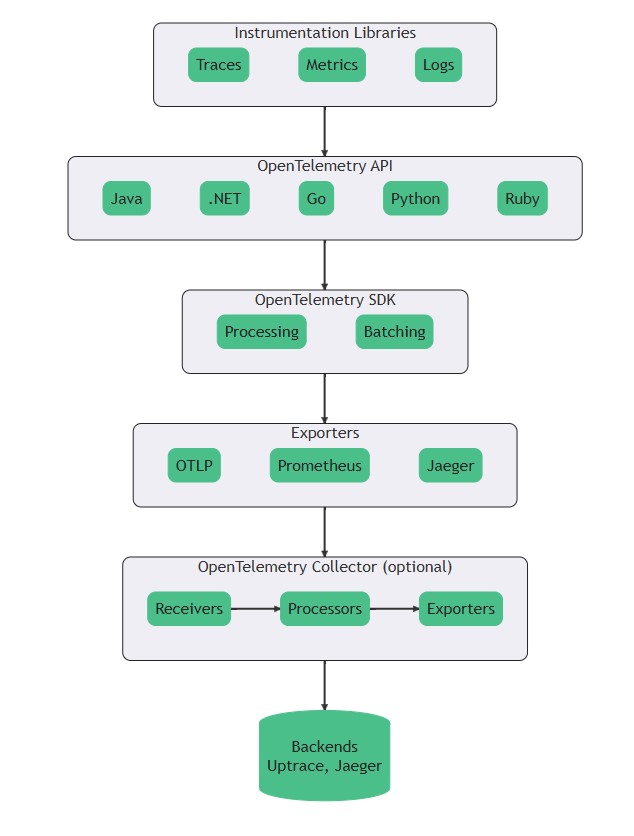
Essential steps in setting up code-based instrumentation.
- Import the OpenTelemetry API and SDK
- Configure the OpenTelemetry API
- Configure the OpenTelemetry SDK
- Create Telemetry Data
- Export Data
🟥 Steps:
- Application imports the OpenTelemetry API and SDK.
- Create a TracerProvider.
- Attach a SpanProcessor (Batch or Simple).
- Configure an Exporter (Console, Jaeger, OTLP, etc.).
- Create Spans inside your code and export them.
Options:
SpanProcessor
- BatchSpanProcessor: Batches multiple spans and sends them at once (asynchronous). Useful for High performance production systems.
- SimpleSpanProcessor: Immediately exports span when it ends (synchronous). Useful for debugging, learning, very small apps.
Manual Instrumentation - Tracing
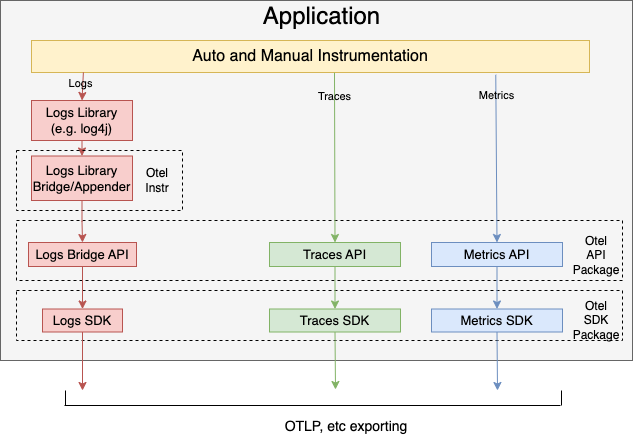
Big Picture: OpenTelemetry Tracing Pipeline
- OpenTelemetry Tracing API
- OpenTelemetry SDK
- Telemetry Generation
- TraceProvider
- Tracer
- Tracing Pipeline
- SpanProcessor
- SpanExporter
- Synchronous
- Asynchronous
- Telemetry Generation
As per Linux Foundation course OpenTelemetry
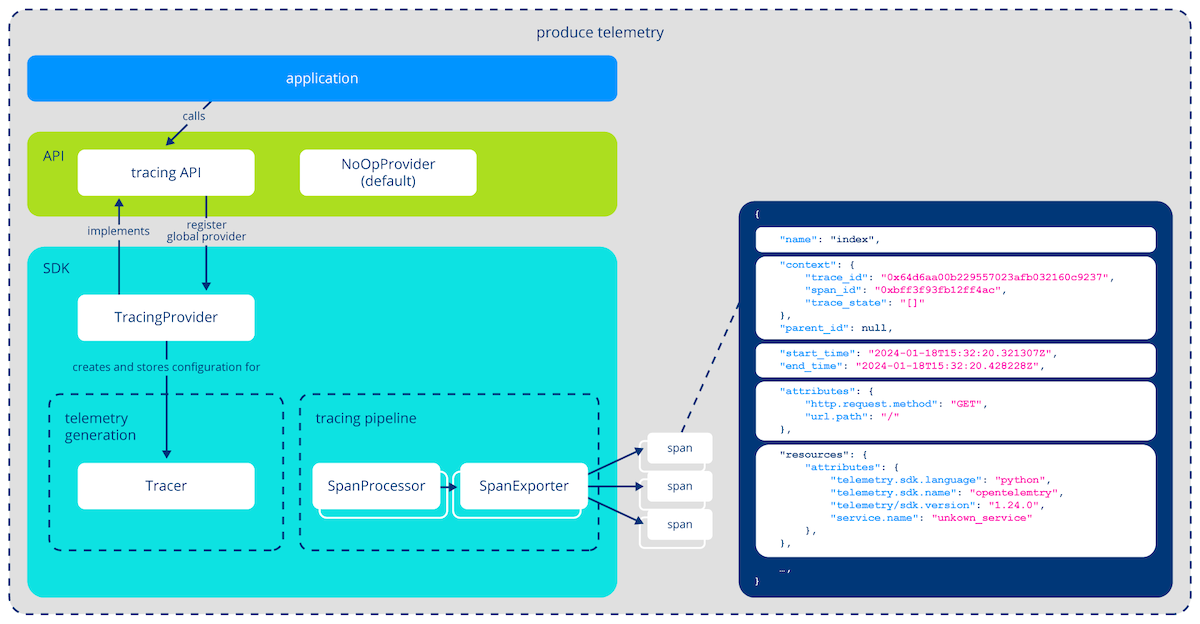
🟥 OpenTelemetry Tracing API
The API is what you use in your code to generate trace data. It’s just interfaces (no logic) that define how you:
- Create spans
- Set attributes
- Link spans
- Propagate context
Ex:
Tracer tracer = GlobalOpenTelemetry.getTracer("my-app");

Span span = tracer.spanBuilder("fetchData").startSpan();
try (Scope scope = span.makeCurrent()) {
    // business logic
    span.setAttribute("user.id", "123");
} finally {
    span.end();
}
🟥 OpenTelemetry SDK
The SDK is the actual implementation of the API. It provides the logic to:
- Record spans
- Process spans (e.g., sampling, filtering)
- Export them to telemetry backends
You typically bring in this SDK in your app as a dependency.
Ex:
<dependency>
  <groupId>io.opentelemetry</groupId>
  <artifactId>opentelemetry-sdk</artifactId>
  <version>1.34.1</version>
</dependency>
🟥 Best Practices
- Separate tracing-related configuration from the main application
- create tracing pipeline (instantiates a ConsoleSpanExporter & SpanProcessor)
- importing OpenTelemetry’s tracing API and the TracerProvider from the SDK
- In the main application: import the function created above and assign the return value to a global variable.
- Enrich spans with context which is extracting meaningful insights into what is happening in a system, with additional context. Follow Semantic Conventions for standardization which helps to improve consistency
- Carefully consider collecting span from all methods and can ignore collecting from few methods.
🟥 Manual Instrumentation: Defining Traces
- Resource is a set of static attributes that help us identify the source (and location) that captured a piece of telemetry. separate the resource and tracing configuration as better practice.
- Semantic Conventions for standardization which helps to improve consistency
- Span Attributes Aside from static resources, spans can also carry dynamic context through SpanAttributes. Thereby, we can attach information specific to the current operation to spans.
🟩 Context Propagation
To construct trace we need to tie indivdual spans together. For this purpose we must pass contextual metadata between adjacent operations, which are separated by a logical boundary. OpenTelemetry calls this information SpanContext.
- Tracing SDK “automatically” handles context propagation within the same process.
- If there is network boundary, OpenTelemetry’s data transmission system includes the concept of propagators. Propagators serialize context, so it can traverse the network along with the request. Make sure include this context in outgoing requests.
- By default, OpenTelemetry uses a specification established by the World Wide Web Consortium (W3C). Looking at the header’s value, we can infer that it encodes the trace context as
- - - . - For propagation, the context can be embedded right into the request itself
- Ensure that trace context is correctly received and passed on — so that all services involved in a request are part of the same distributed trace.
Configure Context Propagation
Steps:
- Extract context from incoming request headers.
- Attach context to current request.
- Use start_as_current_span() within the context. New span becomes child of upstream span
- Inject context into outgoing requests (if any). So it will Pass trace context to downstream services
- Detach context after request (optional). Cleanup to prevent context leakage
| What You’re Doing | Code/API Used |
|---|---|
| Receive context from upstream | extract(request.headers) |
| Make it active in current app | attach(context) |
| Start new span in same trace | start_as_current_span("...") |
| Pass context to downstream | inject(headers) |
| Clean up | detach(token) |
✅ Next Chapter: Sampling
✅ Main Page: Click Here