MyObservability
Deep Dives
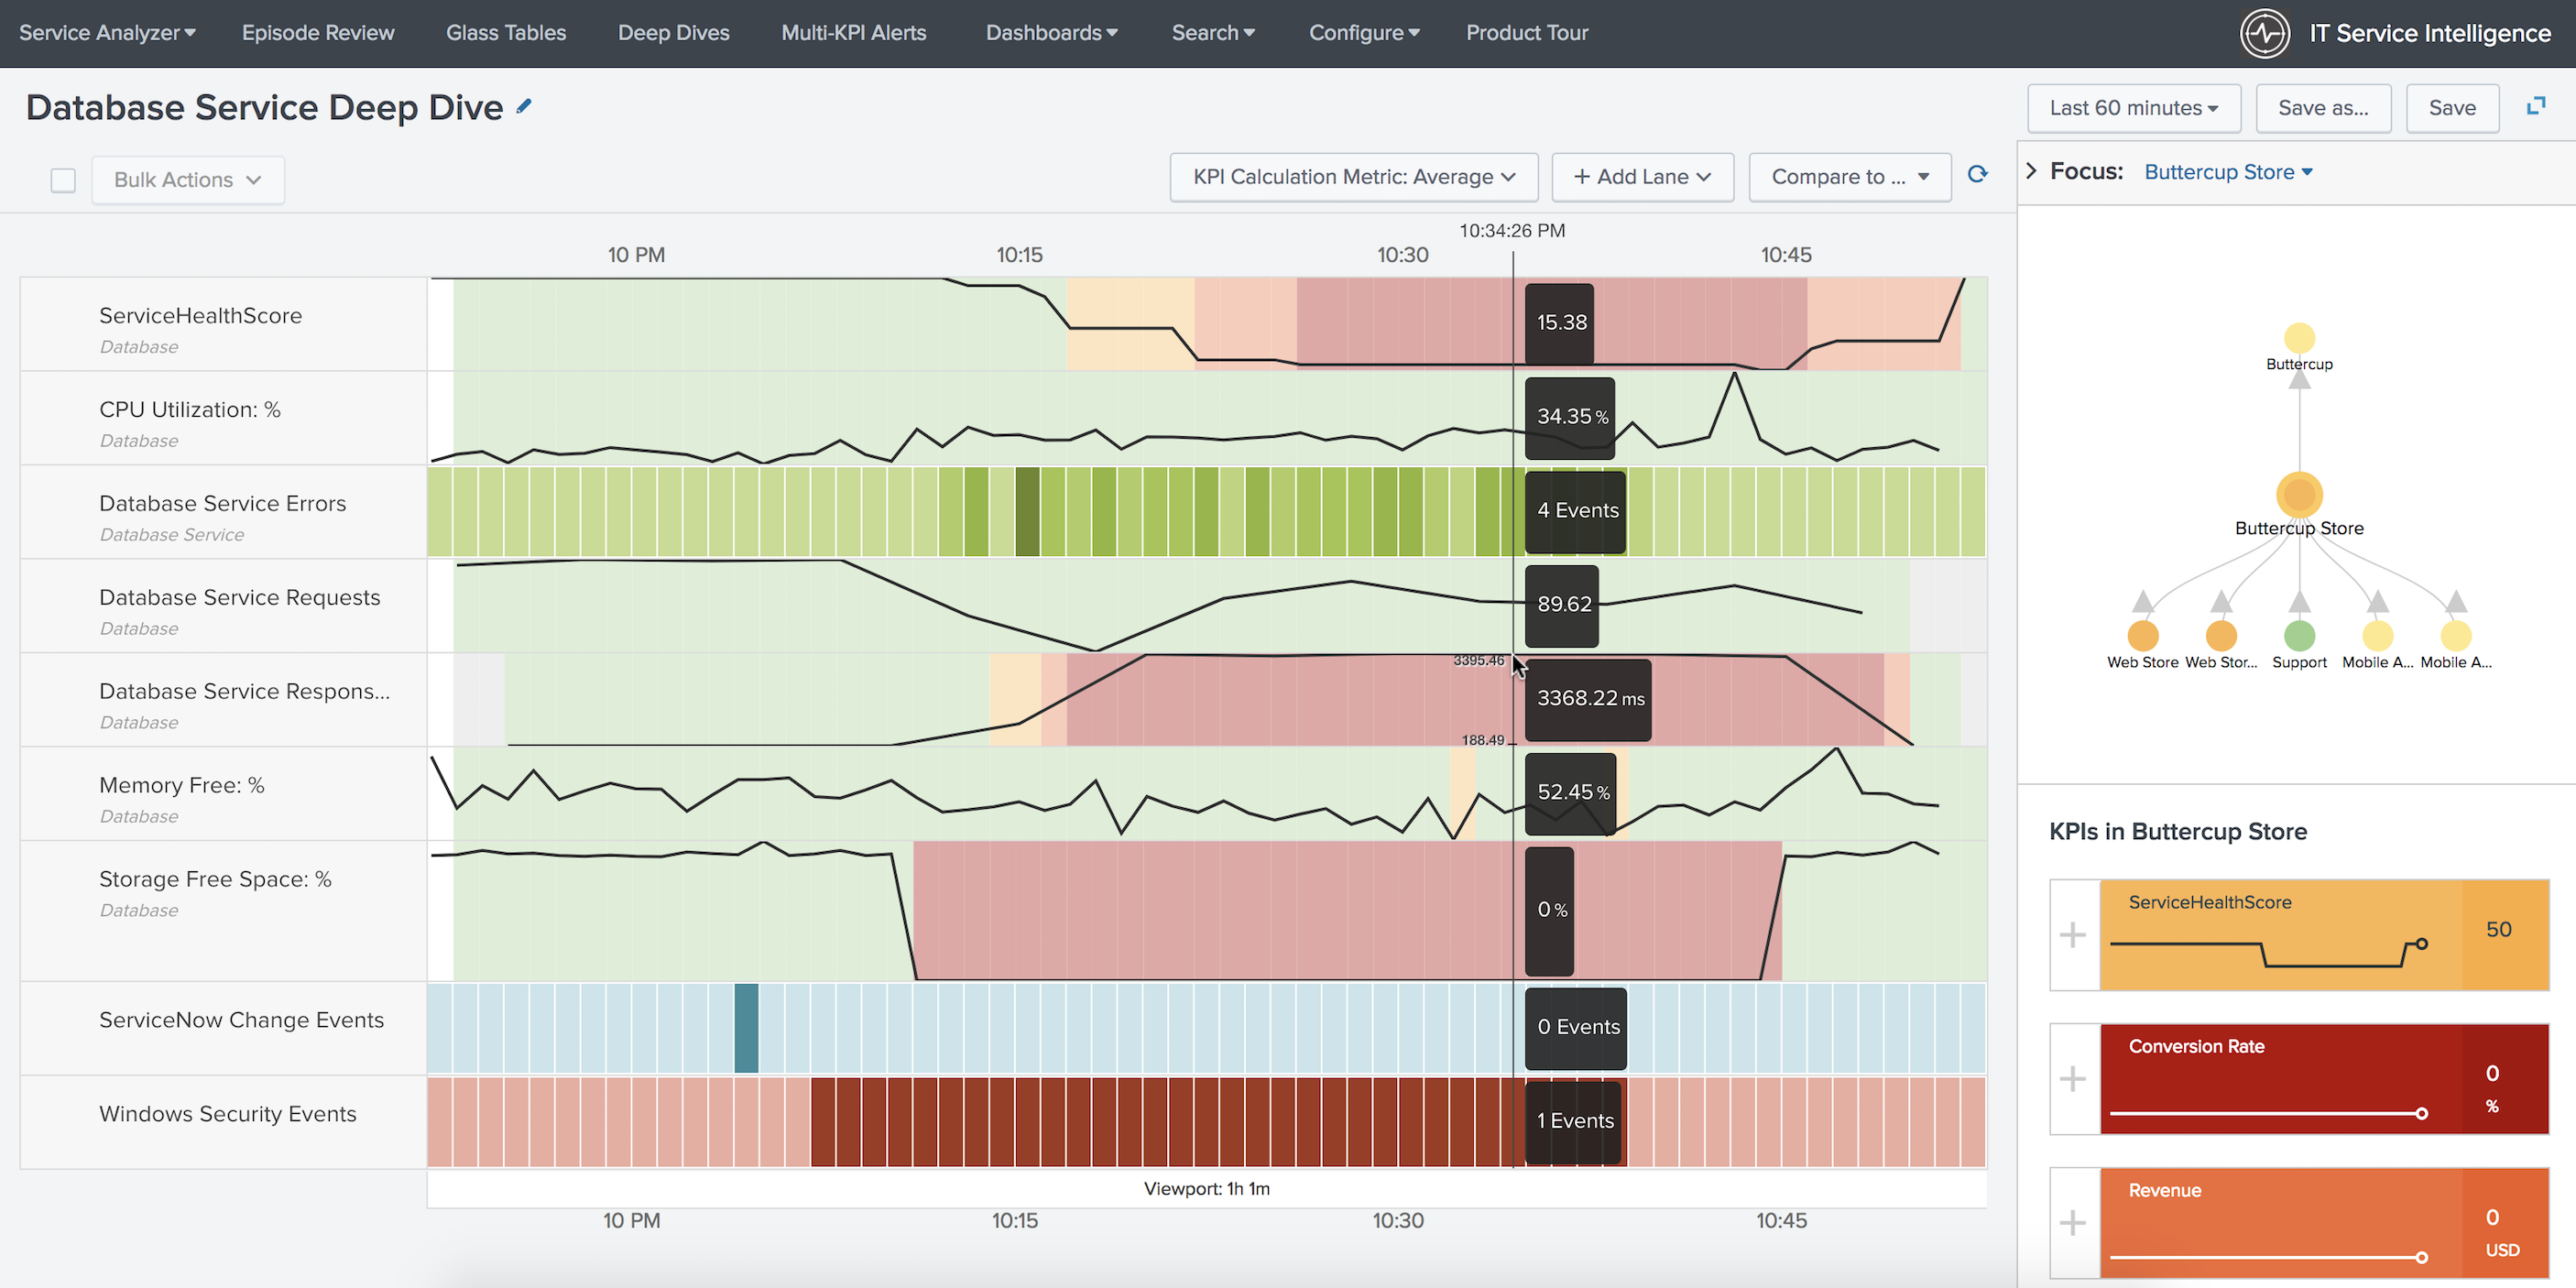
Deep dives an investigative tool, display KPI search results over time and help you visually correlate the root cause of search results.
Deep dive searches append the timechart time series command to KPI searches to generate data in the proper format - _time column and data series column. You can use deep dives to quickly zoom in on metric and log events, and visually correlate root cause.
Path: ITSI -> Deep Dives -> Creare Deep Dive -> Add lane to start adding metric, KPI and event lanes to your deep dive.
Add Lane
- Metric Lane: user-defined data model or ad hoc search.
- KPI Lane: existing KPIs in your services.
- Event Lane: number of occurrences of a specific event type over time
Configure Deep Dives
- Configure the KPI aggregation metric
- Compare search results from different time ranges
- Add entity and anomaly overlays to a deep dive
- Create a multi-KPI alert from a deep dive
Configure the KPI aggregation metric Switch the KPI aggregation metric between average, median, maximum, and minimum to better visualize search results aggregated over the selected time range.
For example, you have a 15-minute KPI over a 24-hour period, giving you 96 total data points. But if the deep dive is only capable of rendering 50 data points, is must reduce the size of that data from 96 to 50. ITSI distributes the 96 data points into 50 distinct buckets, then it uses the selected KPI Aggregation Metric (average, median, maximum, or minimum) to perform a statistical operation on each bucket. It uses the output of that statistical operation as the single data point to plot in the deep dive for each time bucket.
Compare search results from different time ranges in an ITSI deep dive Deep dives in IT Service Intelligence (ITSI) provide a twin-lane comparison view that lets you compare search results from different time ranges.
In a deep dive, click Compare to
Add entity and anomaly overlays to a deep dive in ITSI
- Entity overlays let you see how specific entities are performing relative to others and to the aggregate value. Anomaly overlays let you see statistical outliers in KPI search results.
- Anomaly overlays let you view these outliers and track anomalous trends in your KPI data.
KPI lane and select Lane Overlay Options.
Create a multi-KPI alert from a deep dive in ITSI Create a multi-KPI alert from a deep dive if you’re troubleshooting an issue in IT Service Intelligence (ITSI) and see a correlation between two or more KPIs.
Next Chapter: KPI Alerting