MyObservability
Log Management and Analytics - Powered by Grail
OneAgent automatically detects log sources for monitored processes. For files that are not detected or windows events add custom files configuration.
- Any data can be ingested
- Almost limitless storage
- No schema definition necessary
- All data available at any time
- Indexless storage
- Massive parallel process
- Analyzes petabytes real-time
- Query via DQL (Dynatrace Query Language)
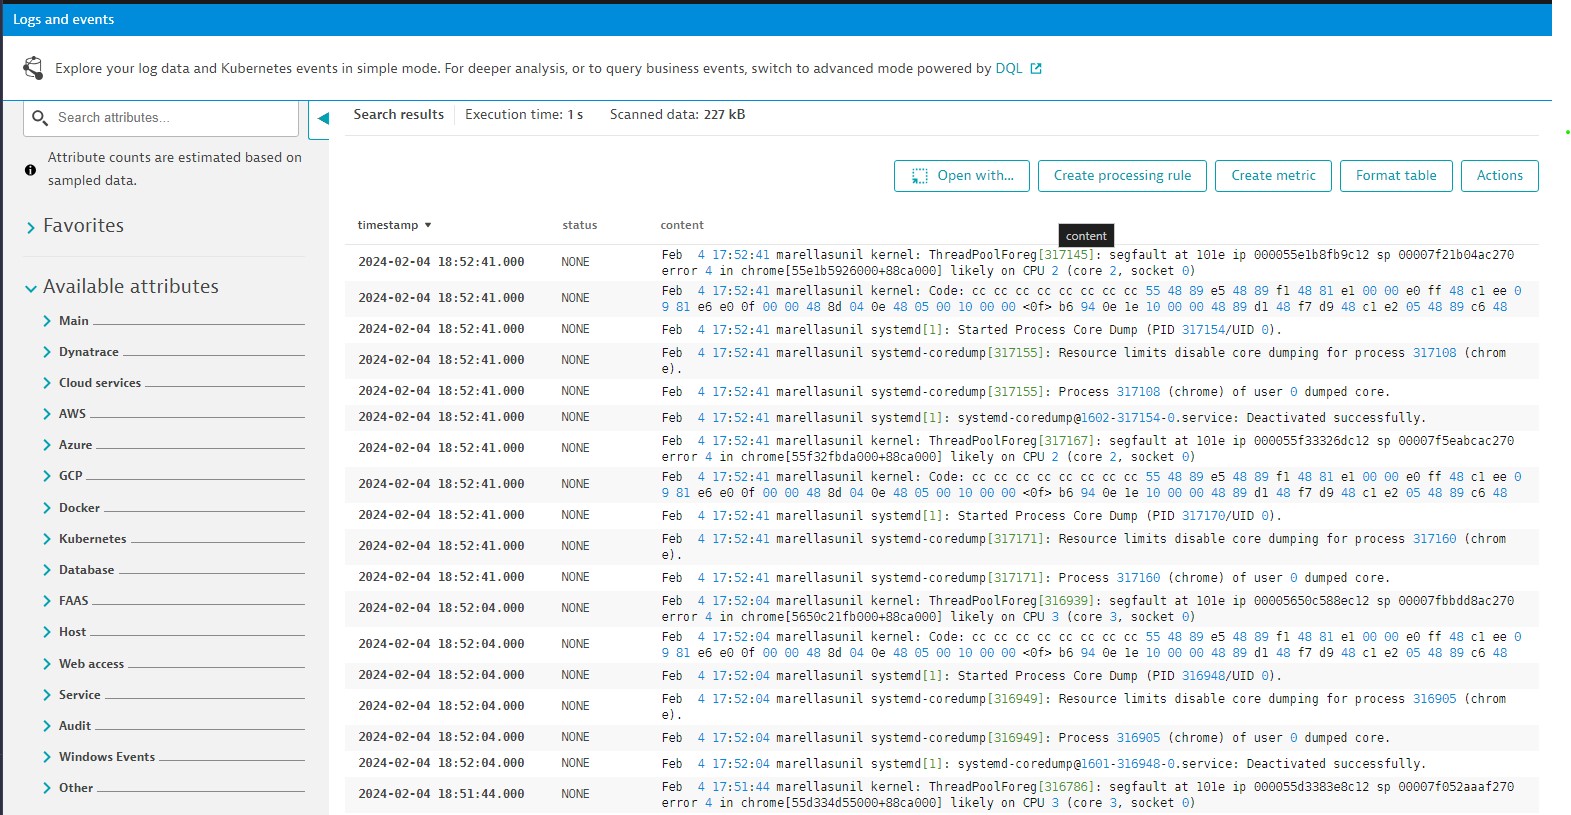
Logs can correlate data by directly correlating to user session & traces for more refined analysis for faster troubleshooting.
Collecting Logs
Settings -> Log Monitoring
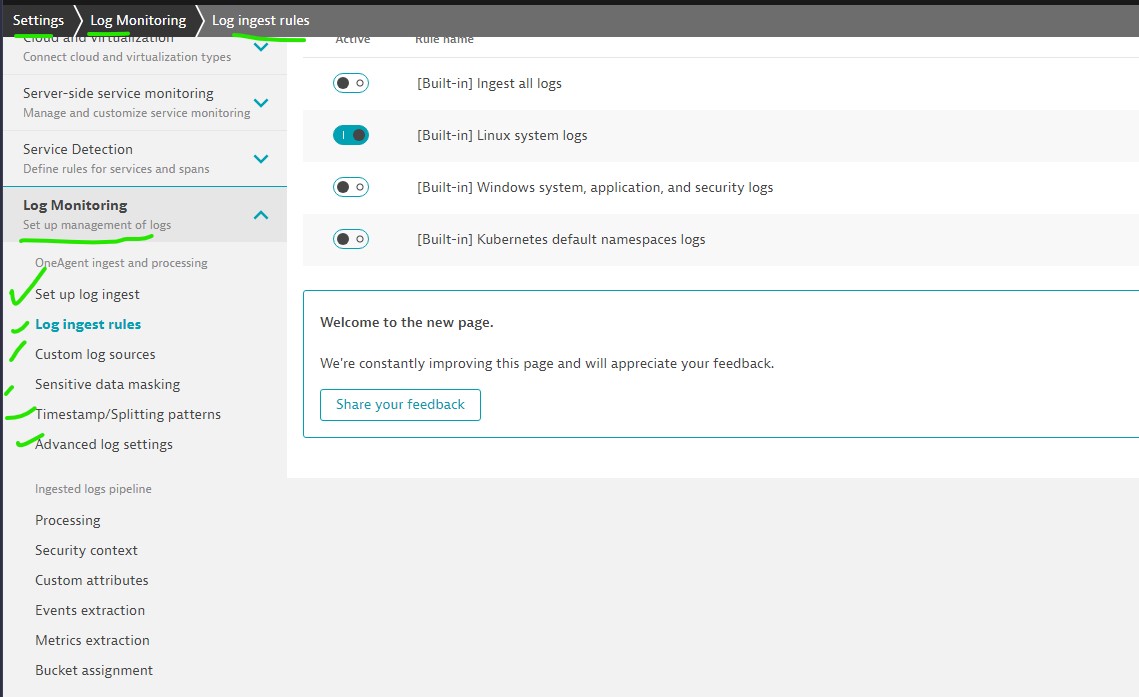
Log monitoring - Available options
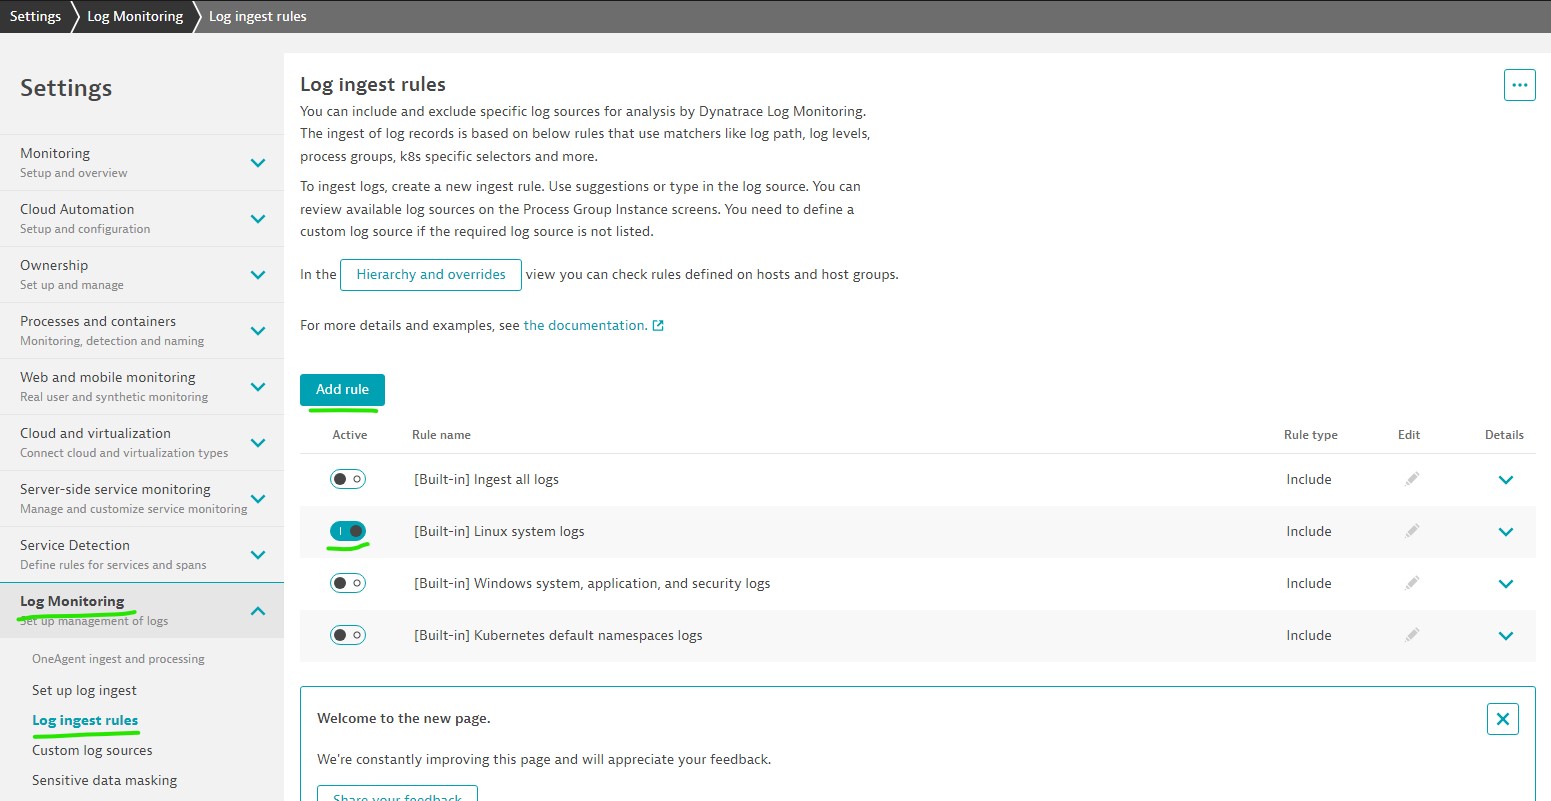
- Log ingest rules: Use this option to enable log monitoring for pre populated option/standard location.
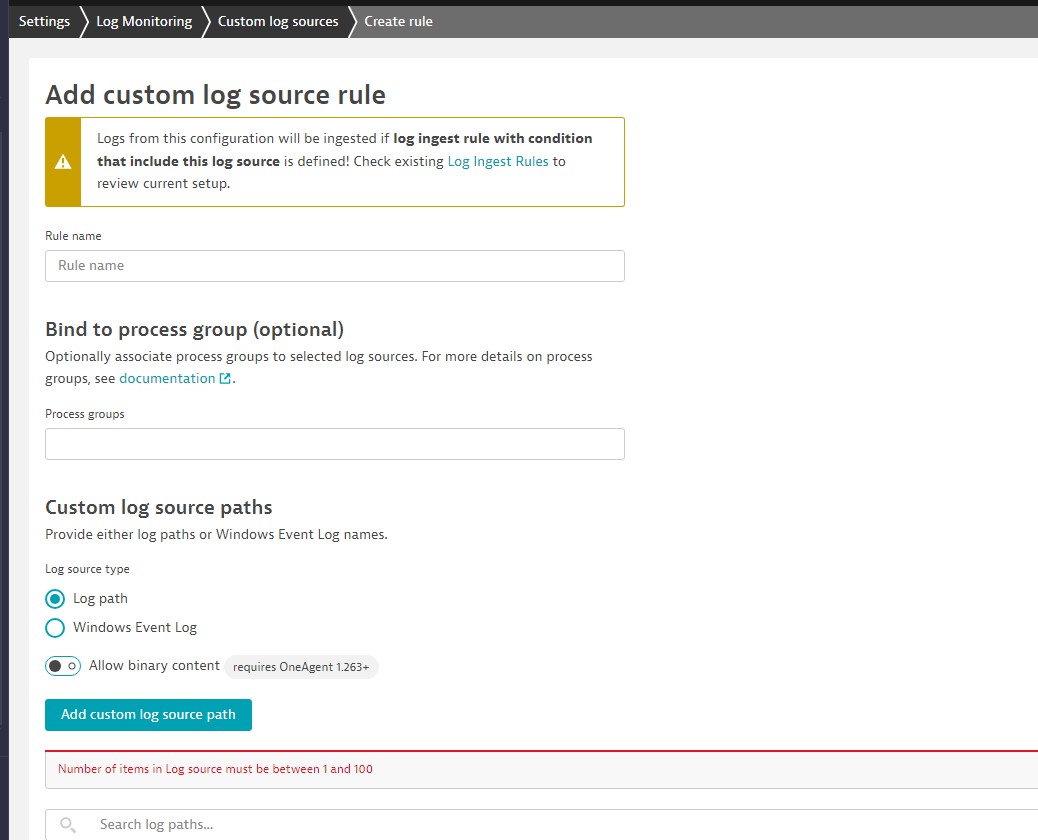
- Custom ingest rules: Add custom log sources before creating log ingest rule. which is in different location.
- Sensitive data masking: Create rules to mask any information consider to be sensitive.
- Timestamp/Splitting patterns: In case number of timestamp formats in your log records. Define the rules for data quality.
- Advanced log settings: OneAgent options for Dynatrace Log Monitoring
Log ingest rules:
Custom ingest rules:
Advanced log settings:
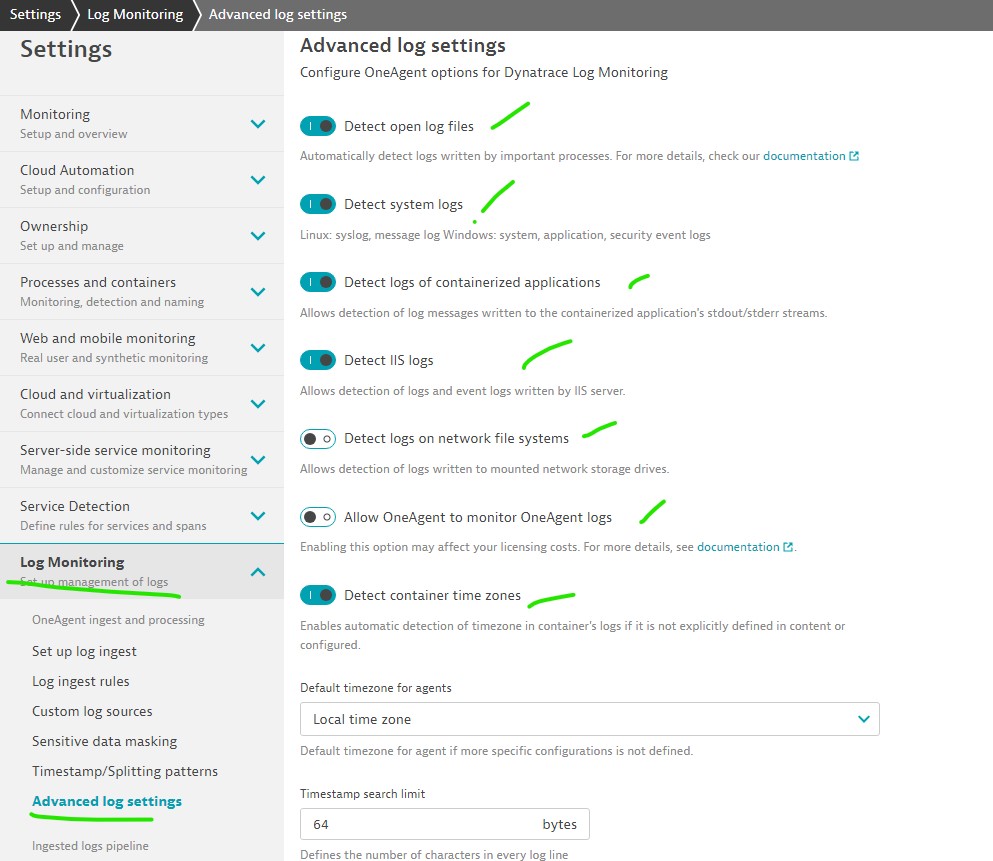
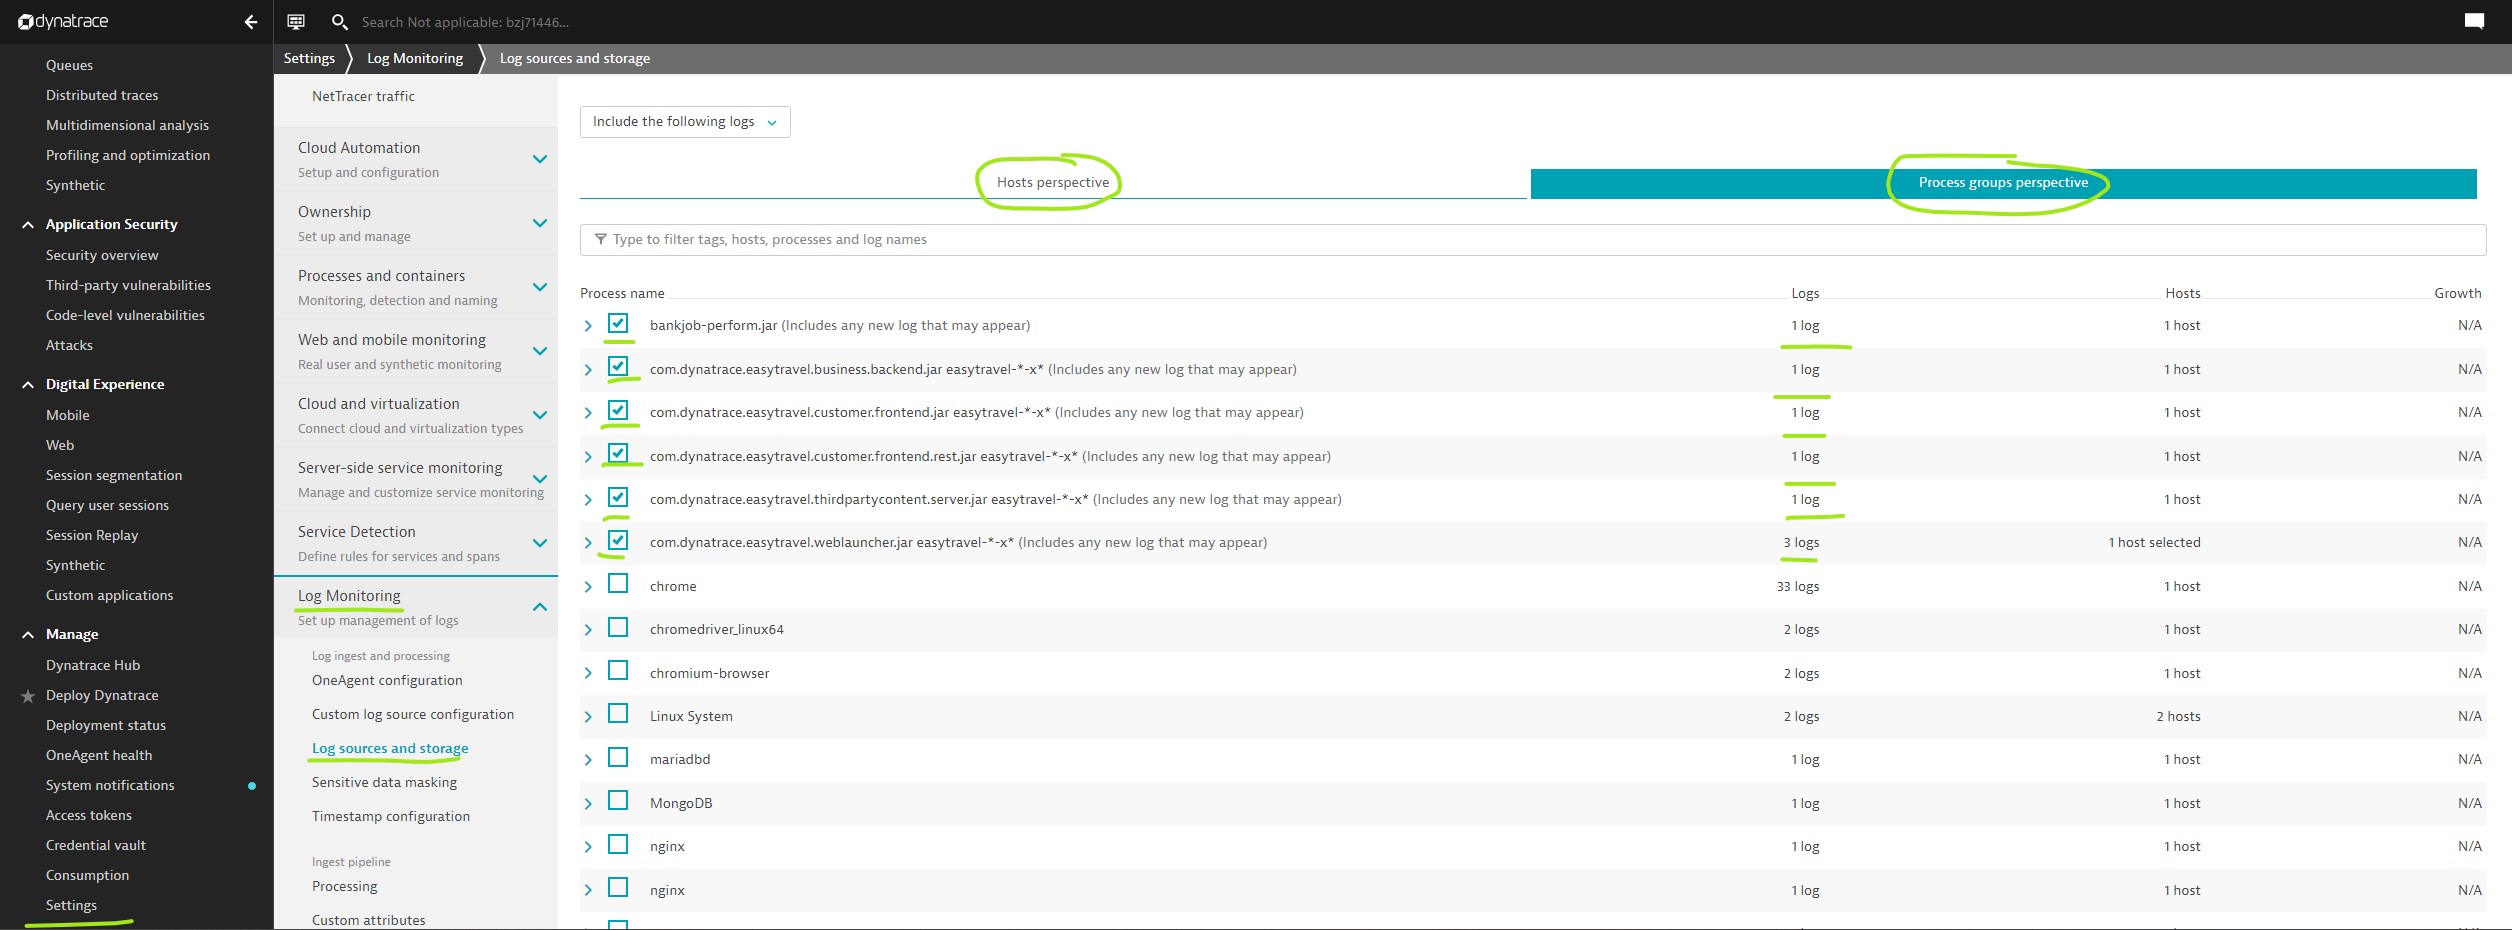
Options:
- Host perspective (Like /var/log/message) related to source data
- Process groups perspective: related to process group data (Ex: Easy travel / maria DB etc)
Processing: Logs can be transformed through processing rules for common technologies. You can create your own processing rules like fetching apache error code. similar to regex.
Path: Settings -> Log monitoring -> Processing
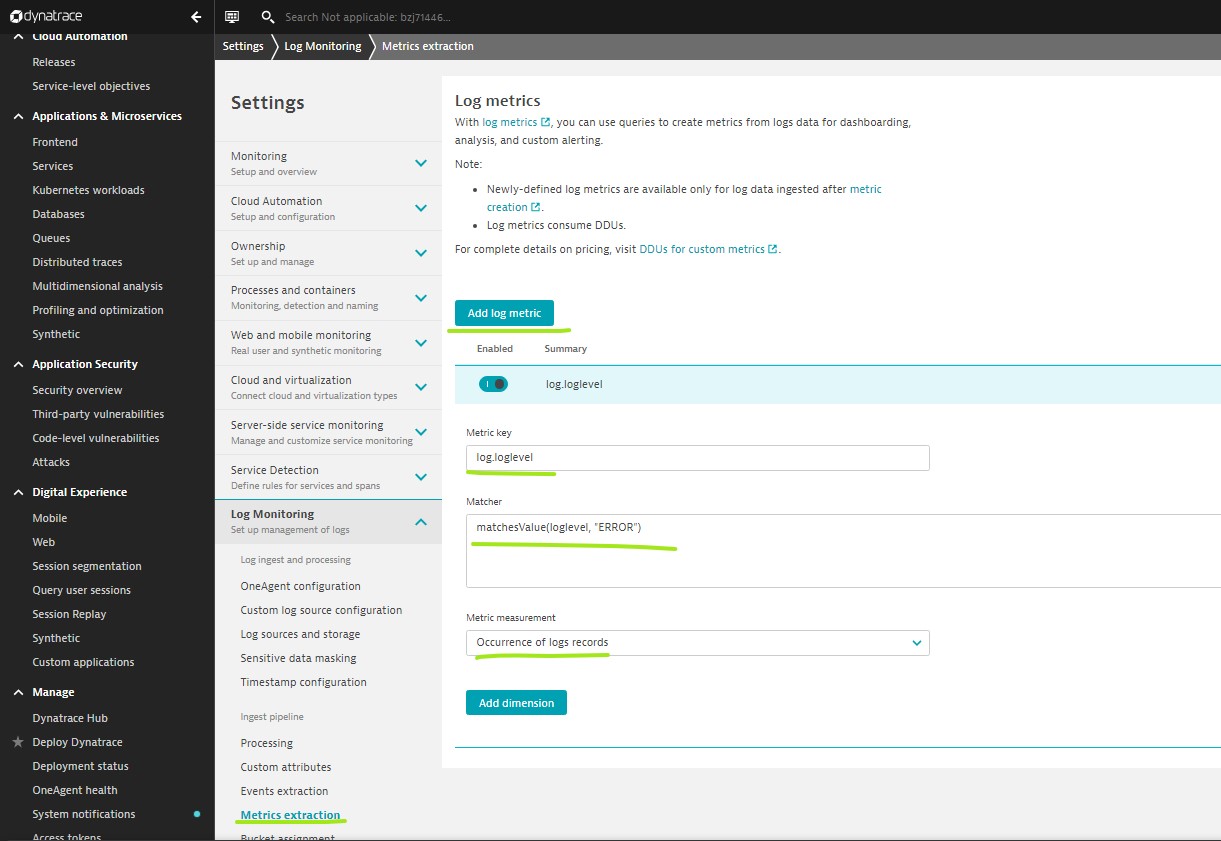
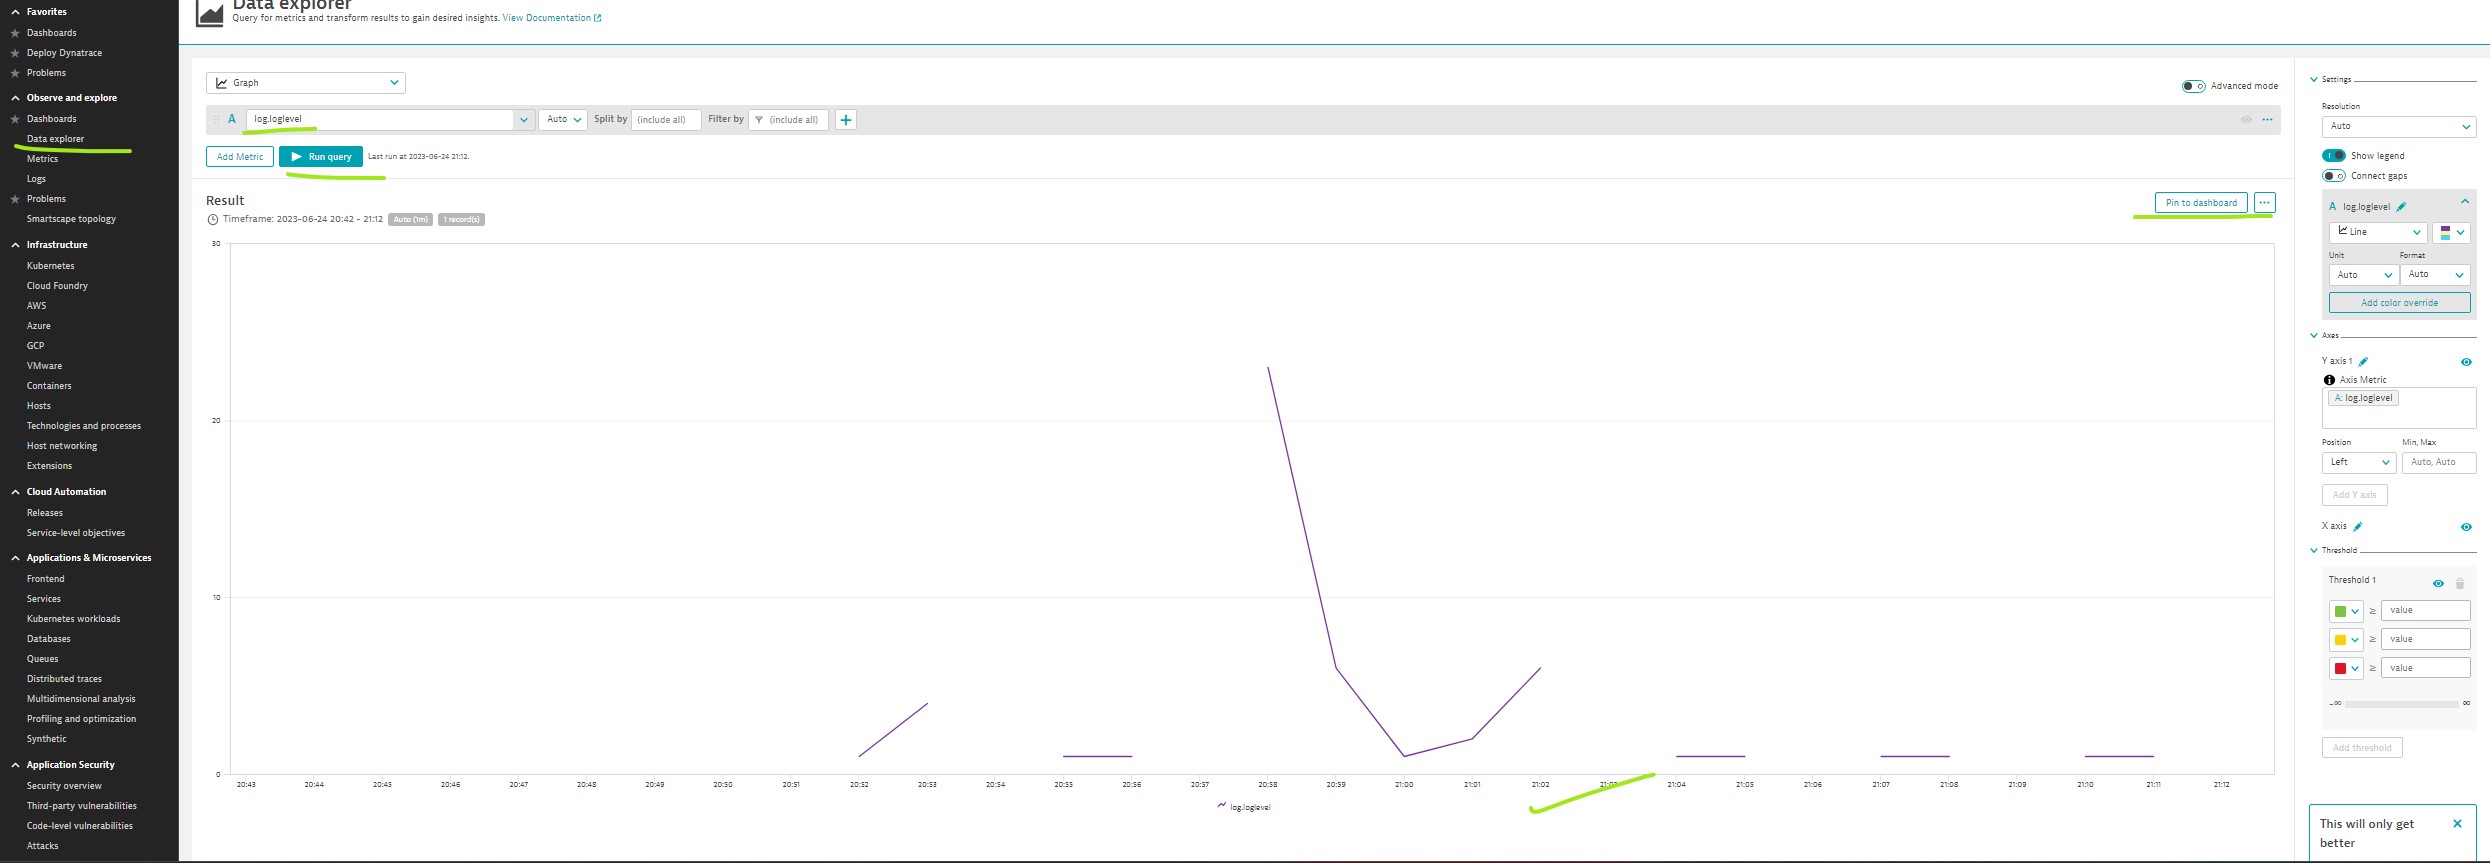
Creating a log metric: With log metrics, you can use queries to create metrics from logs data for dashboarding, analysis, and custom alerting. Like counting how many HTTP errors from Apache logs.
Path: Settings -> Log monitoring -> Log Metrics
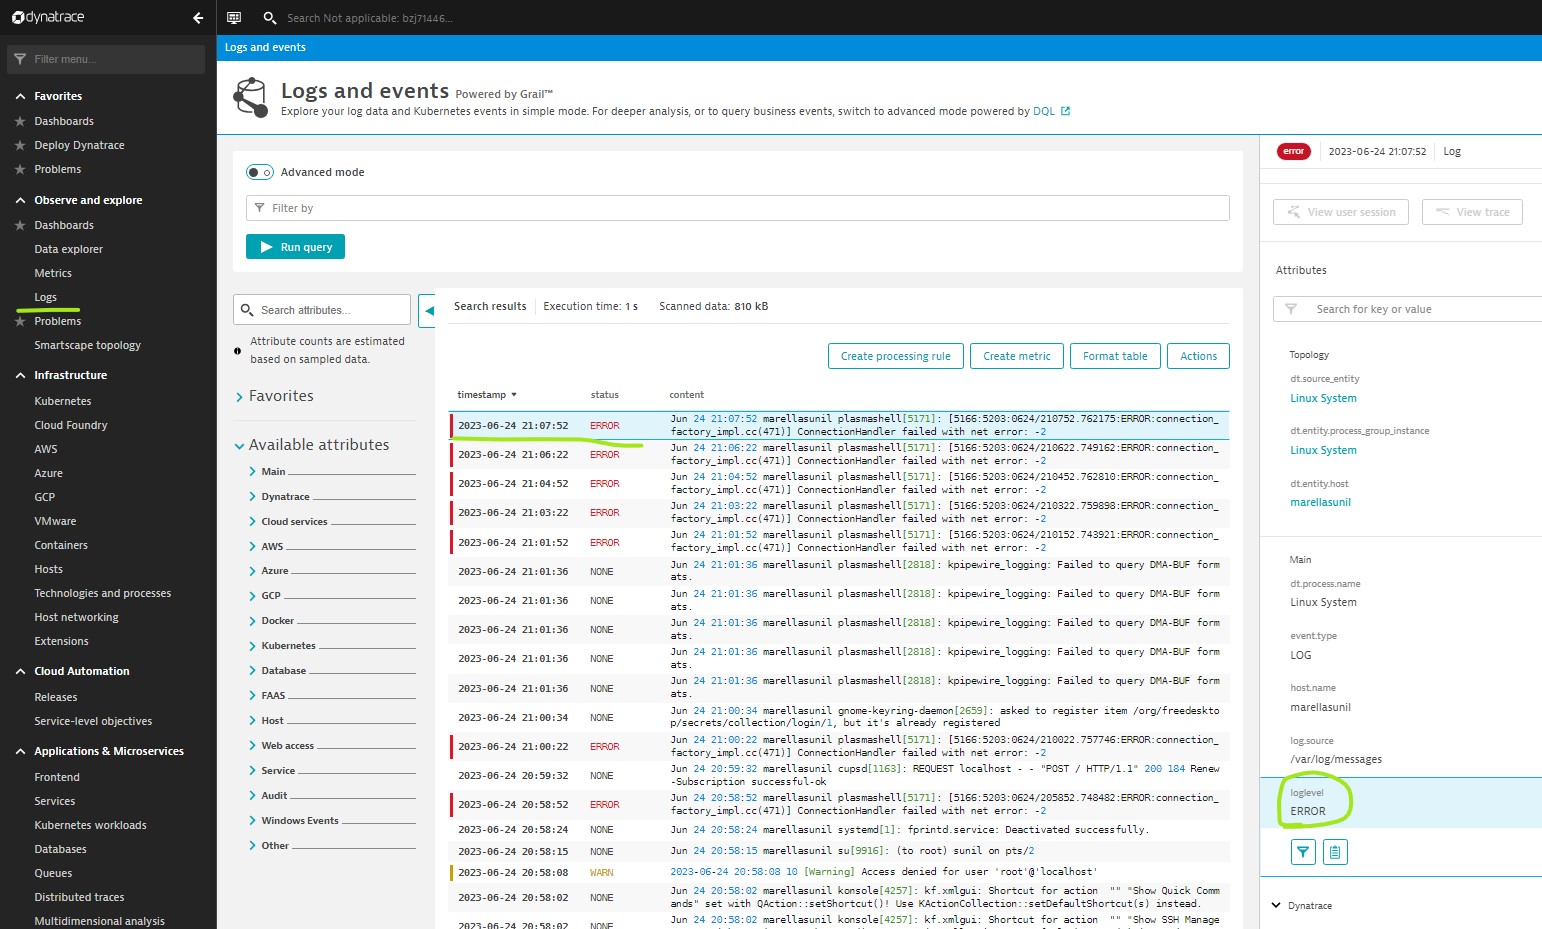
Ex: Counting Errors in /var/log/messages
Creating alert based on Metric:
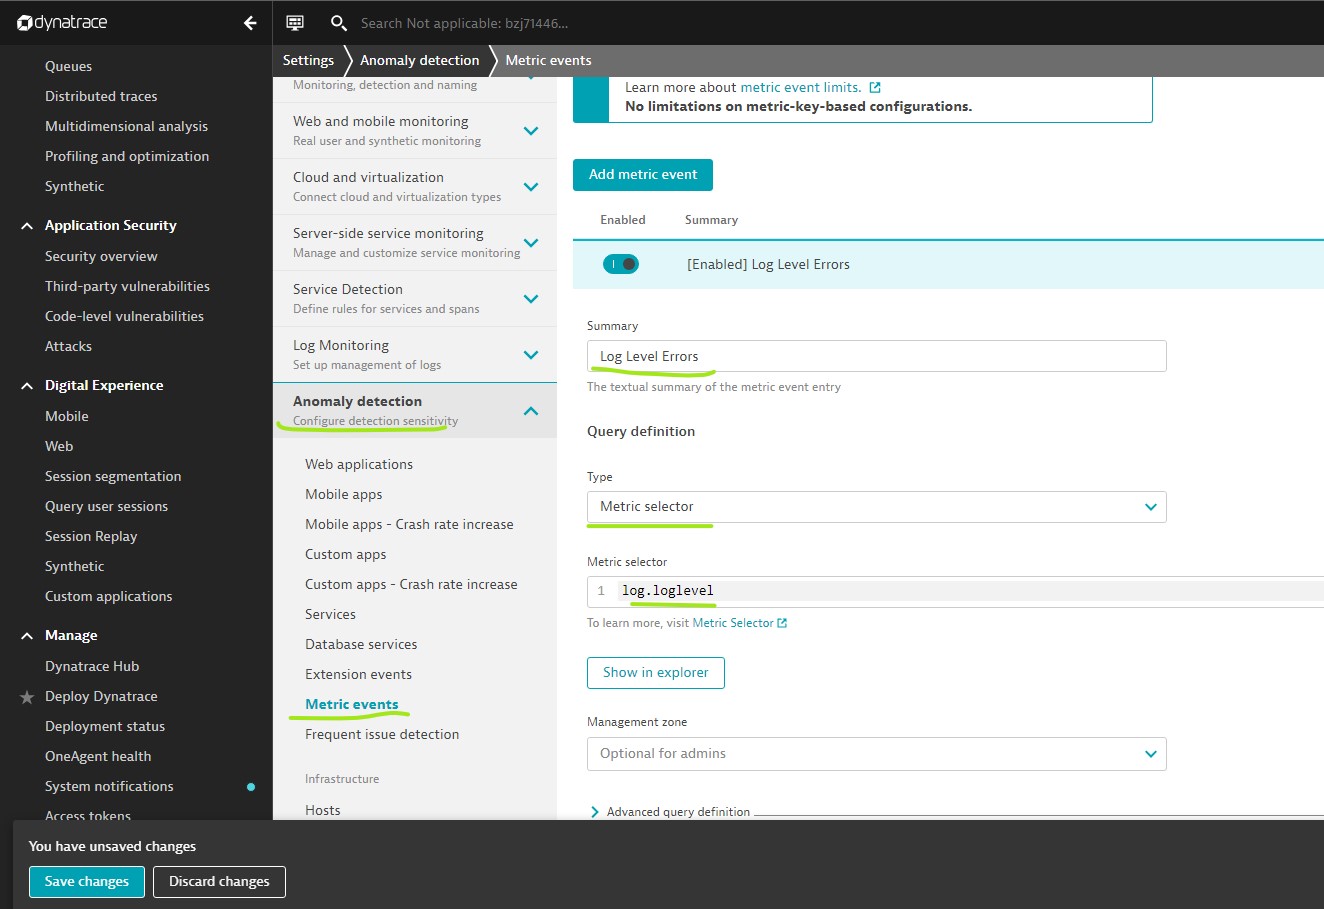

 Create event templete: Title, description..
Configuring Log Management & Analytics: Settings -> Monitoring -> Monitored Technologies -> Log Monitoring (Make sure that toggle enabled)
Steps:
- OneAgent Setting: Settings -> Log monitoring -> One Agent Configuration -> Toggle required parameters.
- Log Source Configuration: Settings -> Log monitoring -> Custom log source configuration -> Activate Custom log source configuration -> Choose process groups -> Log & log path (Up to 100)
- Sensitive Data Masking: Settings -> Log monitoring -> Sensitive data masking -> Add rule
- Timestamp configuration: Settings -> Log monitoring -> Timestamp configuration
- Log Buckets (Retention period): Settings -> Log monitoring-> Log buckets -> Add rules
Main Page: Infrastructure Monitoring
Next Page: Network Monitoring
Dynatrace : Main Page