MyObservability
Process & Process Groups
Dynatrace automatically merges related processes into process groups. A “process group” is a logical cluster of processes that belong to the same application or deployment unit and perform the same function across multiple hosts.
Process Vs Services: Processes are essentially containers that host services. When you look at processes, you’re seeing topology information, whereas services give you code-level insight. For example, you might have a Tomcat process that hosts a web application in the form of a server-side service. While processes are host-centric, associated with a single machine in your environment, services are request-centric and therefore typically span multiple machines in a data center.
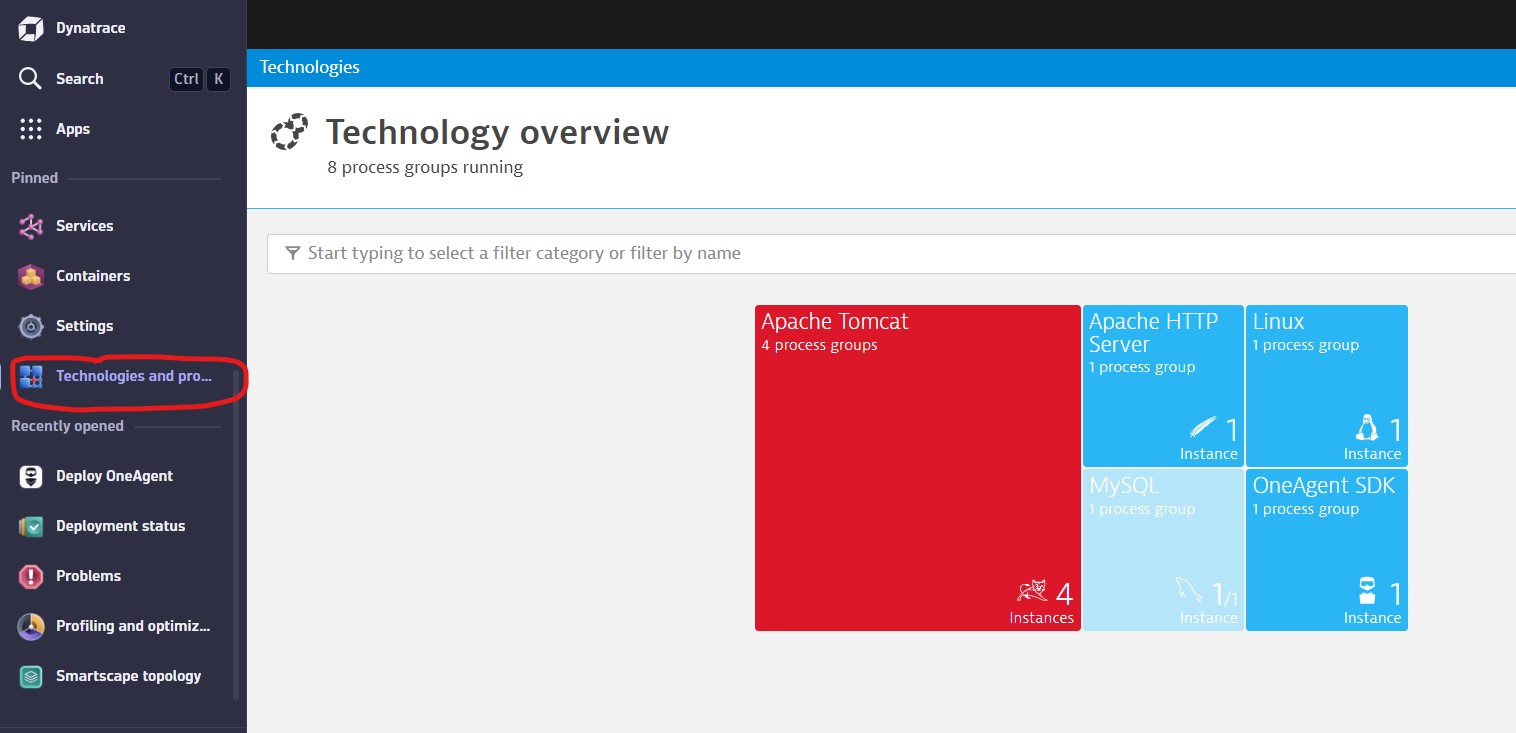
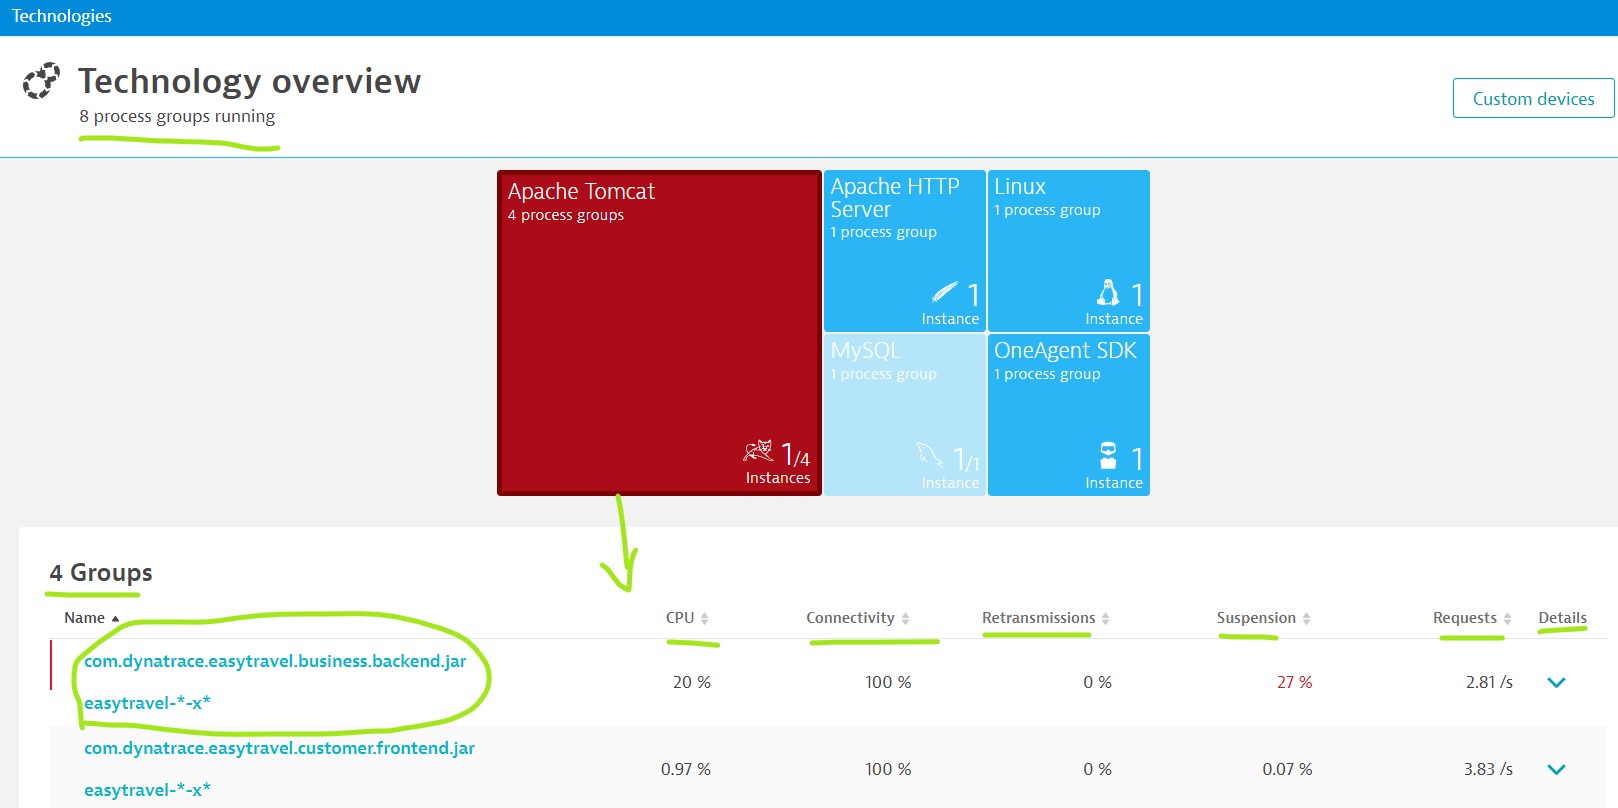
Technologies:
Dynatrace automatically detects application types such as Tomcat, JBoss, Apache HTTP Server, MongoDB, and many others technologies.
To create process groups, Dynatrace uses specific process properties.
- For Tomcat, Dynatrace uses CATALINA_HOME and CATALINA_BASE to distinguish between different Tomcat clusters.
- For JBoss, Dynatrace uses JBOSS_HOME and the JBoss cluster configuration.
- For generic Java processes, Dynatrace uses the JAR file or the main class used to start the process.
There are also many specialized detection mechanisms. For example, Dynatrace can detect:
- IBM WebSphere clusters and domains
- Oracle WebLogic clusters and domains
- Cassandra clusters
- Tibco BusinessWorks engines
- Kubernetes apps
- OpenShift apps
- Cloud Foundry apps
- Azure Web Apps And more…
Process Monitoring Capability
- Process Metrics
- CPU Usage: Dynatrace monitors the CPU usage of each process running on a host, allowing you to identify processes that consume high CPU resources.
- Memory Usage: Tracks the amount of memory (RAM) each process uses, including details on physical memory, virtual memory, and heap usage for JVM-based processes.
- Disk I/O: Monitors disk read/write activity performed by a process, helping to detect if disk operations are causing performance bottlenecks.
- Network Activity: Measures the network traffic generated by the process, such as the amount of data sent and received, to determine network-related issues.
- Thread Count: Tracks the number of threads running in a process to identify potential issues like thread leaks or performance degradation.
- Process Health Monitoring
- Process Availability: Dynatrace monitors whether a process is running or has crashed. It alerts you if a critical process stops or fails to restart.
- Crash Detection: Identifies when a process crashes, including information on the reason for the crash, and attempts to correlate it with other system issues.
- Resource Overload Detection: Alerts when a process is consuming excessive system resources (e.g., memory, CPU, or I/O), helping identify potential performance problems.
- Process Groups
- Process Grouping: Dynatrace groups similar processes into “process groups” for easier monitoring. For example, all instances of an Apache web server across multiple hosts can be tracked together as a single process group.
- Automatic Detection: Dynatrace automatically detects and groups processes based on their characteristics, making it easier to monitor large environments with many hosts.
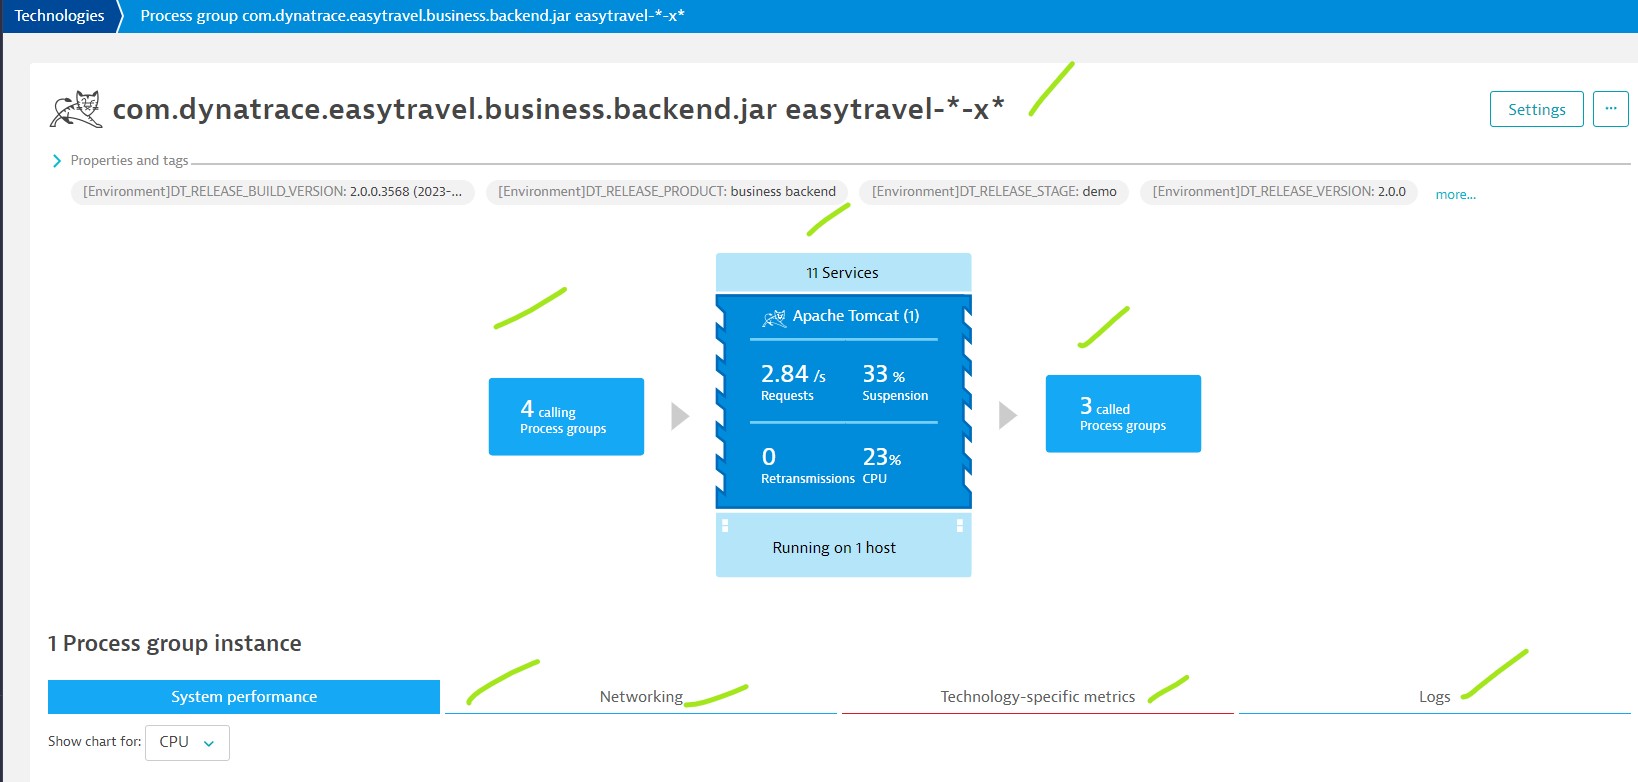
- Process Connections and Dependencies
- Network Connections: Monitors the communication between processes running on different hosts, showing inbound and outbound connections, including external connections (such as database servers or third-party services).
- Process Dependencies: Visualizes how different processes are connected and dependent on one another, helping to detect bottlenecks caused by dependent processes.
- Connection Latency: Monitors the latency of connections between processes, which can help diagnose slow inter-process communication.
- Process-Specific Monitoring for Special Components
- Java Processes: For Java-based applications, Dynatrace provides detailed monitoring of JVM metrics, including garbage collection, heap memory usage, and JVM threads.
- Database Processes: Monitors database-specific processes, such as MySQL, PostgreSQL, or Oracle database servers, tracking query execution times, memory usage, and connections.
- Web Servers: Tracks the performance of web server processes (e.g., Apache, Nginx), including metrics like request rates, response times, and error rates.
- Custom Process Monitoring
- Custom Metrics: You can configure custom metrics to monitor specific characteristics of a process, such as special logs, application-specific data, or non-standard metrics.
- Custom Alerts: Set custom thresholds to trigger alerts based on specific process metrics (e.g., if memory usage exceeds a certain limit or if a specific process restarts).
- Process Snapshots
- Process Snapshots: Dynatrace takes snapshots of running processes periodically or during incidents. These snapshots capture detailed information about the state of the process, including active threads, memory usage, and CPU load, which helps in root cause analysis.
- Root Cause Analysis
- Automatic Root Cause Detection: Dynatrace correlates process health with other infrastructure components (e.g., services, databases, networks), helping you identify the root cause of performance issues, such as resource contention or communication failures.
- Anomaly Detection: Uses AI-powered anomaly detection to identify abnormal behavior in process resource usage or performance, helping to detect problems before they impact service delivery.
- Process Restarts and Lifecycle Monitoring
- Process Restarts: Monitors process restarts to detect any unexpected behavior. Frequent restarts may indicate an underlying issue with the service or the host it’s running on.
- Uptime Monitoring: Tracks the uptime of processes, providing insights into stability and reliability. This is particularly useful for services that should remain running without interruption.
- Security Monitoring
- Security Vulnerability Detection: Dynatrace can monitor processes for known vulnerabilities, especially those running third-party libraries or services. It alerts you when outdated or insecure versions are detected.
- Runtime Application Self-Protection (RASP): Monitors processes for real-time attacks (such as memory exploits or injection attacks) and helps prevent them.
- Processes in Containerized Environments
- Containerized Process Monitoring: Dynatrace provides deep visibility into processes running inside containers (e.g., Docker, Kubernetes), tracking resource usage for individual containers and their associated processes.
- Kubernetes Pods and Node Monitoring: Tracks the health of processes running within Kubernetes pods and nodes, providing insights into how individual processes impact the health of the entire cluster.
- Process Dashboards and Reporting
- Custom Dashboards: Create dashboards for real-time monitoring of critical process metrics, such as CPU, memory, and disk usage, or network activity.
- Historical Reporting: View historical data on process performance over time, helping you identify trends, bottlenecks, or regressions in process performance.
Process Groups
Process Group Settings
- Global: Setup/define/monitor settings at environment level.
- Individual: Setup/define/monitor at Individual process level.
- Host: Setup/define/monitor at host level.
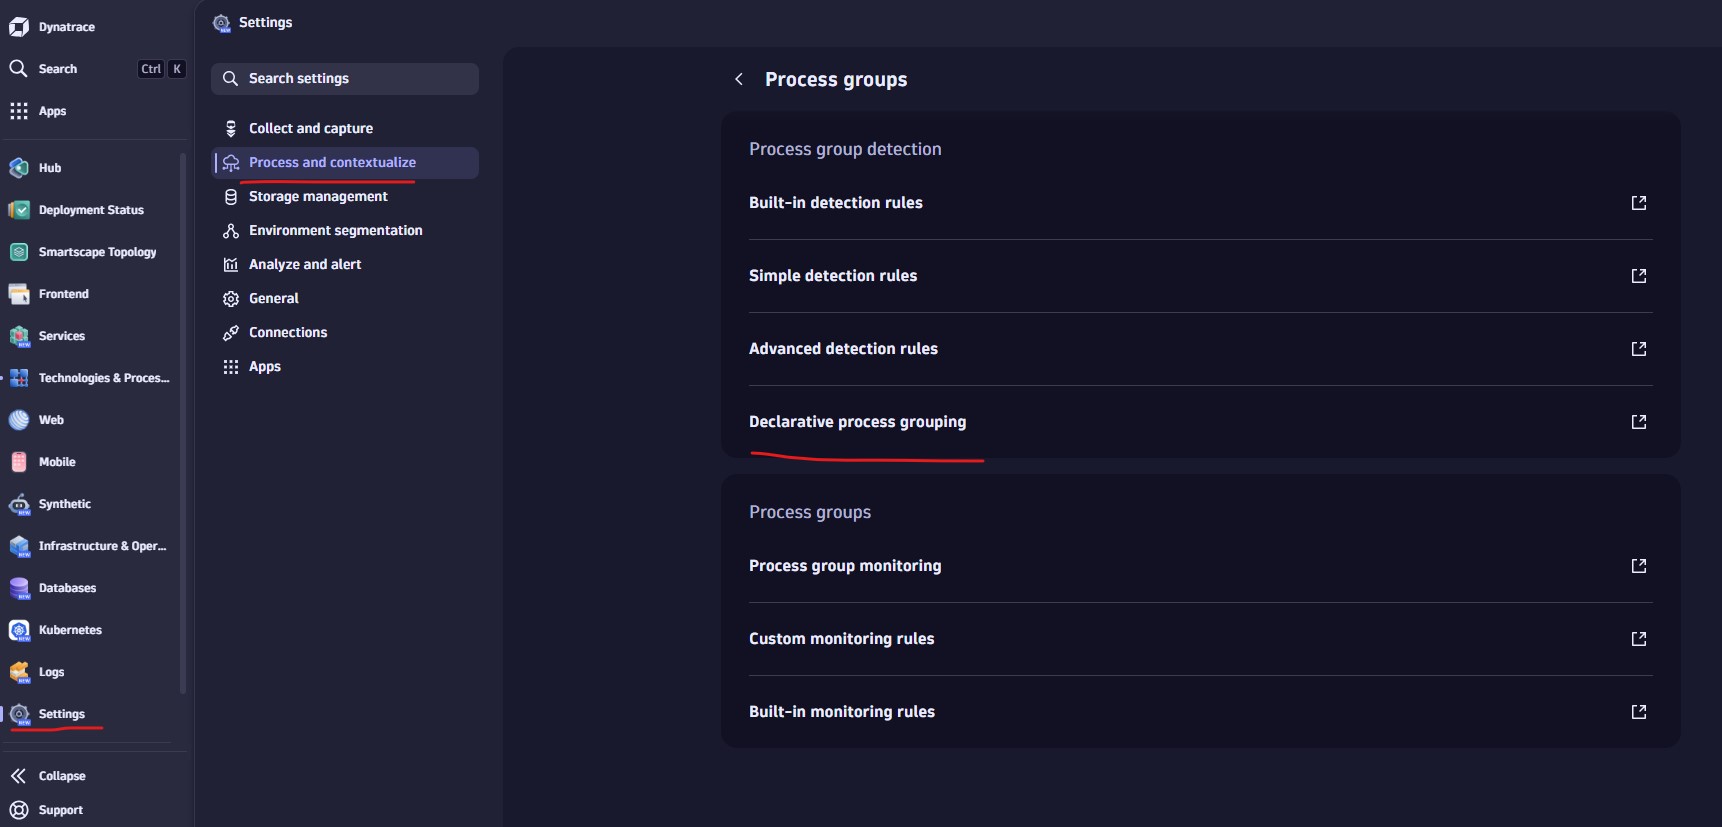
Process Groups Settings (Global)
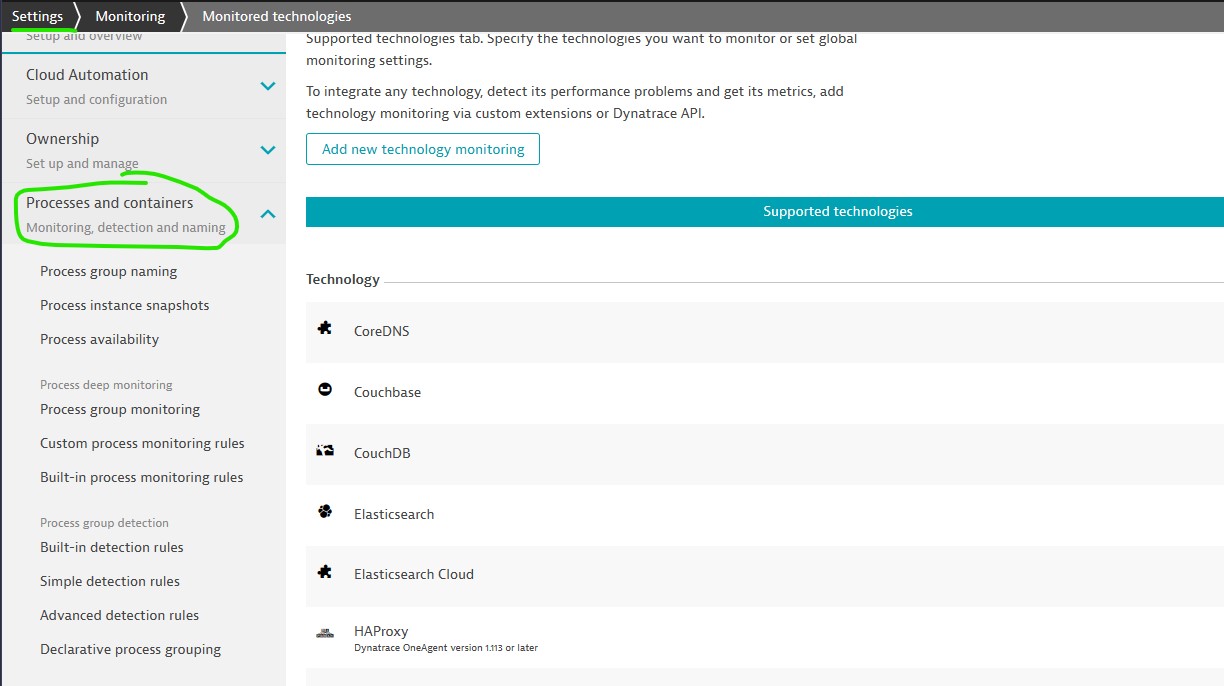
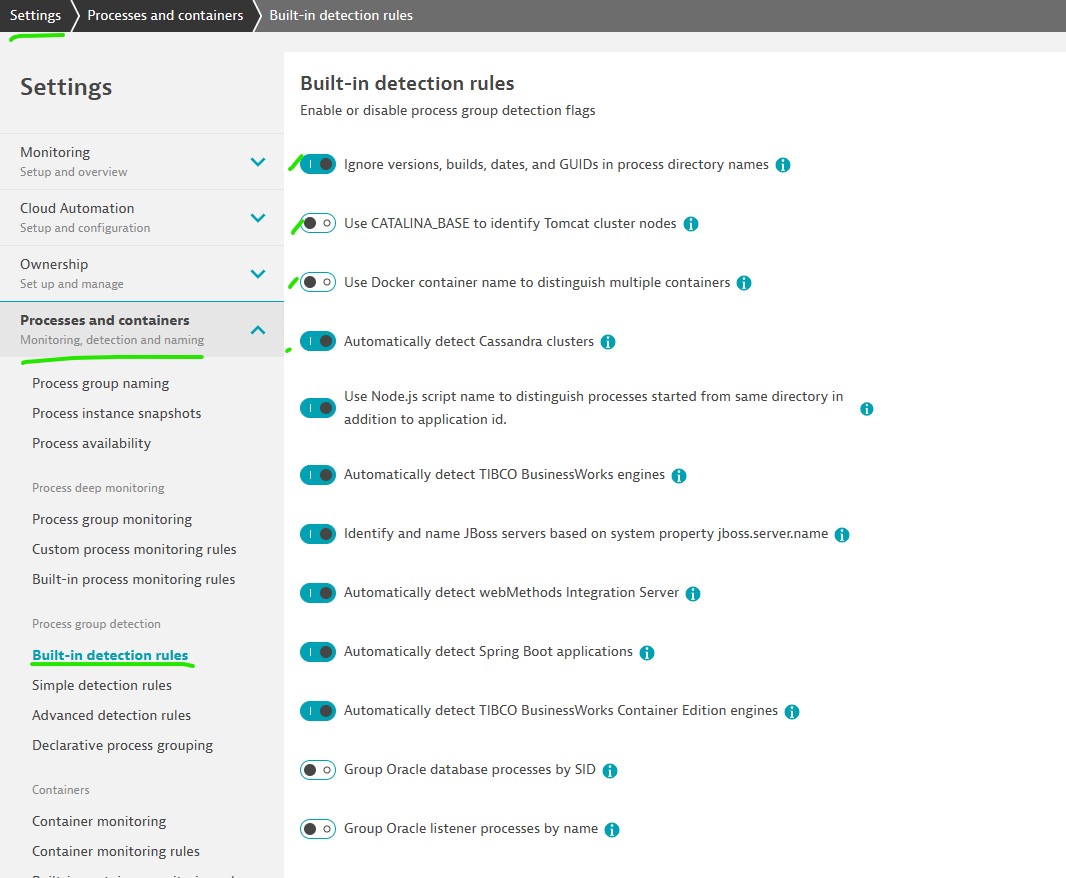
Builtin detection rules
Enable or disable process group detection flags.
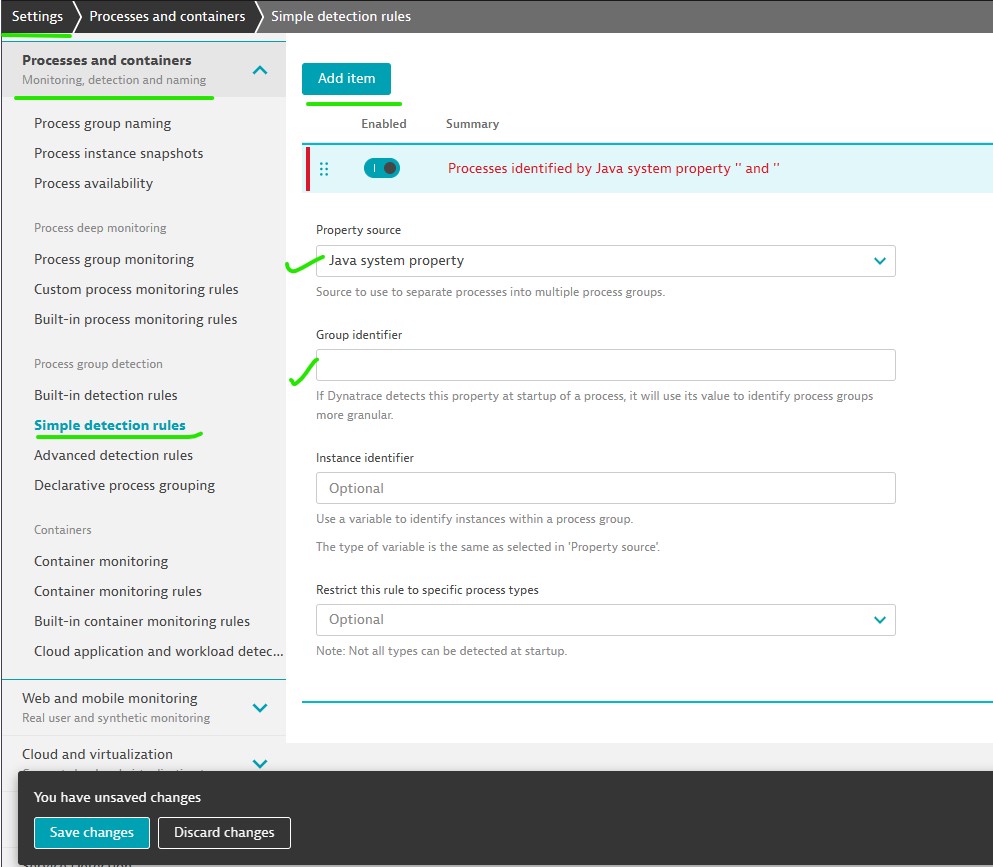
Simple detection rules
Simple process group detection rules enable you to adapt the default process-group detection logic for deep monitored processes via Java system properties or environment variables.
Advanced detection rules
Advanced detection rules are capable to extract additional process group and instance identifier from processes to fine tune the automatic detection logic of OneAgent
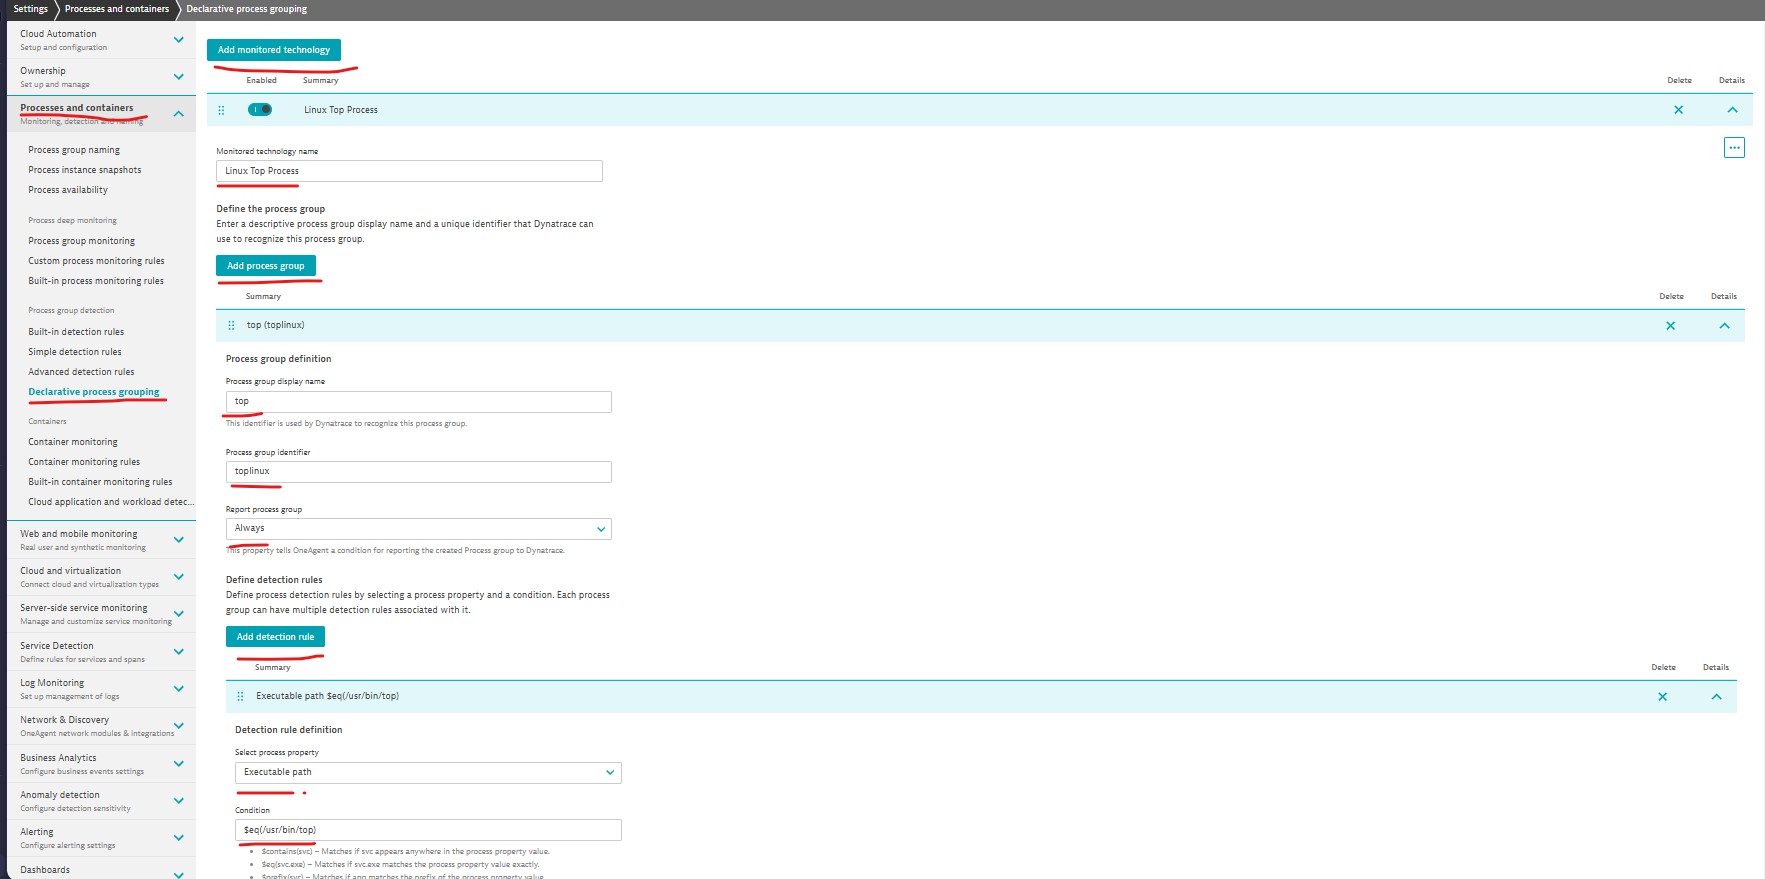
Declarative process grouping
Dynatrace automatically monitors process groups that are of known technology types or that consume significant resources. With declarative process grouping, you can automatically monitor additional technologies.
Monitoring
- Process group monitoring: Dynatrace OneAgent automatically monitors all process groups detected in your environment. Enable/disable automatic deep monitoring for all process.
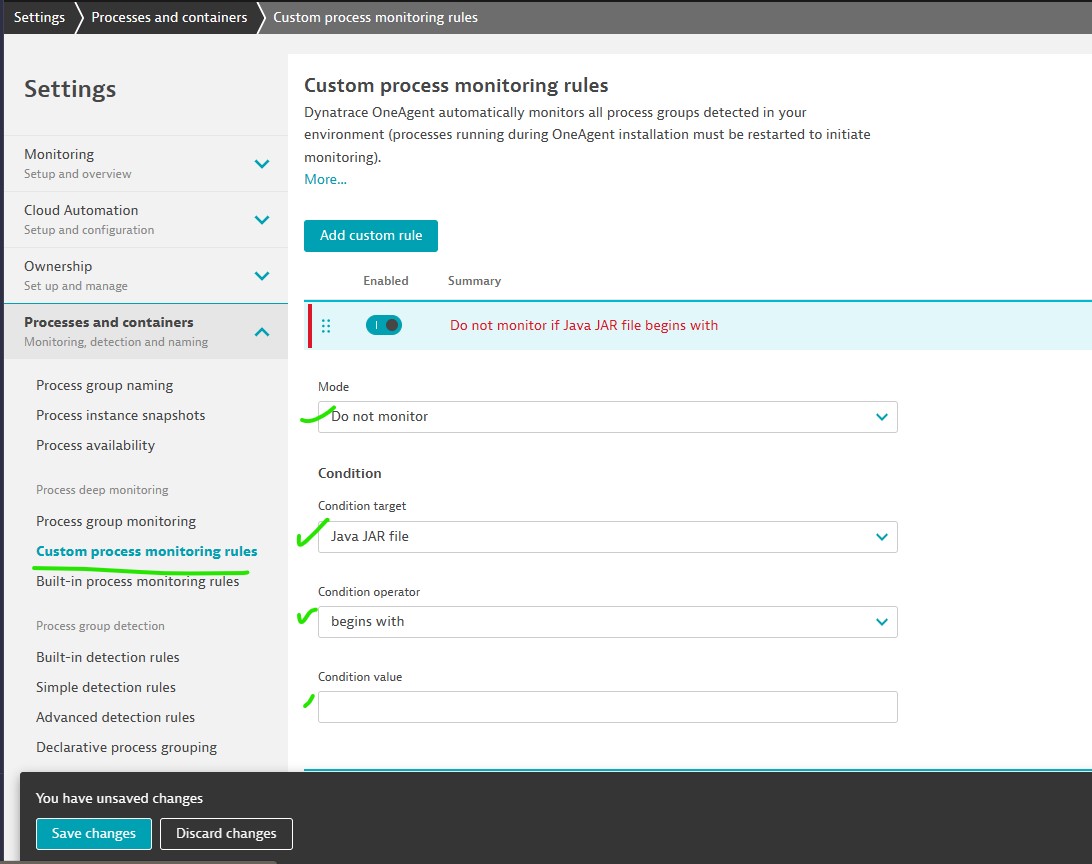
- Custom process monitoring rules: Create a custom rule to add/ignore deep monitoring for process matching certain rules.
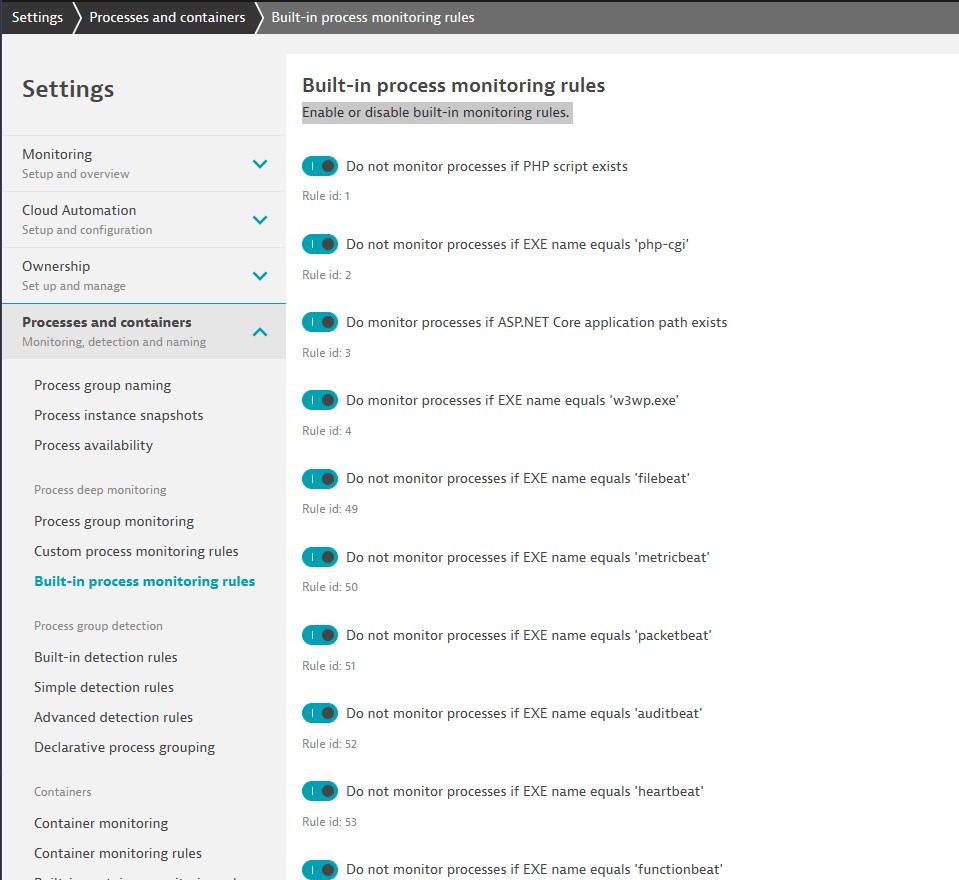
- Built-in process monitoring rules:Enable or disable built-in monitoring rules.
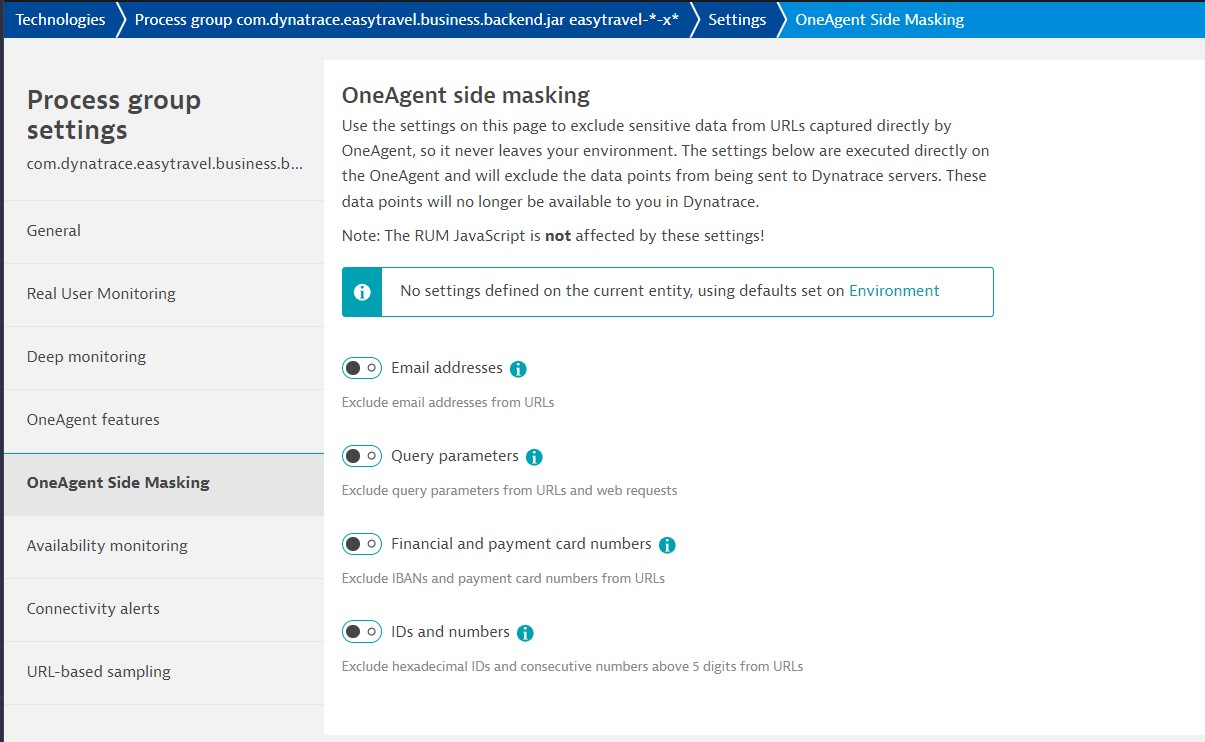
Process groups settings (Individual)
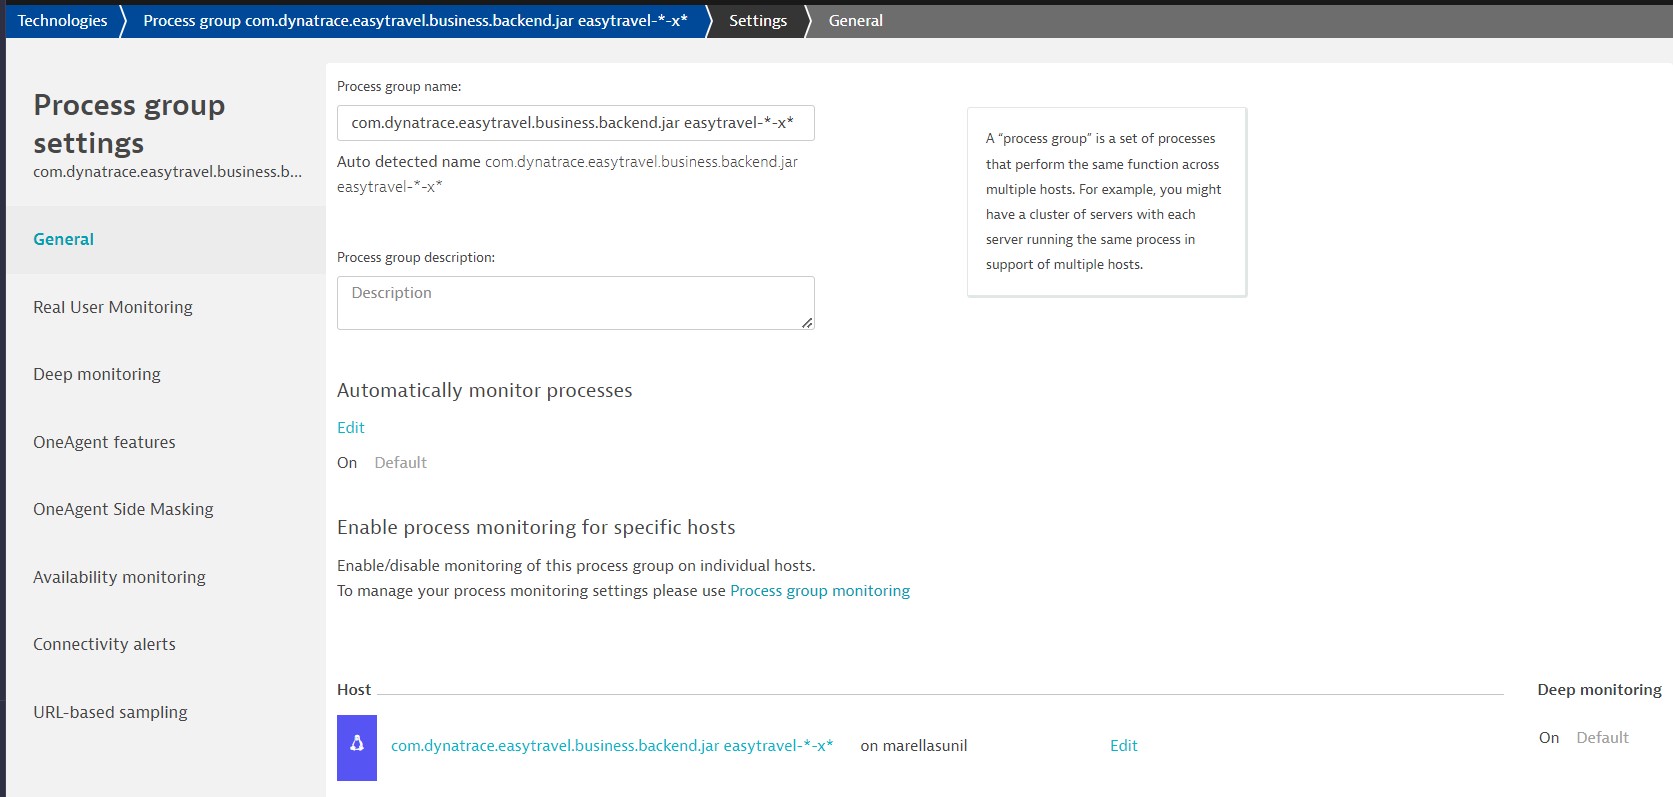
Maskign sensitive information from URL
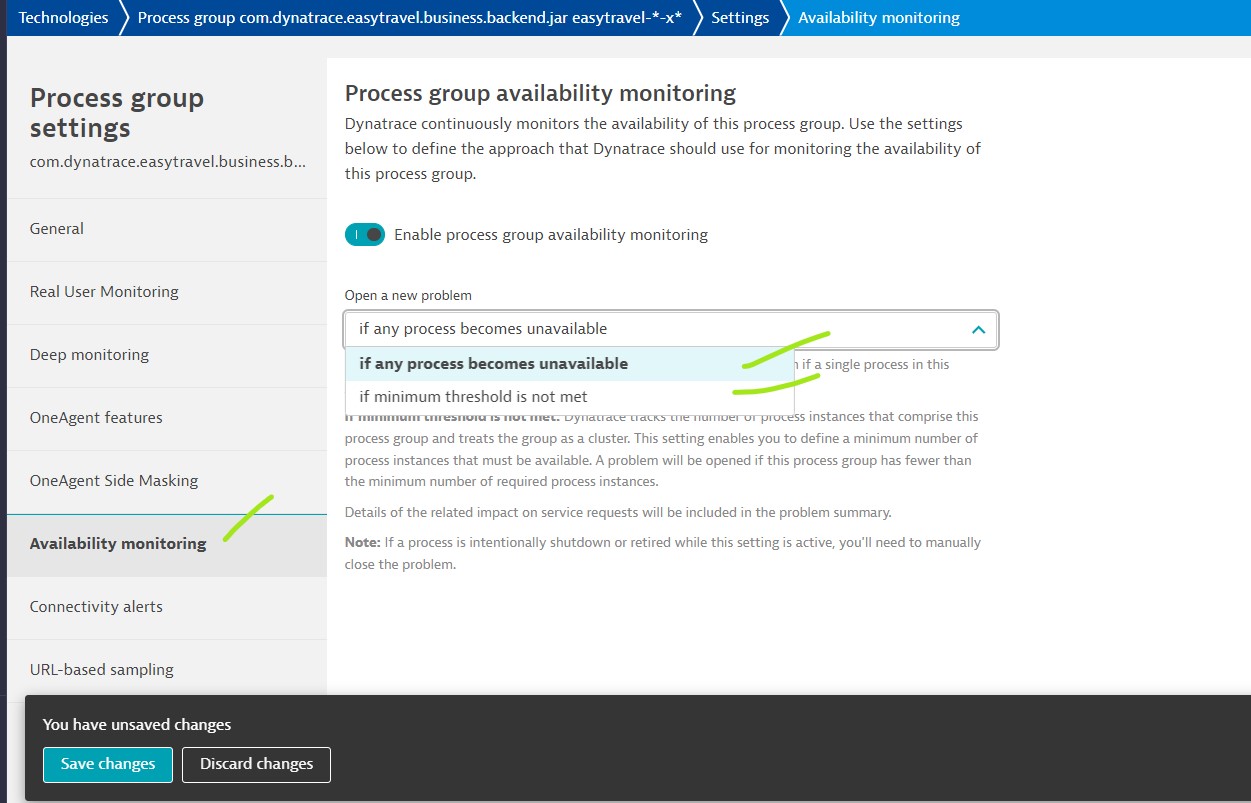
Setup availability monitoring
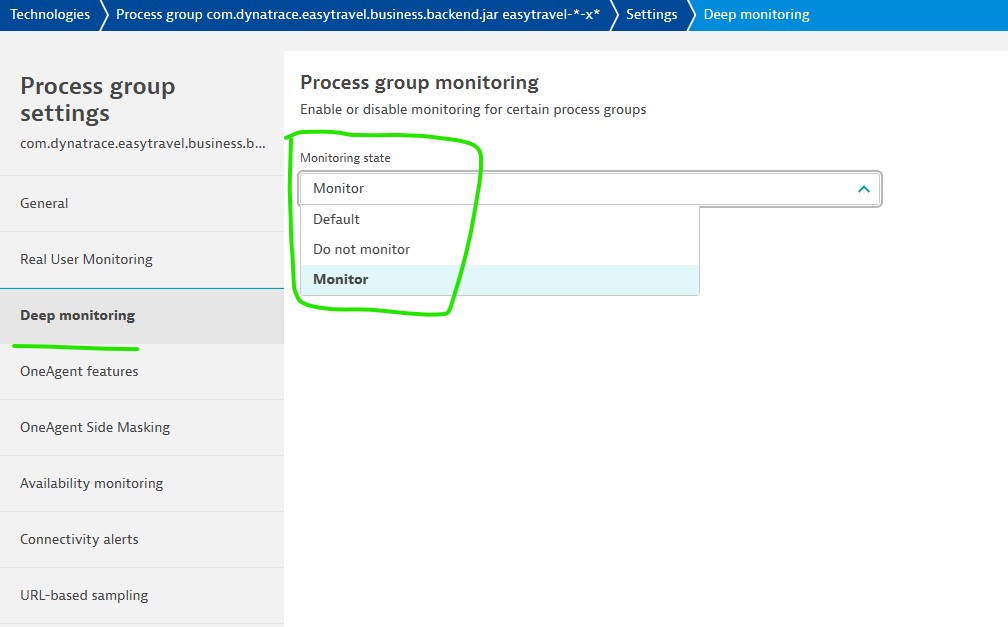
Process deep monitoring
Optionally, you can set up monitoring rules to selectively specify which processes Dynatrace monitors.
- You have a number of unimportant or short-lived processes that you don’t want to monitor at the code level.
- You aren’t able to run deep monitoring on applications that belong to your customers and are out of your control.
- You want to have better control over which processes are monitored.
Process Groups Settings (Host)
Detected process
List all detected process from the selected host
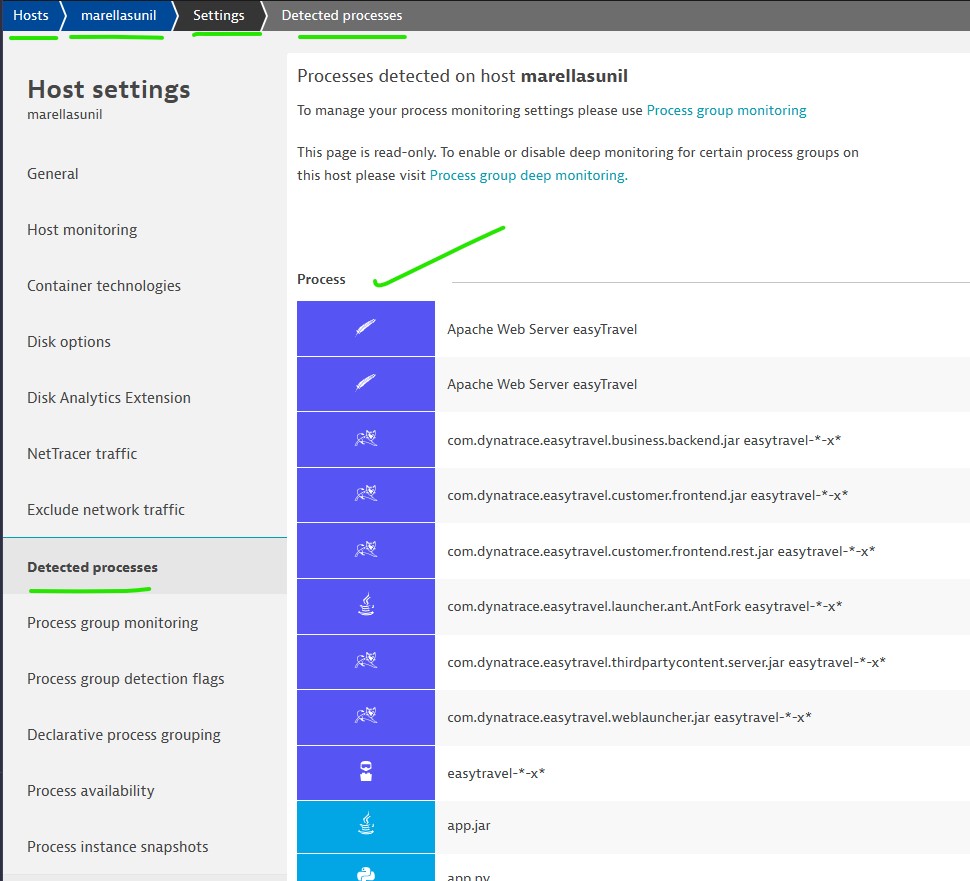
Process group monitoring: Enable or disable monitoring for certain process groups on this host Built-in detection rules: Enable or disable process group detection flags Declarative process grouping: Dynatrace automatically monitors process groups that are of known technology types or that consume significant resources. With declarative process grouping, you can automatically monitor additional technologies.
Example: Creating Process Group
Important Notes
- Declarative process grouping: Let you monitor custom process
- Custom process monitoring rules: Let you monitor/do not monitor certain type of process that it can monitor at the request- and PurePath levels.
Main Page: Services
Next Page: Application Management
Dynatrace : Main Page